Updated Date: 07/07/2026
Viewing DoS Reports, Statistics, and Logs
Once you have configured DoS protection on the BIG-IP® system, you can view charts, reports, statistics and event logs that show information about DoS attacks and mitigations in place on the system (Security > Reporting > DoS). For example, you can view the DoS Dashboard screen, which shows at-a-glance whether or not the system is under attack, the type of attack and IP addresses of the source and destination of monitored traffic. The DoS Dashboard screen also indicates the impact of DoS attacks on your virtual servers, in addition to overall system health.
The DoS Analysis screen you can view reports of transaction outcomes, and correlate the impact of system detection and the mitigation of DoS attacks to system health and performance indicators. The reports and event logs on the DoS Analysis screen help you to understand whether the DoS protection you have implemented is protecting your application’s performance, or whether you need to fine-tune the configuration. In addition, you can adjust the time line to view historical attacks and their trends, which can provide insight into the DoS threats your application commonly faces.
A dimension is a label for a specific behavior or behavior trends monitored by the BIG-IP system. Each dimension lists one or more entities that provides the specific attributes of statistics data. For example, when viewing activity from multiple virtual servers, the dimension Virtual Servers will list each individual virtual server that is monitored as an entity within that dimension. You can select one or more entities to filter monitored statistics with the corresponding charts and dimensions on the screen.
By default, the charts and dimensions tables display unfiltered data that is relevant to all monitored BIG-IP system aspects. You can filter the displayed data by selecting entities within dimensions in the Dimensions pane.
Important: Applying filters in the Dimensions pane updates all statistics displayed on screen with data that corresponds to your selection.
-
On the Monitoring tab, go to DASHBOARDS and select an overview page in Device,DNS, or Local Traffic. On the Monitoring tab, select an overview page in HTTP,Device, Local Traffic, or Events. On the Main tab, click Statistics > Analytics > HTTP. On the Main tab, click Security > Reporting > DoS > Analysis.
-
Locate the Dimensions pane on the right side of the screen.
-
Review DoS activity according to traffic module, and filter information by traffic module by selecting one of the buttons in the Dimensions pane.
Tip: Clear the module filter by clicking the selected module.
-
Review data according to pre-configured device group, and filter the displayed data according to a specific configuration by selecting an option from Device Group.
-
Review dimension entities and their statistics in table form by expanding a dimension widget. To filter by dimension entities, select one or more entities from that dimension.
For example: You can filter by selecting individual Virtual Servers or Applications to display statistics in the charts that are specific to your selection. You can select entities from multiple dimensions that have corresponding data.
-
You can adjust the table view by selecting the Dimensions pane handle and dragging it to the left side of the screen.
Tip: You can expand the pane to full screen view by double-clicking the Dimensions pane handle.
-
Clear all filter selections or those for a dimension:
- To clear all selections, click the gear icon at the top of the Dimensions pane and select Clear All.
- To clear selections for a dimension, click the options icon (three horizontal lines to the left of the title), and select Clear Selection.
The AVR charts display aggregated statistics for your entire BIG-IP system. You can create customized charts based on specific, compatible data of interest, with a comparison chart. You create comparison charts using dimension entities to highlight specific data metrics, or to compare multiple entities in one chart.
You can create new charts that present statistic information about your BIG-IP system for selected entities from a dimension in the Dimensions pane. Once a new chart is created, you can adjust the metric value that is presented. You can create multiple comparison charts per screen.
-
On the Monitoring tab, go to DASHBOARDS and select an overview page in Device,DNS, or Local Traffic. On the Monitoring tab, select an overview page in HTTP,Device, Local Traffic, or Events. On the Main tab, click Statistics > Analytics > HTTP. On the Main tab, click Security > Reporting > DoS > Analysis.
-
In the Dimensions pane, expand a dimension widget to view its entity list.
-
Select one or more dimension entities for the comparison chart by clicking the entity title. You can also select entities in other dimensions that have compatible data.
Note: Selecting entities automatically filters information in the Charts pane and compatible data in other dimensions. You can remove these filters once the comparison chart is created.
-
Click the dimension’s menu icon and select Add Comparison Chart.
Tip: You can right click one of the selected entities to view the dimension widget menu.
A comparison chart displays in the Charts pane.
-
Adjust the displayed metric unit by selecting a different metric from the list next to the comparison chart title.
By default, the chart displays data by the selected Sort By metric for the entity’s dimension.
Note: Comparison charts persist in the Charts pane until they are removed. You can remove a comparison chart by selecting the X icon in the top right corner of the chart.
The new comparison chart displays data for the selected entities in the Charts pane over the selected time period.
When available, you can view your traffic data in real time within the Charts area. Once the real time option is selected, there is a continual update of available data every 10 seconds within a one hour time range. Within the charts and dimension tables, the data displayed is averaged real time data over a 5 minute interval resolution. This is done in order to stabilize the data view when in real time. When applying multiple filters during real time monitoring session, the screen will discard the previous display settings and display a new data report according to the applied filters. It is therefore recommended to use multiple windows when monitoring several filter combinations.
Note: A device cluster displays the activity of the entire cluster, which results an additional 10 second delay for the displayed data.
Before you can investigate DoS attacks, you need to have configured DoS protection so that the system is capturing the analytics on the system.
You can use the DoS Dashboard screen for an overview of DoS attack activity on your BIG-IP system, and corresponding system information during DoS attacks.
Note: The dimensions Countries and IP addresses may report zero attacks, even when the system detects an ongoing attack. This may be because not enough information is available for these dimensions.
-
On the Main tab, click Security > Reporting > DoS > Dashboard.
Tip: For quick navigation to the DoS Dashboard screen, on the Main tab to go Statistics > DoS Visibility.
The DoS Dashboard screen opens and displays system information about all DoS attacks over a default time range.
-
Use the time settings at the top of the screen to set a time range or refresh the information on screen.
To immediately update the statistics on screen, adjust the time range or refresh settings.
Note: Time range settings are persistent when navigating between the DoS Dashboard and Analysis screens.
|
Time Focus |
Select the time range of the displayed data. Note: Additional time options become available as your system gathers more data. |
|
Currently Selected Time Range |
Displays the current time range of the displayed data. |
|
Auto-Refresh Interval Selector |
Select how frequently the data on this screen is refreshed. |
|
Real Time |
Activates the real time option to reflect the most current traffic status in the Charts area |
|
Manual Refresh |
Click Refresh to trigger an immediate refresh of the displayed data. |
|
Manual Time Adjustment Handles |
Set the data to a specific window of time within the currently selected time range. Use the handles at either end of the time line to define the specific time you want to examine. Use the handle above the time line to display data that is outside the selected time range.Note: Adjusting the time range to display previous data stops the auto-refresh so you can focus on a specific data point. |
You can zoom into a specific time range within a chart. Select an area within the chart and then click the magnifying glass icon.

**Note:** Selecting a time range within the chart stops the screen's auto-refresh settings.
-
Review the charts and tables that provide high-level information about your system’s status.
Tip: You can filter the entire screen’s displayed data to correspond with a specific data point by selecting entities in the charts, tables or map.
-
Review the Attack Duration and Attacks areas for recent or ongoing DoS attacks.
-
Review the Attack Duration area to determine the duration of each DoS attack over the selected time period, including ongoing attacks. In the Attack Duration chart, each horizontal bar represents an individual attack and indicates the start and end time of the attack, and the severity.
An ongoing attack extends to the end of the chart.
You can view additional attack information in the chart:
- Hover over an individual attack to view attack details, including Attack ID, Mitigation, Severity, Trigger and Vector.
- Hover over the chart area to view the number of attacks that occurred at a specific time in the chart legend.
-
Review the Attacks area to determine the distribution of DoS attacks over the selected time period.
-
Use the # of Attacks table to view a breakdown of the number of attacks according to the attack severity.
Note: You can select one or more values in this table to filter the entire screen according to an attack severity level.
-
Use the # of Attacks per Protocol chart to view the breakdown of attacks according to severity of attack and transaction protocol.
-
Use the table in this area to examine the details of each attack, according to Attack ID.
Note: You can view more information by hovering over the table’s data.
-
-
Review the Virtual Servers area to determine the impact of DoS attack’s on your system’s virtual servers.
- Use the # of Virtual Servers table to view a breakdown of your virtual servers health status according to each virtual server’s latency, client concurrent connections and throughput.
- Use the Virtual Servers Health chart to view a breakdown of virtual servers according to health score for each performance indicator that is used to evaluate health status.
- Use the table in this area to examine the health and corresponding attack details for each virtual server.
-
Review the tiles in the System Health area for a quick view of your BIG-IP system’s health status. Each health tile is color coded according to the overall severity of each parameter for the entire system. Severity ranges are as follows: Good, Moderate, Unhealthy and Critical.
Note: In a multi-blade system, each health parameter also displays the slots with the highest system activity.
-
Use the TMM CPU Usage tile to determine the status of the TMM’s CPU usage, and if the system has crossed any critical thresholds.
Note: You can select from the drop-down icon to view a list of the busiest cores. For a multi-blade system, a list of the busiest cores is available for each slot.
-
Use the Memory Usage tile to determine your system’s average TMM memory usage (out of total RAM allocated to TMM processes), and if the system has crossed any critical thresholds.
-
Use the Client Throughput tile to determine the average rate of bits per seconds transmitted during client-side transactions with your BIG-IP system.
-
Use the Client Connections tile to determine the average number of client concurrent connections with your BIG-IP system over the selected time period.
-
-
Review the Countries area for information about the geolocation of traffic handled by your BIG-IP system.
-
Filter location information by client IP or the intended destination IP. Select Source to filter by client IP/country or Destination(Network) to filter by the server IP/country.
-
Use the map to evaluate the global distribution of traffic, and the frequency of attacks from a country origin or destination. Countries are color-coded according to the frequency of attacks. You can select a country within the map to filter the entire screen by IPs from that destination or origin.
Note: Countries in grey do not have sufficient traffic information.
-
Use the table in this area to examine the traffic information by country.
-
-
To view more details of your DoS activity, click Security > Reporting > DoS > Analysis.
Tip: From the Dashboard, you can automatically filter specific Attack IDs or Virtual Servers in the DoS Analysis screen, by selecting the chart icon from a table row.
You can continue to review the system snapshot using the DoS Dashboard screen. As a result, you become more familiar with you system’s activities during DoS attacks. You can also view the statistics in graphical charts and in tables, focusing on the specific data you need using attack and dimension filters.
Before you can investigate DoS attacks, you need to have configured DoS protection so that the system is capturing the analytics on the system.
You can use the DoS Analysis screen to analyze the impact of DoS attacks on your BIG-IP system, traffic, or to detect any system performance issues.
-
On the Main tab, click Security > Reporting > DoS > Analysis.
The DoS Analysis screen displays the aggregated statistics of system information for the selected time period.
Tip: To drill down into specific system information in the charts, use the settings in the Dimensions pane to highlight data of interest.
-
Use the time settings at the top of the screen to set a time range or refresh the information on screen.
To immediately update the statistics on screen, adjust the time range or refresh settings.
Note: Time range settings are persistent when navigating between the DoS Dashboard and Analysis screens.
|
Time Focus |
Select the time range of the displayed data. Note: Additional time options become available as your system gathers more data. |
|
Currently Selected Time Range |
Displays the current time range of the displayed data. |
|
Auto-Refresh Interval Selector |
Select how frequently the data on this screen is refreshed. |
|
Real Time |
Activates the real time option to reflect the most current traffic status in the Charts area |
|
Manual Refresh |
Click Refresh to trigger an immediate refresh of the displayed data. |
|
Manual Time Adjustment Handles |
Set the data to a specific window of time within the currently selected time range. Use the handles at either end of the time line to define the specific time you want to examine. Use the handle above the time line to display data that is outside the selected time range.Note: Adjusting the time range to display previous data stops the auto-refresh so you can focus on a specific data point. |
You can zoom into a specific time range within a chart. Select an area within the chart and then click the magnifying glass icon.

**Note:** Selecting a time range within the chart stops the screen's auto-refresh settings.
-
Review the BIG-IP Health area to detect any BIG-IP device health issues.
-
Use the Memory Usage (GB) chart to analyze the distribution of system memory that is currently in use.
Note: In a multi-blade system, the chart displays the system average of all blades.
-
Use the Top Busiest CPU Cores (%) chart to view the percent usage of the top five busiest TMM CPU cores. If your BIG-IP system has five CPU cores or fewer, this chart displays all active TMM CPU cores.
Note: In a multi-blade system, the chart displays the top five busiest slots of all CPU cores.
-
-
Review the Virtual Servers area to define the health or performance status of your virtual servers. Select a single entity from the Virtual Servers dimension to display data.
Important: The statistics displayed in the Virtual Servers charts represent the metrics that are specific to a single virtual server, and are not affected by all dimension filters.
- Use the Average New Connections (conn/s) chart to analyze the average number of new system connections per second.
- Use the Average Concurrent Connections (conn/s) chart to analyze the average number of simultaneous connections per second that your BIG-IP system maintains.
- Use the Connections Activity chart to analyze the average number of unsuccessful connections out of all attempted transactions and why the transaction was unsuccessful.
- Use the Average Throughput in bits/s chart to analyze the average number of bits transferred per second during each part of the transaction process.
- Use the Total Health chart to determine the health score of your virtual servers. The health score is a percent value, where a higher score indicates good virtual server health. The total score is calculated using the pre-defined thresholds for CPU, memory, throughput and connections.
- Use the Max Number of Attacks chart to analyze the number and type of detected attacks over the selected time period.
- Use the Distinct Count of IPs chart to analyze the number of concurrent connecting IP addresses to a single virtual server, and the number of IP addresses that were deemed as malicious by the BIG-IP system.
-
Review the Attacks area to analyze the characteristics of a single attack.
Note: Select a single entity from the Attack IDs dimension to display data.
-
Use the Number of IPs Participating in an Attack chart to analyze the number of IP addresses involved in carrying out the selected attack.
Note: In a multi-blade system, the number of IP addresses shown includes all blades.
-
Use the Attack Severity chart to analyze the severity score of the selected attack. The attack score is a percent value, where a higher score indicates greater attack severity and potential for impact. The score is based on a scale from the duration of the attack (based on start and end time), number of attacking IP addresses and the number of mitigation events per second.
-
-
Review the HTTP area for application traffic activity and to evaluate how DoS attacks impact traffic performance.
- Use the Transaction Outcomes (Average TPS) chart to analyze the outcome assigned by the BIG-IP system to the application request and response exchange.
- Use the Server Latency (ms) chart to determine the time required for a server response once the BIG-IP system sends a request.
- Use the Throughput (bps) chart to determine the average number of bytes per second processed by the BIG-IP system during application requests and responses.
- Use the Client Types chart to analyze the means by which HTTP requests are initiated.
-
Review the Network area to evaluate the number and type of network transactions that were monitored by the BIG-IP system.
-
Review the DNS Transaction Outcomes area to evaluate the outcome assigned by the BIG-IP system to the DNS request and response exchange.
-
Review the ****SIP Transaction Outcomes area to evaluate the outcome assigned by the BIG-IP system to the SIP request and response exchange.
You can continue to review system statistics on the entire system to monitor activity during, or after DoS attacks. You can focus on the specific data you need using the filters and comparison chart option provided in the Dimensions pane.
You can display DoS Application Event logs to see whether L7 DoS attacks have occurred, and view information about the attacks. The logs show details about the DoS events.
-
On the Main tab, click Security > Event Logs > DoS > Application Events.
The DoS Application Events screen opens, and if Layer 7 DoS attacks were detected, it lists the details about the DoS attack such as the start and end times, how it was detected and mitigated, the attack ID, and so on.
-
If DoS attacks are listed, review the list of attacks to see what has occurred, when it occurred, the mitigation, and the severity of the attack. The plus icon can be used to expand more details of the attack. It will expand to list the participating entities (IPs and URLs) and their thresholds (TPS).
-
From the event log, click the Attack ID link for an attack or event to display information about the attack in a graphical chart.
For the URL Latencies report to include useful information, you need to have created a DoS profile and associated it with the application’s virtual server for the system to capture the latency statistics for the application.
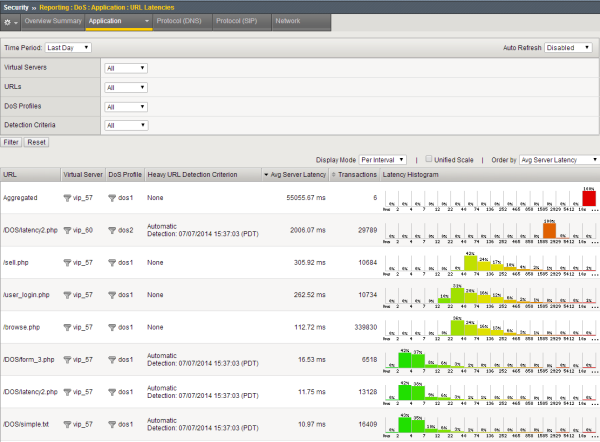
You can display a report that shows information about the latency of traffic to specific web pages in your application. The report lists the latency for each URL separately, and one row lists the latency for all URLs combined. You can use this report to check that the latency threshold is close to the value in the latency histogram column for all traffic.
-
On the Main tab, click Security > Reporting > DoS > URL Latencies.
The URL Latencies reporting screen opens.
-
From the Time Period list, select the time period for which you want to view URL latency, or specify a custom time range.
-
If you want to filter the information by virtual server, DoS profile, URL, or detection criteria, specify the ones for which you want to view the URL latency, and click Filter.
By default, the report displays information for all items.
-
Adjust the chart display options as you want.
Display Option Description Display Mode Select whether to display the information as Cumulative or as related to the respective latency range, Per Interval. Unified Scale Select this check box to display all histograms using a single scale for all URLs, rather than a separate scale for each one. Order by Select the order in which to display the statistics: by the average server latency, the number of transactions, the histogram latency ranges (in milliseconds), or by how heavy URLs were detected (automatically detected or manually set). -
Review the server latency statistics.
- The report shows the latency results for the most active URLs.
- The Aggregated row summarizes the statistics for the URLs not included in the report.
- The Overall Summary shows the latency of all traffic.
-
Use the Latency Histogram, to the far right of the URL row, to view the percentage of URL traffic at each window of recorded latency time (in ms).
The histogram displays the percent of total successful traffic to the URL over the selected time period.
-
To focus in on the specific latency details for a URL, click the latency histogram.
A magnified view of the URL’s histogram is displayed in a separate window. The latency histogram displays the number of successful HTTP transaction outcomes for each range of latency (0-2 ms, 2-4 ms, and so on up to 10000 ms or 10 seconds).
The URL Latencies report shows how fast your web application returns web pages and can show typical latency for applications on your system (application data is recorded through virtual servers associated with a DoS profile) . It can help you to identify slow pages with latency issues that may require additional troubleshooting by application developers.
You can also use the URL Latencies report for the following purposes:
-
To determine threshold latency, to identify heavy URLs.
Tip: Set the heaviness threshold to approximately 90-95% of the latency distribution for the site. Filter the data by site (tby virtual server and DoS profile), and check the latency distribution in the histogram of the Total row.
-
To track known heavy URLs. You can add or remove manually configured heavy URLs depending on the information in the report.
-
To monitor the latency distribution of traffic to a URL.
This figure shows a sample URL Latencies report for a system that has two DoS profiles and two virtual servers. It shows the latency for several web pages ranging from 10.97 ms to 2006.07 ms. One page (/DOS/latency2.php) has very high latency and might require some troubleshooting. In this case, the system determined that URL to be “heavy” based on traffic. While investigating the latency of URLs that take longer to display, if it is acceptable, you may decide to add them to the list of Ignored URLs in the DoS profile so they do not trigger DoS mitigation.
You can create a customized DoS reporting screen so that it shows the specific data you are interested in, such as the top DoS attacks and server latency.
-
On the Main tab, click Security > Reporting > DoS > Custom Page.
The DoS Custom Page screen opens, and shows default widgets (sections) you may find useful.
-
Review the charts and tables provided, and click the configuration icon to adjust or delete them, as needed.
- To modify the widget and change what it displays, click the gear icon and select Settings. On the popup screen, adjust the values that control what is displayed.
- To remove the widget from the custom page, click the gear icon and select Delete.
-
To create a new widget to your specifications, click Add Widget.
The Add New Widget popup screen opens where you can select custom options for what to include, the time frame, and how to display the information.
-
Continue adjusting the custom page so that it shows the information you want.
You can drag and drop the widgets to change the order in which they are displayed. You can set the time range for all widgets or for each one separately.
-
To save the information shown in the custom report to a file or email attachment, click Export and choose your options.
You can also export the data from a single widget by selecting Export from the configuration icon.
You have created a custom page that includes the information you need to monitor your system. As you use the reports to investigate DoS attacks, you can adjust the custom page to include additional data that you need. You can save the reports or send them to others who want to review the data.
You can create a logging profile to log bot defense requests on systems set up to do proactive bot defense.
-
On the Main tab, click Security > Event Logs > Logging Profiles.
The Logging Profiles list screen opens.
-
Click Create.
The Create New Logging Profile screen opens.
-
In the Profile Name field, type a unique name for the profile.
-
Select Bot Defense.
-
To log bot defense attacks locally, select Local Publisher.
-
To send the log to a remote reporting server (such as Splunk, Arcsight, or syslog), from Remote Publisher, select the name of the publisher.
-
Select which requests to include in the log:
- Log Illegal Requests: Requests that failed the proactive bot defense tests, such as suspicious browser or wrong CAPTCHA responses. Note that JS challenges that are never responded to are not included here.
- Log Captcha Challenged Requests: Requests that are responded to a Captcha challenge as part of the suspicious browser tests.
- Log Challenged Requests: Requests that are responded to with a JS challenge for new clients or clients renewing their cookies.
- Log Bot Signature Matched Requests: Requests that matched any of the Bot signatures with the action block or report.
- Log Legal Requests: Requests that passed through.
-
Click Finished.
-
Associate this logging profile with the virtual server being protected with bot defense:
-
Go to Local Traffic > Virtual Servers, then click the virtual server.
-
Under Security, select Policies.
-
In the Log Profile setting, move the log profile from Available to Selected.
-
Click Update.
-
-
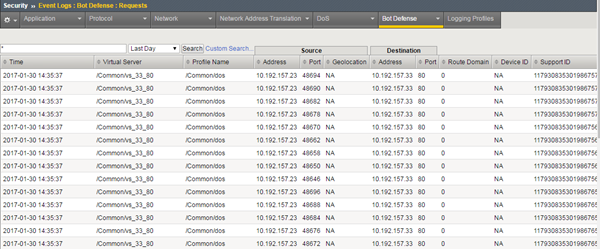
After passing traffic, you can view the bot defense event log: Click Security > Event Logs > Bot Defense.
Use the arrow keys to scroll to see the full details for each bot defense request.