Updated Date: 07/07/2026
Displaying Reports and Monitoring ASM
You can use several reporting tools in Application Security Manager (ASM) to analyze incoming requests, track trends in violations, generate security reports, and evaluate possible attacks. The statistics and monitoring reporting tools are described in this table.
| Reporting Tool | Description |
|---|---|
| Application security overview | Displays a summary of all configured security policies showing the active security policies, attacks that have occurred, anomaly statistics, and networking and traffic statistics. You can save the information or send it as an email attachment. |
| Requests summary | Summarizes the requested URLs for security policies. |
| Event correlation | Displays a list of incidents. Incidents aggregate illegal requests that are likely to be part of a suspected attack on the web application. Incidents separate false positive events from malicious activity and facilitate incident response. Incidents originate from a single source, either a Device ID, or, if not available, a Source IP. Incidents are triggered based on single or multiple correlation heuristics applied to illegal requests. Refer to the online help for details on how to view incidents: Event Logs > Event Correlation. |
| Charts | Displays graphical reports about security policy violations and provides tools that let you view the data by different criteria, drill down for more data, create customized reports, and send or export reports. |
| Charts scheduler | Allows you to periodically generate specific reports and distribute them using email. |
| DoS Attacks report | Displays graphic charts about DoS attacks, viewed by selected category, and includes the attack start and end times. |
| Brute Force Attacks report | Displays graphic charts about brute-force attacks, viewed by selected category, and includes the attack start and end times. |
| Web Scraping statistics | Displays graphic charts about web scraping attacks, viewed by selected category, and includes the attack start and end times. |
| Session Tracking status | Displays the users, sessions, and IP addresses that the system is currently tracking, and for which the system is taking action as a result of having triggered one of the violation detection thresholds. |
| PCI Compliance report | Displays a printable Payment Card Industry (PCI) compliance report for each security policy showing each security measure required for PCI-DSS 1.2, and compliance details. |
| CPU Utilization report | Displays the amount of the available CPU that the Application Security Manager uses over a period of time. |
To view data in the security overview, the system must be logging data internally. Some default logging profiles are already set up on the system but you may want to customize them.
The Application Security Manager (ASM) can display a security overview where you can quickly see what is happening on your system. The overview is configurable and can include statistics concerning attack types, violations, and anomalies, traffic summaries, transactions per second, throughput, and top requested URLs, IP addresses, and request types. You can also export the statistics into a PDF, and email them as an attachment.
-
On the Main tab, click Security > Overview > Application > Traffic.
The Overview Traffic screen opens and summarizes ASM system activity at a glance.
-
If using device groups, from the Device Group list, select a device group to narrow down the statistics.
-
To change the default time frame for all widgets, select a time period from the Override time range to list.
-
From the Security Policy list, select a security policy to narrow down the statistics.
By default, statistics for all active security policies are shown.
-
Review the summary statistics (organized into areas called widgets) to determine what is happening on the system.
-
If you want to create a new area of information customized to your specifications, at the bottom of the screen, click Add Widget.
The Add New Widget popup screen opens.
-
Optionally, for each widget, you can adjust the time range, data measurements, and format of data to display from the Time Period list (Last Hour, Last Day, Last Week, Last Month, or Last Year) or the configuration gear settings.
You can also delete any widget that you do not need on the screen.
-
To save the summary as a PDF file on your computer:
-
Click the Export link.
-
In the popup screen that opens, click Export again to save the file on your computer.
-
-
To send the report as an email attachment, click the Export link.
Note: To send email, you need to configure an SMTP server. If one is not configured, on the Main tab, click System > Configuration > Device > SMTP, and then click Create to configure one first.
-
Click Send the report file via E-Mail as an attachment.
-
In the Target E-Mail Address(es) field, type the one or more email addresses (separated by commas or semi-colons).
-
From the SMTP Server list, select the SMTP server.
-
Click Export.
The systems sends an email with the PDF to the specified addresses.
-
You can adjust the overview and create widgets for the information you are interested in.
To review requests with violations, you need to have a security policy that is already handling traffic that is causing violations. If no violations have occurred, you will not see illegal requests listed in the Requests List.
In the Requests List event log, you can view details about a request, including viewing the violation rating, the full request itself, and any violations associated with it. You can also drill down to view detailed descriptions of the violations and potential attacks. When viewing details about an illegal request, if you decide that the request is trusted and you want to allow it, you can accept the violations shown for this specific request.
-
On the Main tab, click Security > Event Logs > Application > Requests.
The Requests screen opens, where, by default, you view an event log displaying illegal requests for all security policies.
-
In the Requests List, click a request to view information about the request and any violations associated with it.
The screen refreshes, showing the Request Details area, where you see any violations associated with the request and other details, such as the security policy it relates to, the support ID, the violation rating, and potential attacks that it could cause.
-
Use the Violation area elements to view details about a violation associated with an illegal request:
- To view details about this specific violation such as the file type, the expected and actual length of the query, or similar relevant information, click the violation name.
- To display a general description of that type of violation, click the info icon to the left of the violation name.
-
For violations that you want to allow (false positives), click the Learn button.
Some violations cannot be learned; the Learn button is unavailable in this case.
If there are learning suggestions, the violation’s learning screen opens, and you can accept or clear the suggestions one at a time.
-
To view the actual contents of the request, click HTTP Request or HTTP Response.
-
When you are done looking at the request details, click Close.
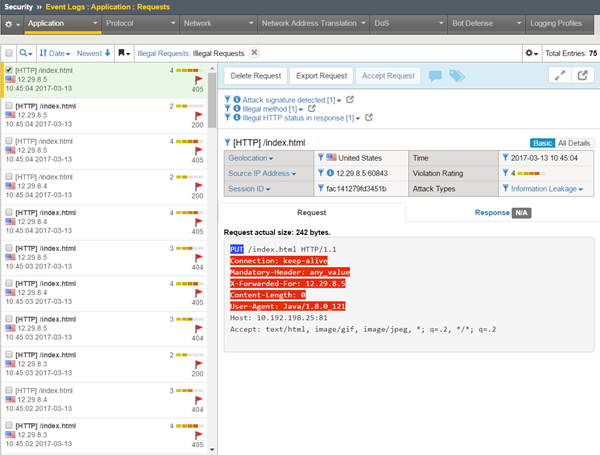
The Requests List provides information about a request such as: the request category, the time of the request, its violation rating, the source IP address of the request, the server response code, and the requested URL itself. Icons on each request line provide additional status information such as whether the request is legal or illegal, blocked, truncated, or has a response. By reviewing the request details, you can investigate whether it was an attack or a false positive.
To see if any violations have recently occurred, you can examine the Requests event log. It is a good idea to look for spikes and irregular behavior in the Requests log because these usually indicate suspicious activity. As shown in the following figure, you may see several illegal requests. The violation ratings (numbers from 1-5) indicate how likely a request is to be an attack (typically 4 or 5) or a false positive (often 1 or 2). In the figure, the first request has been selected and details appear on the right.
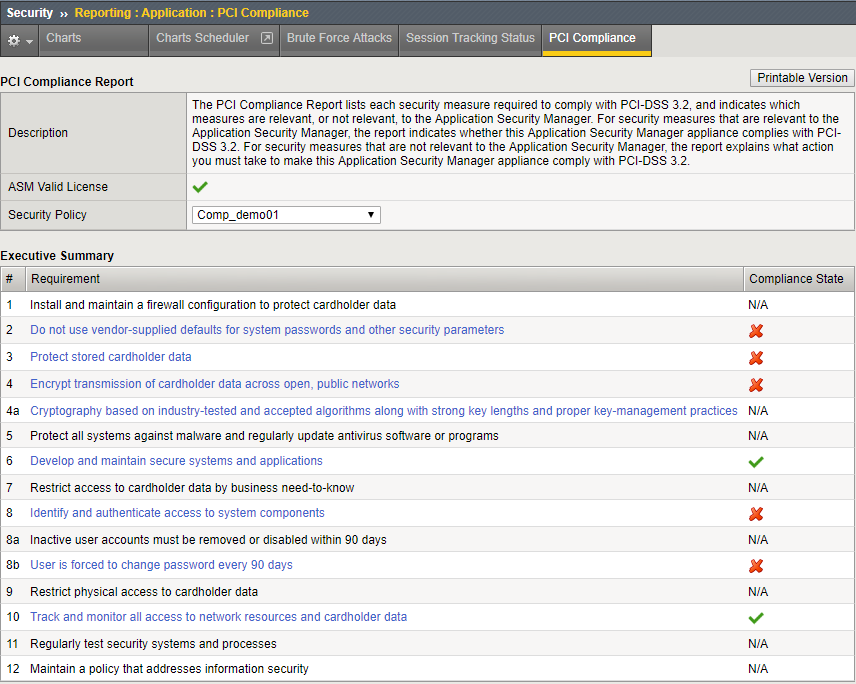
A PCI Compliance report displays details on how closely the security policy of a web application meets Payment Card Industry (PCI) security standards, PCI-DSS 3.0. You can create printable versions of PCI compliance reports for each web application to assure auditors that the BIG-IP system and your web applications are secure.
-
On the Main tab, click Security > Reporting > Application > PCI Compliance.
The PCI Compliance screen opens showing a compliance report for the current security policy.
-
To learn more about items that are PCI compliant (items with a green check mark), those which are partially compliant, or those which are not PCI compliant (items with a red X), click the item link in the Requirement column.
The screen shows information about how to make an item PCI-compliant.
-
Optionally, in the Details list, you can click a hyperlink (blue text) to go directly to the screen where you can adjust the non-compliant settings.
-
To create a PDF version of the report that you can save, open, or print, click Printable Version.
-
To display a PCI compliance report for a different security policy, in the PCI Compliance Report area, from the Security Policy list, select a different policy name.
A PCI compliance report for the selected policy opens.
The PCI Compliance report lists the security measures that are required to comply with PCI standards. The report indicates which requirements Application Security Manager can help enforce, and allows you to view details about what to configure differently to meet compliance standards.
This sample PCI Compliance report examines the security policy called Comp_demo01. It shows five requirements that do not comply with PCI-DSS 3.2 (marked with red Xs). Application Security Manager™ has settings that support bringing these requirements into compliance.