Updated Date: 07/07/2026
Viewing DDoS Reports, Statistics, and Logs
Before you can investigate DDoS attacks, you need to have configured DoS protection so that the system is capturing the attack event on the system.
The DoS Overview screen shows a snapshot of statistics about ongoing network, DNS, and SIP attacks, and allows you to adjust the vector settings for those attacks. It does not include HTTP statistics.
-
On the Main tab, click DoS Configuration > DoS Overview (non HTTP).
The DoS Overview screen opens and displays details about ongoing DoS attacks.
-
Review the DoS attack information in the table.
The information is initially filtered by DoS Attack and shows consistent or severe attacks.
-
To view the information by different contexts, for Filter Type, select another filter.
When you select filters other than DoS Attack, the DoS Overview shows ongoing attacks and any configuration changes that have occurred. For example, if filtering by Protected Object, you will see attacks on that specific object and any configuration changes that were made to it. The Device DoS filter shows all Device DoS vectors, regardless of attack state.
-
To view the settings and thresholds used to determine an attack, select one of the attacks listed and click << on the upper right to open the Properties pane.
-
In the Properties pane, adjust the settings as needed.
For example, if you notice that normal activity is being considered an attack, you can raise the thresholds for that vector in the Properties pane. Or, you can disable a vector, allowing traffic, until you investigate further.
-
When you finish adjusting the settings, click Commit Changes to System.
You can continue to review DoS attack details using the DoS Overview screen to become more familiar with the types of attacks your network is experiencing, examining attack status, average traffic levels, dropped packets, and current thresholds. You may also want to review relevant settings for the protected object, protection profile, or device protection to further tune DoS protection. You can investigate further by looking at the charts and event logs on the Main tab under Visibility.
Before you can investigate DDoS attacks, you need to have configured DoS protection so that the system is capturing the attack event on the system.
On the DoS Dashboard, you can display an overview of DoS attack activity and review corresponding system information on the system.
-
On the Main tab, click Visibility > Dashboard.
The DoS Dashboard screen opens and displays real time system information about all DoS attacks over the last hour.
-
Click Real Time and choose a time frame between Last hour and Year to date.
-
Move the sliders to the left and right of the displayed time range to narrow or focus the range.
-
Review the charts and tables that provide high-level information about your system’s status.
Tip: You can filter the entire screen’s displayed data to correspond with a specific data point by selecting entities in the charts, tables or map.
-
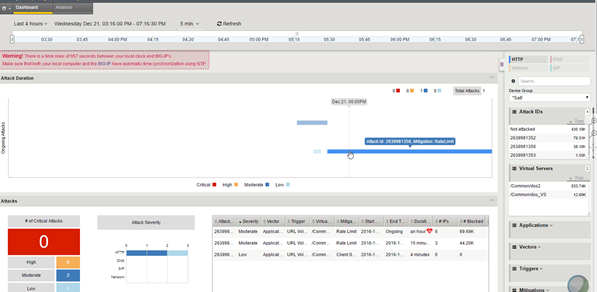
Review the Attack Duration and Attacks areas for recent or ongoing DoS attacks.
-
Review the Attack Duration area to determine the duration of each DoS attack over the selected time period, including ongoing attacks. In the Attack Duration chart, each horizontal bar represents an individual attack and indicates the start and end time of the attack, and the severity.
An ongoing attack extends to the end of the chart.
You can view additional attack information in the chart:
- Hover over an individual attack to view attack details, including Attack ID, Mitigation, Severity, Trigger and Vector.
- Hover over the chart area to view the number of attacks that occurred at a specific time in the chart legend.
-
Review the Attacks area to determine the distribution of DoS attacks over the selected time period.
-
Use the # of Attacks table to view a breakdown of the number of attacks according to the attack severity.
Note: You can select one or more values in this table to filter the entire screen according to an attack severity level.
-
Use the # of Attacks per Protocol chart to view the breakdown of attacks according to severity of attack and transaction protocol.
-
Use the table in this area to examine the details of each attack, according to Attack ID.
Note: You can view more information by hovering over the table’s data.
-
-
Review the Virtual Servers area to determine the impact of DDoS attacks on your system’s protected objects.
- Use the Virtual Servers table to view a breakdown of your protected objects’ health status according to each protected object’s latency, client concurrent connections and throughput.
- Use the Virtual Servers Health chart to view a breakdown of protected objects according to health score for each performance indicator that is used to evaluate health status.
- Use the table in this area to examine the health and corresponding attack details for each protected object.
-
Review the tiles in the System Health area for a quick view of your BIG-IP system’s health status. Each health tile is color coded according to the overall severity of each parameter for the entire system. Severity ranges are as follows: Good, Moderate, Unhealthy and Critical.
Note: In a multi-blade system, each health parameter also displays the slots with the highest system activity.
-
Use the TMM CPU Usage tile to determine the status of the TMM’s CPU usage, and if the system has crossed any critical thresholds.
Note: You can select from the drop-down icon to view a list of the busiest cores. For a multi-blade system, a list of the busiest cores is available for each slot.
-
Use the Memory Usage tile to determine your system’s average TMM memory usage (out of total RAM allocated to TMM processes), and if the system has crossed any critical thresholds.
-
Use the Client Throughput tile to determine the average rate of bits per seconds transmitted during client-side transactions with your BIG-IP system.
-
Use the Client Connections tile to determine the average number of client concurrent connections with your BIG-IP system over the selected time period.
-
-
Review the Countries area for geolocation information regarding the traffic handled by your BIG-IP system.
-
Filter location information by client IP or the intended destination IP. Select Source to filter by client IP/country or Destination(Network) to filter by the server IP/country.
-
Use the map to evaluate the global distribution of traffic, and the frequency of attacks from a country origin or destination. Countries are color-coded according to the frequency of attacks. You can select a country within the map to filter the entire screen by IPs from that destination or origin.
Note: Countries in grey do not have sufficient traffic information.
-
Use the table in this area to examine the traffic information by country.
-
-
To view more details of your DoS activity, click Security > Reporting > DoS > Analysis.
Tip: From the Dashboard, you can automatically filter specific Attack IDs or Virtual Servers in the DoS Analysis screen, by selecting the chart icon) from a table row.
You can continue to review the system snapshot using the DoS Dashboard screen. As a result, you become more familiar with system activities during DoS attacks. You can also view the statistics in graphical charts and in tables, focusing on the specific data you need using attack and dimension filters.
This figure shows a sample DoS Dashboard on a system that is having a low-level DoS attack now.
This figure shows a sample DoS Dashboard showing DoS attacks that occurred during the last week. Three of the attacks were critical but all were mitigated within minutes.
You can display DoS Event logs to see whether DDoS attacks have occurred, and view information about the attacks. The logs show details about the DDoS events.
-
On the Main tab, click Visibility > Event Logs.
-
From the DoS menu on the bar at the top, choose an event log to view:
- For DNS DoS event logs, click DNS Protocol.
- For SIP DoS event logs, click SIP Protocol.
- For network firewall DoS event logs, click Network.
- To view event logs if using automatic threshold configuration and you selected Log Auto Threshold Events, click Auto Threshold.
- If using dynamic DoS attack detection, click Dynamic Signatures.
-
Click Last Hour to change the default view to a time period between Last Hour and All Time.
-
Click Custom Search to create a custom table. With the custom search table enabled, you can drag an entry from the current log display it into the search table.