


Updated Date: 07/07/2026
Viewing System-Level Statistics
You can display system level statistics over a period of time in graphical charts on the BIG-IP system. Several charts are available, and they show the following information:
- Internet Protocol (IP) packets, errors, and fragments
- Virtual server traffic details, TCP traffic, and UDP traffic
- CPU usage
- CPU utilization per process
- Memory statistics for TMM, other processes, system RAM, and swap space
- Disk activity, sizes, and latency
You can view the historical statistics for different periods of time. On systems with multiple slots, you can view the statistics for each slot. You can also export the information in any of the reports to PDF or comma-separated value (CSV) format, and save the reports or email them.
Before you can view the system analytics charts described here, you need to provision the Application Visibility and Reporting (AVR) module.
You can view CPU, disk, and memory statistics for the BIG-IP system to help with system troubleshooting.
-
To view CPU statistics, on the Main tab, click Statistics > Analytics> > CPU.
The CPU statistics chart opens showing CPU usage over time.
-
From the View By list, select the item for which to display statistics.
Tip: You can also click Expand Advanced Filters to filter the information that displays.
-
From the Time Period list, select the length of time for which to display statistics.
-
To focus in on the specific details you want more information about, click the chart or an item in the details list.
Tip: This works on any of the Analytics charts.
-
To view memory statistics, on the Main tab, click Statistics > Analytics> > Memory.
The Memory TMM statistics chart opens showing the average total RAM used per slot over a period of time.
-
Click the other items on the menu bar to see additional memory use.
- To see other usage, such as management use, click Other.
- To see operating system usage, click System.
- To see how much swap is being used, click Swap.
-
To view disk statistics, on the Main tab, click Statistics > Analytics> > Disk.
The Disk Activity statistics chart opens showing the average total RAM used per slot over a period of time.
-
Click the other items on the menu bar to see additional disk use statistics.
- To see read or write bytes over time, click Disk Sizes.
- To see read latency, click Disk Latency.
-
If you want to export the information in any of the charts, click Export and specify your options for how and where to send the data.
To send reports by email, the system requires an SMTP configuration.
The statistics provide an overview of CPU, disk, and memory use on the system. As a result, you become more familiar with the system and its resource utilization, and you can troubleshoot the system as needed.
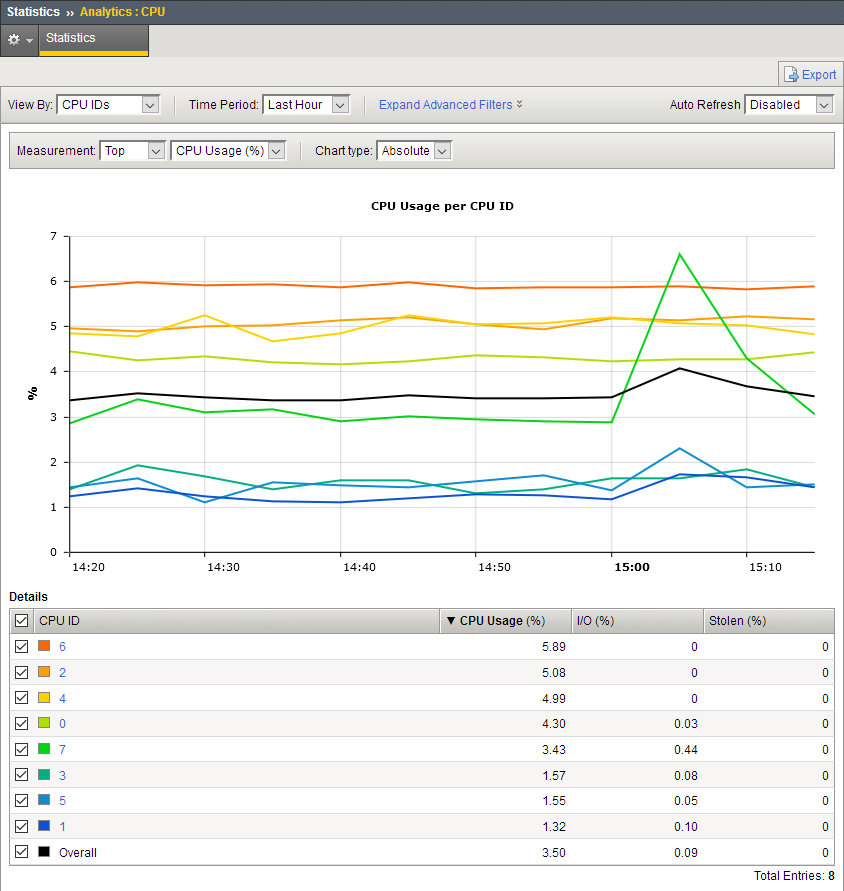
This figure shows a sample CPU statistics report showing the percentage of CPU usage per CPU for the past hour. This BIG-IP system has 9 CPUs, all in use.
This sample chart shows system RAM memory in use for the past week. This system has two slots. In this figure, the average system total RAM was 125.78 GB for both slots.
You can see other memory statistics by selecting TMM, Other, or Swap on the menu bar.
This sample chart shows disk activity for the past hour. It shows that the total I/O activity on the two slots was 14 I/O operations.
Before you can view the system analytics charts described here, you need to provision the Application Visibility and Reporting (AVR) module.
On the BIG-IP system, you can view average CPU usage per process (or per blade on multi-blade systems) to help with system troubleshooting. The system displays CPU usage information for the top 10 processes as a percentage. On multi-blade systems, the chart shows statistics for each blade.
-
To view CPU usage per process, on the Main tab, click Statistics > Analytics > Process CPU Utilization.
The Process CPU Utilization chart opens showing CPU usage per process on the system.
-
From the View By list, select the item for which to display statistics.
You can view the CPU usage details by processes, blade numbers, or process IDs.
Tip: You can also click Expand Advanced Filters to further filter the information that displays.
-
From the Time Period list, select the length of time for which to display statistics.
-
To focus in on the specific details you want more information about, click the chart or an item in the details list.
Tip: This works on any of the Analytics charts.
-
If you want to export the information in any of the charts, click Export and specify your options for how and where to send the data.
To send reports by email, the system requires an SMTP configuration.
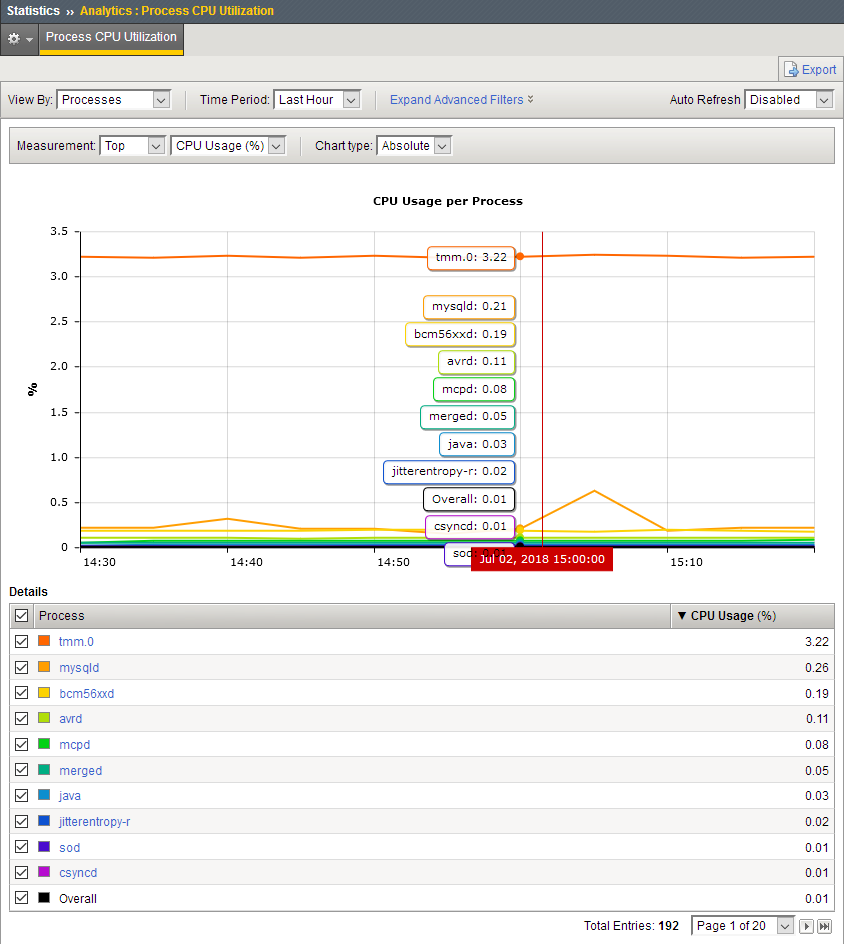
This sample CPU usage report shows the percentage of CPU usage per process for the past day.
Note: The statistics displayed are rounded up to two decimal digits.
The top 10 processes are color-coded and listed in the chart and details table. For example, avrd is the daemon that collects data for AVR, and bd is the main enforcement engine for ASM. The process called tmm.0 is the Traffic Management Microkernel (TMM), a core system process that manages traffic on the BIG-IP system.
Before you can view network analytics charts, you need to provision the Application Visibility and Reporting (AVR) module.
You can view network statistics for the BIG-IP system to help with system troubleshooting and understanding peak load times. Statistics are available at both the Internet Protocol (IP) and virtual server level.
-
To view CPU statistics, on the Main tab, click Statistics > Analytics > IP.
The IP Packets chart opens showing packets transmitted for IPv4 and IPv6 over time.
-
From the Time Period list, select the length of time for which to display statistics.
-
To focus in on the specific details you want more information about, click the chart or an item in the details list.
Tip: This works on any of the Analytics charts.
-
Click the other items on the menu bar to see information about IP errors and fragments.
-
To view virtual server statistics, on the Main tab, click Statistics > Analytics > Virtual Servers.
The Virtual Servers Traffic Details chart opens showing the total client connections per virtual server over a period of time.
-
Click the other items on the menu bar to see packet use or information in bits.
-
To focus in on one virtual server, click it on the chart or in the details list.
-
To view TCP connections, on the Main tab, click Statistics > Analytics > Virtual Servers > TCP.
The TCP connections chart opens showing the average connections per virtual server over a period of time.
-
Click the other items on the menu bar to see additional TCP statistics.
- To see various TCP packets, click Packets and adjust the measurements for different views.
- To see information about SYN Cookies, such as the total received, click SynCookies.
-
To view UDP connections, on the Main tab, click Statistics > Analytics > Virtual Servers > UDP.
The UDP connections chart opens showing the average connections per virtual server over a period of time.
-
Click Datagrams on the menu bar to see additional UDP statistics such as the total datagrams received and the total number of datagrams that were malformed.
-
If you want to export the information in any of the charts, click Export and specify your options for how and where to send the data.
To send reports by email, the system requires an SMTP configuration.
The statistics provide an overview of what is happening on the system network. You can drill down to see specific statistics for different protocols and specific virtual servers.
This sample IP Packets report shows the number of packets received in both IPv4 and IPv6 formats during the past hour.
This sample Virtual Servers report shows the average number of client connections per virtual server. All of the traffic is on nine virtual servers. By placing the cursor over the data, the screen shows details of the number of overall connections, the connections per virtual server, and the time. This way you can monitor peak usage times.