Manual Chapter :
Viewing CGNAT Statistics
Applies To:
Show Versions
BIG-IP LTM
- 21.0.0, 17.5.1, 17.5.0, 17.1.3, 17.1.2, 17.1.1, 17.1.0, 17.0.0, 16.1.6, 16.1.5, 16.1.4, 16.1.3, 16.1.2, 16.1.1, 16.1.0, 16.0.1, 16.0.0, 15.1.10, 15.1.9, 15.1.8, 15.1.7, 15.1.6, 15.1.5, 15.1.4, 15.1.3, 15.1.2, 15.1.1, 15.1.0, 15.0.1
Viewing CGNAT Statistics
Overview: Viewing CGNAT statistics
You can display current and historical carrier-grade network address translation (CGNAT)
statistics in graphical charts on the BIG-IP system. Several charts are
available, and they show the following information:
- Translation endpoints for all active LSN pools
- Logging attempts and failures
- Port block allocation (PBA) translations
- Port Control Protocol (PCP) requests
The CGNAT statistics provide information that is useful for capacity planning, resource
distribution planning, and for investigating potential network problems.
You can view the historical statistics for different periods of time. On systems with multiple
slots, you can view the statistics for each slot. You can also export the information in any of
the reports to PDF or comma-separated value (CSV) format, and save the reports or email them.
Viewing CGNAT statistics
Before you can view the carrier-grade network address translation (CGNAT) statistics
described here, you need to enable CGNAT and provision the Application Visibility and
Reporting (AVR) module.
You can view CGNAT statistics on the BIG-IP system to help with
system planning and troubleshooting.
- On the Main tab, click .The CGNAT translations chart opens showing active translations in a combined view showing statistics for all active LSN pools.
- From theTime Periodlist, select the length of time for which to display statistics.
- To focus in on the specific details you want more information about, point on the chart or click an item in the Details list to view the statistics for that pool.For example, if you see that translation failures have occurred on one of the LSN pools, you can click on that pool in the Details list to display information about the pool.
- You can filter the CGNAT information to display only certain information, such as:
- Active translations
- Translation requests
- Translation failures
- Translation from backup pool
- Click the other items on the menu bar to see additional CGNAT statistics.
- To see logging attempts and failures for LSN pools, clickLogging.
- To see active port blocks, port block allocations, blocks freed, ports where the client reached their limit, and zombie blocks that cannot be released due to active connections, clickPBAand use the filters.
- To see the number of Port Control Protocol (PCP) requests, clickPCP.
- If you want to export the information in any of the charts, clickExportand specify your options for how and where to send the data.To send reports by email, the system requires an SMTP configuration.
The statistics provide information about translation endpoints for active LSN pools,
logging patterns, port block details, and PCP requests. As a result, you can become more
familiar with the system network, and use the information for resource distribution
planning and investigating networking problems.
Sample CGNAT translation statistics
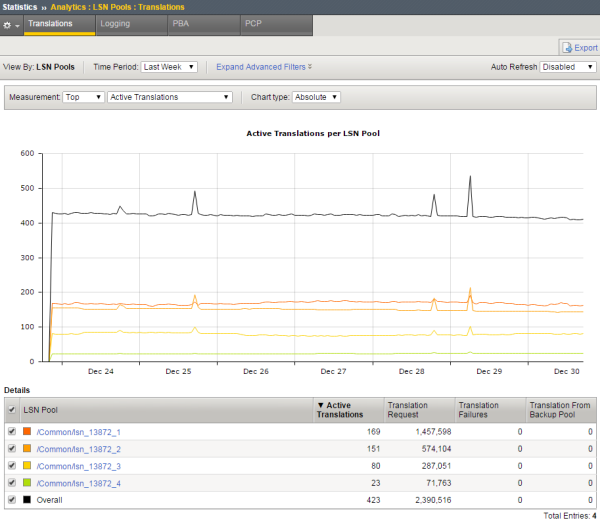
This figure presents a sample CGNAT translation statistics report showing the active
translations for several LSN pools during the past week, and it includes the total number of
active translations.
Sample CGNAT translation statistics

Sample CGNAT logging statistics
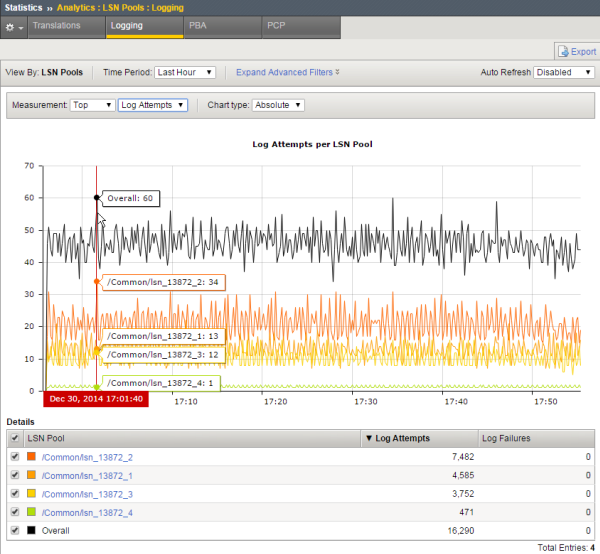
This figure presents a sample CGNAT logging statistics report showing the logging
attempts for several LSN pools during the past hour.
Sample CGNAT logging statistics

Sample CGNAT port block allocation statistics
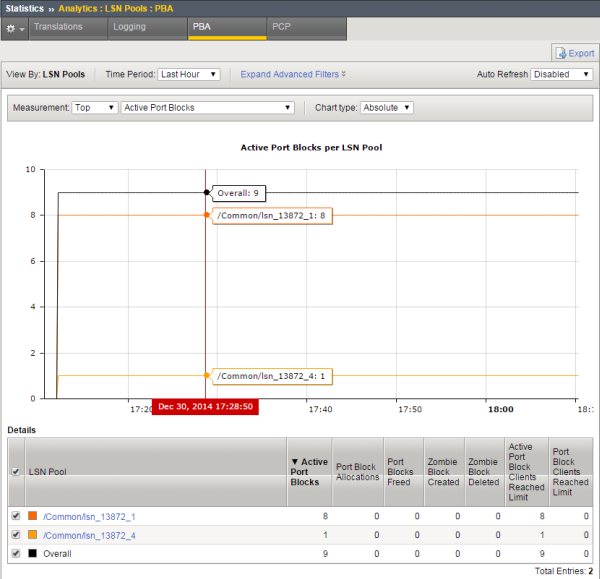
This figure presents a sample CGNAT PBA statistics report showing the active port blocks
for two LSN pools during the past hour.
Sample CGNAT PBA statistics


