Proactive bot defense defends your applications against automated attacks by web robots, or bots. Bot defense helps identify and mitigate attacks before they cause damage to the site, by preventing bots from gaining initial access to a web site. This is a protective measure against layer 7 DoS attacks, web scraping, and brute force attacks. This feature inspects most traffic, but requires fewer resources than traditional web scraping and brute force protections.
You can use bot defense in addition to the brute force protections that are available in Web Application Security (ASM) policies. Bot defense is used to protect your web application against internet bot traffic by configuring a bot defense profile, which allows you to fine-tune mitigation settings based on the client traffic classifications, whitelisted sources, and known OWASP automated threats.
Your bot defense profile defines the security policy applied to bot traffic, once a bot request is detected by the virtual server. Once it detects bot requests, your system will mitigate the traffic according to the policy configured to the corresponding profile. The volume of denied traffic, as opposed to accepted traffic, can indicate a need to adjust your traffic mitigation protocols within your bot defense profile.
For managed BIG-IP devices running version 14.1.x, or later, you can centrally monitor the data for all the bot traffic detected by your bot defense profiles. Use this data to evaluate whether you need to fine-tune your current bot defense configuration on the host BIG-IP device.
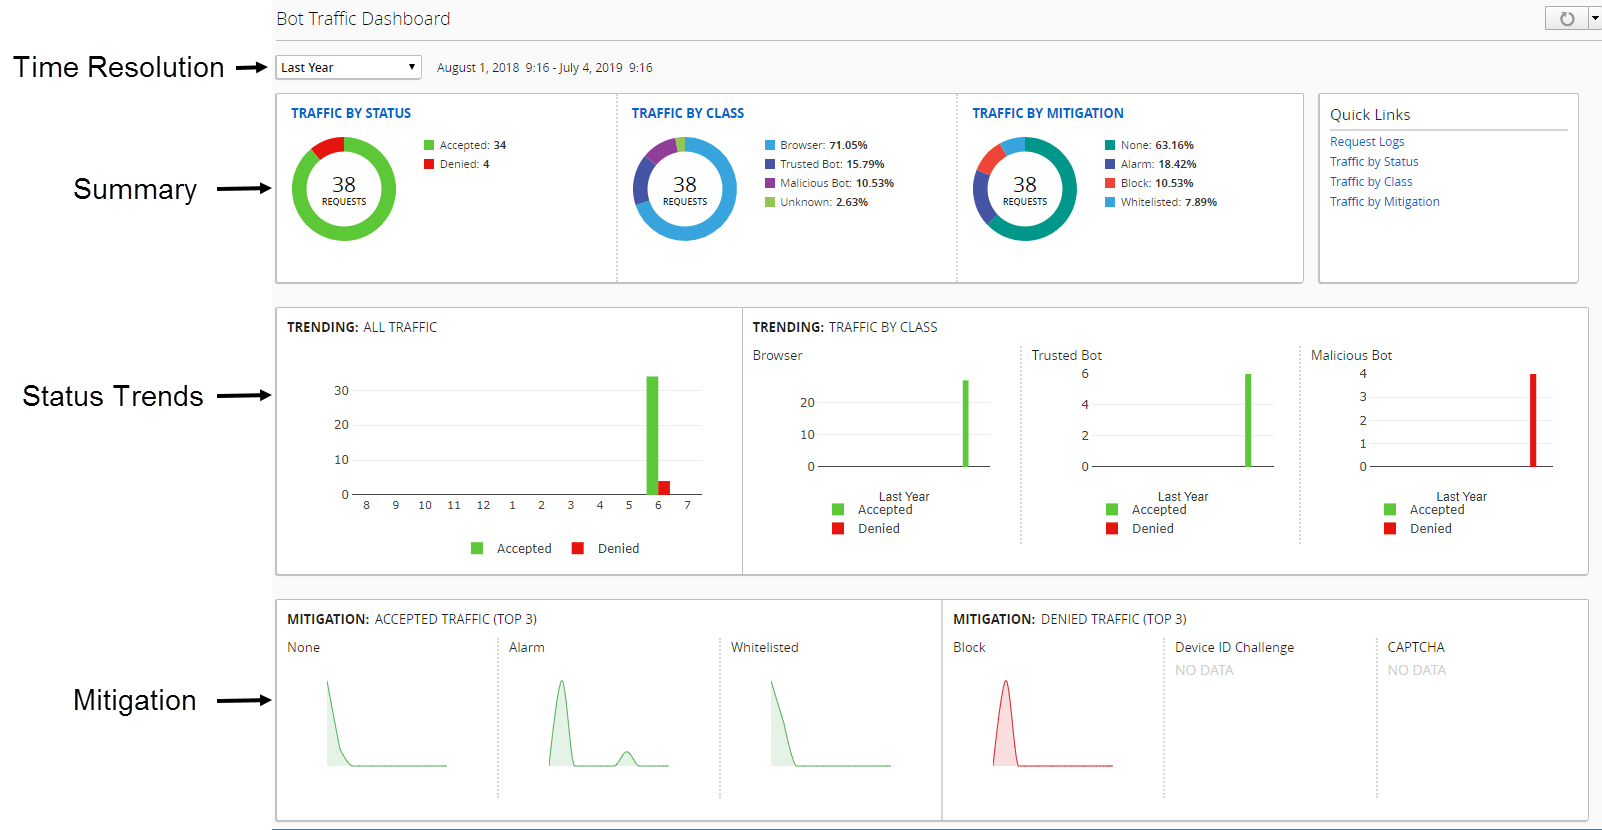
You can evaluate all bot traffic detected by your bot defense profiles using the Bot Traffic Dashboard (Monitoring > DASHBOARDS > Bot Traffic > Bot Traffic Dashboard). This screen provides a summary of how much bot traffic was detected, the most common types of bot requests to your application, and how these requests were managed. You can use the data on this screen to drill down into more granular information about the virtual servers that reported data.
The time setting is a filter where you can select the period of time that is displayed over the entire dashboard. The charts display data reported by virtual servers with a bot defense profile over the selected period of time.
The summary row of charts organizes bot request data by status, class, and mitigation. You can click the title of any of these charts to view a list of the virtual servers reporting bot traffic data.
TRAFFIC BY STATUS displays the distribution of request outcomes compared to the total number of requests. Traffic by status indicates the volume of accepted versus denied traffic.
TRAFFIC BY CLASS displays the distribution of the type of bot requests to your application. Traffic by class can indicate which types of bot traffic are trying to access your application, and whether your bot defense profile requires specific mitigation settings.
TRAFFIC BY MITIGATION displays the distribution of actions taken in response to the bot requests. Traffic by mitigation can indicate which bot defense mitigation settings are most commonly used against detected bot traffic. This can also indicate whether your current enforcement mode is allowing bot traffic to your application, or blocking valid traffic.
The status trends charts display the average trends of bot request outcomes over the selected period of time. The ALL TRAFFIC chart displays the outcome of all requests, while the TRAFFIC BY CLASS charts display the most common bot classes detected, and their request outcomes.
Before you can view bot traffic isolated by virtual server, you must have a bot defense profile running on a BIG-IP device version 14.1 or later. You must also have statistics enabled on the BIG-IP device.
You can view virtual servers reporting unusual or high bot activity to ensure that their bot defense profile is properly configured to manage and mitigate bot traffic.
Go to Monitoring > DASHBOARDS > Bot Traffic > Bot Traffic Dashboard.
The screen displays current summary information about all traffic processed by your bot defense profiles. You can change the time period using the control at the top left of the screen.
Using the charts at the top of the screen, evaluate the total number of requests and the overall distribution of traffic by status, class, or mitigation over the selected period of time.
To find a specific time in which the total bot traffic volume either increased or decreased, view the ALL TRAFFIC chart in the center row of the screen.
To view the most common types of bot traffic and status over time, use the charts under TRAFFIC BY CLASS.
These charts can indicate when your virtual servers detected a specific type of bot requests.
To identify the most common mitigation actions over time, view the MITIGATION charts at the bottom of the screen.
These charts indicate the most common mitigation actions for accepted bot requests and denied bot requests. Accepted mitigation actions, such as Alarm, , indicate an increase in potentially harmful bot traffic that was accepted due to a Transparent enforcement mode on your bot defense profile. An increase in denied mitigation actions can indicate false positives, and might require additional evaluation of traffic class by virtual server.
To display a list of virtual servers and their distribution of data by status, class, or mitigation, click the TRAFFIC BY STATUS, TRAFFIC BY CLASS, or TRAFFIC BY MITIGATION headers.
The screen displays a list of virtual servers that detected bot traffic using a bot defense profile. The summary bar at the top of the screen displays data from all bot requests.
To isolate bot request data from a specific virtual server, click the virtual server’s row.
Data for the selected virtual server is displayed at the bottom of the screen.
Once you have isolated a virtual server, click VIEW REQUEST LOG to review additional details about the bot requests. If you have finished troubleshooting an issue with your virtual server’s bot request management, edit the bot defense profile on the virtual server’s host BIG-IP system.
Before you can log bot requests, you must first have one or more BIG-IP devices that are provisioned to have Bot Defense. In addition, you must have data collection devices (DCD) within your BIG-IQ configuration. You must also activate Web Application Security for your DCD services (System > BIG-IQ DATA COLLECTION DEVICES > SERVICES).
Important: The following procedure is for Bot Defense profiles configured to BIG-IP devices version 14.1 or later. For logging bot request information from earlier versions of BIG-IP, see the Configure for DoS Protection logging.
You can view bot request information by attaching a logging profile to the virtual servers that host your Bot Defense profile. To access Bot Defense information, you need to configure the BIG-IP system to send log information to BIG-IQ. This is done by:
Creating a pool of remote logging servers
Creating a remote high-speed log type to specify that log messages are sent to your pool of DCD
Specifying the BIG-IQ as the remote logging, and Splunk destination
Creating a log publisher and pin it to your BIG-IP device(s)
Creating and attaching a bot request logging profile in Shared Security
Deploying your changes over your BIG-IP device(s)
Create a pool of remote log servers (DCD devices) to which the BIG-IP system can send log messages.
Go to Configuration > LOCAL TRAFFIC > Pools
The screen displays the list of pools.
Click Create.
Type a unique Name for the pool.
For Device, select the BIG-IP device that hosts bot management.
Under Resources, click New Member .
This opens the New Pool Member screen where you can enter the IP address for the DCD self-IP address included in the pool.
For Node Type, select New Node.
Add a Node Name (optional).
In the Address field, type the DCD self-IP address.
In the Port field, type 8514.
This port number is the ASM listener type.
Click Save & Close.
Repeat the new member process until all DCD pool members are added to the list.
Click Save & Close.
Create a Remote High-Speed Log type to specify that log messages are sent to the pool of DCDs that you configured in step 1.
This allows your BIG-IP device to send an unformatted string of text to designated DCDs.
Go to Configuration > LOCAL TRAFFIC > Logs > Log Destinations.
Click Create.
Type a unique Namefor this destination.
From the Type list, select Remote High-Speed Log
From the Protocol list, select TCP.
From the Device list, select the BIG-IP device configured in step 1d.
From the Pool list, select the pool created in step 1.
Click Save & Close.
The Log Destinations screen opens.
From the Log Destinations screen, create a Splunk-type formatted logging destination.
Bot requests are sent in Splunk format.
Click Create.
Type a unique Namefor this destination.
From the Type list, select Splunk.
From the Forward To list, select Remote High Speed and select the logging destination you configured in step 2.
Click Save & Close.
Create a log publisher to specify where the BIG-IP system sends log messages for specific resources.
Go to Configuration > LOCAL TRAFFIC > Logs > Log Publishers.
Click Create.
Under Name type a unique name for this publisher.
In the Log Destination area, move the destination created in step 3 from the Available list to the Selected list.
Pin the new log publisher to your host BIG-IP device
Go to Configuration > LOCAL TRAFFIC > Pinning Policies.
Click the name of the device under the Pinning Policy column.
If you have multiple devices, select the check box next to the names of the BIG-IP devices pinning policy to which you will pin the log publisher, and click Pin to Multiple Policies.
The properties screen opens.
In the center area of the screen, locate the Local Traffic (LTM) field and select Log Publishers from the list.
Select the box next to the name of the log publisher created in step 4 from the list in the bottom half of the screen.
Click Add Selected.
Click Save & Close.
Create a remote logging profile in Shared Security that can support logging of bot requests.
To view bot request logs, you must have configured bot logging. For more information, see Configuring bot defense logging. You also must have a bot defense profile enabled to a BIG-IP device running version 14.1 or later. Ensure that Web Application Security is activated for your DCD services.
You can view a complete list of the bot requests detected by bot defense. This allows you to better identify details of specific requests, or request types, to your applications.
Go to Monitoring > Events > Bot > Bot Requests.
The screen displays a list of all bot requests. Each request in the list displays request parameters detected by your bot defense.
Click a row to display additional details of the selected bot request.
To filter the request log by a specific virtual server, bot class, Bot Defense action (Request Status) you can use the filter bar in the upper right side of the list. To sort requests, click the column header.
Use the Request Details area to identify the logged request’s general information, including the URL, source and destination IP, Host BIG-IP device, and the bot defense profile.
Use the Request Details area to identify general information about detected about the request.
General information includes contents of the request header, the request targets, current status, and mitigation action.
To view the entire request header, see the Request area at the bottom of the screen.
Use the Bot Details area to see why the system identified the request as a bot request.
See Bot classes and Bot Categories for more information about these bot details.
Use the Verification Action and Challenge Status area to view details about why a request received a request status and mitigation action.
You can create new filters to better manage the events in your logs. The filters are based on a fixed set of query parameters, with an option to manually enter all available parameters into a query expression. For more details about the required syntax, see Query expression syntax for log filters.
From the log screen, click the filter icon at the top right of the screen (
).
Click Create.
The New Filter configuration popup screen opens.
Type a unique Filter Name.
In the Query Parameters area, add the query information.
Adding information to these fields automatically populates the Query Expression box. Refer to the Query expression syntax for log filters to view all query options.
Once you have the custom filter the way you want it, click Save & Apply.
The new filter is added to the filter list. You can select this filter later to query the list according to the set parameters.
On the New Filter configuration popup screen, the Query Expression area for creating a new log filter requires specific syntax. To manually run query parameters, use the syntax requirements listed here.
Express elements of the filter query as key value pairs, separated by a colon, such as profile_name:"MyCurrentProfile".
Use the following operators within a filter query.
Operator
Usage Example
AND
This:p1 AND bar:(A AND B AND "another value")
AND NOT
AND NOT qux:error
OR
name:"this is a name" OR bar:(A OR B OR C)
OR NOT
OR NOT qux:error
*
support_id:*123*. This operator can only be used for text fields.
Enclose values that havespaces within quotation marks, such as key:"two words".
Query any field for more than one value by enclosing the values with parentheses, such as key:(a b "two words"). In this case, the default operator is OR.
Only pre-defined values are allowed for fields with a type of multi-value. These values are listed in the Query Parameters area, next to the relevant field.
In a policy name, you must include the full path to the policy, such as /Common/MyPolicy.
Values with a type of date can accept valid date formats, such as 'Oct 30, 2017 00:00:00'.
Values of the date range type can accept input in the format of [min_date...max_date], such as '[Oct 30, 2017 00:00:00...Oct 30, 2017 06:00:00]'. The date range might also contain only minimum without maximum, and the reverse, such as '[Oct 30, 2017 00:00:00...]' or '[...Oct 30, 2017 00:00:00]'.
Values of the numeric range type can accept input in the format of [min...max], such as '[1...100]'. The numeric range might also contain only minimum without maximum, and the reverse, such as '[1...]' or '[...100]'.
The bot defense process classifies client traffic to verify the threat level, and then applies the configured mitigation action. The bot profile classifies clients using browser and mobile app verification tests, bot signatures, and anomaly detection algorithms. Bot signatures and anomalies are grouped into these classes.
Bot Class
Description
Browser
Browser clients that successfully passed browser verification tests
Mobile Application
Mobile app clients with Anti-Bot Mobile SDK, and predefined mobile apps that successfully passed verification.
Trusted Bot
Clients that are detected with search engine signatures.
Untrusted Bot
Clients that are detected with signatures for non-malicious tools and bots, such as crawlers, site monitors, and HTTP libraries.
Suspicious Browser
Browser clients that failed specific browser verification tests.
Malicious Bot
Malicious clients that are detected using bot signatures, browser verification tests, and anomaly detection heuristics. These bots can include DoS tools, exploit tools, and vulnerability scanners.
Unknown
Clients that were not classified by any other class. Typically, these are non-browser clients that cannot be identified using known bot signatures.
This list shows default bot signatures and anomalies that are used to identify bots. They use specific patterns in the headers of the incoming HTTP request. These signatures are categorized in order to classify the bot’s threat against your system, and to perform the most effective mitigation action. The table provides a description of these bot signature categories and their associated bot class.
Requests that match bot criteria undergo evaluation and processing by the bot profile criteria. The request status indicates the outcome of the bot defense evaluation process. This table describes the mitigation action once the request is processed.
This information is based on the configuration of bot defense for the managed BIG-IP device. This is supported by BIG-IP devices running version 14.1, or later.
Mitigation Action
Request Status
Description
None
Accepted
Request was passed by the server with no mitigation action.
Alarmed
Accepted
Request was passed to the server, but triggered an alarm. This could indicate a possible bot threat detected under a transparent bot profile.
Whitelisted
Accepted
Request was passed by the server with no mitigation action.
CAPTCHA
Varies depending on challenge outcome
A CAPTCHA challenge was sent to the client. The request is either accepted or denied, based on the challenge result.
Block
Denied
The request was not passed to the server and a blocking notification was sent.
Device ID Challenge
Denied
Device ID challenge was sent to the client, and the client failed to solve the challenge. The request was not passed to the server.
TCP Reset
Denied
The request was not passed to the server, and the connection was terminated. This occurs when the configured rate limit for an unknown bot class is exceeded, or if this option is configured for the bot class.
Browser Verification Challenge
Denied
Browser verification challenge was sent to the client, and the client failed to solve the challenge. The request was not passed to the server.
Aggregated
Denied
Requests with various mitigation actions. Note: This mitigation is rare and occurs when the system groups multiple denied requests with more than one mitigation action.