Updated Date: 07/07/2026
Monitoring Application Services
You can monitor your applications for health issues and active alerts to mitigate potential impact on the application services. Evaluating application service data provides insights, based on its service type. If you identify an issue with your services you can edit your application service.
For more information about editing application configuration, see Use BIG-IQ to Manage Applications, or Use BIG-IQ to Manage AS3 templates.
For more information about minimum requirements for statistics visibility, see Configuring Statistics Collection.
Local traffic data provides analytics into the latency of the end-to-end HTTP transactions between the client and server. Using HTTP data, you can identify:
-
Trends in application traffic
-
Issues affecting the application’s servers (pool members)
-
Issues affecting virtual servers
-
Client-reported latency
Device data provides analytics into the resource usage and traffic to your BIG-IP environment. Using this data, you can identify:
- Device resource usage and status (CPU, memory, etc.)
- Traffic throughput over time
Web application security data and alerts provide indications of the application service’s protection and the malicious traffic detected by your protection profiles. Using traffic data detected by security policies you can identify:
-
General trends in potential security threats
-
False positives generated by a policy that is actively blocking traffic
-
Attacks that reached your application servers when a policy is in monitoring (transparent) protection
DNS services report the query responses per second (RPS) and the outcomes of DNS traffic. Using data from traffic within your DNS domain you can identify:
-
Trends in DNS traffic
-
Results of DNS load balancing decisions
Note: DNS will always have a health status of Other, and do not represent the health status of the application. You can monitor DNS domain traffic to verify that an application service is performing as expected.
You can use the application health status settings to identify a specific application that has surpassed an application service performance threshold.
Note: Application health is based on HTTP traffic data and BIG-IP resource usage. DNS services are not included in the application’s health status.
-
Open the application summary screen (Applications > APPLICATIONS).
-
Locate the HEALTH area at the top left of the summary bar.
-
Click Critical and Moderate to filter the application list by applications with the selected health statuses.
Note: In the applications list, the Active Alerts field indicates the current number of alerts for an application.
-
Click the application’s name.
The application services are displayed.
-
Identify the application services with moderate or critical health, and click the name to view the summary dashboard for the selected application service.
You can use the ANALYTICS portion of the application service dashboard to evaluate charts that contain traffic data specific to the selected HTTP application service.
This table lists and defines the charts found under the ANALYTICS tab in the application service dashboard (Applications > APPLICATIONS > <Application Name> > <Application HTTP Service>). Select one of the options marked in the image to view charts at the bottom of the screen. These charts display the trends of traffic processed by the BIG-IP system. Each chart displays an aspect of application service traffic as a function of the selected time period. 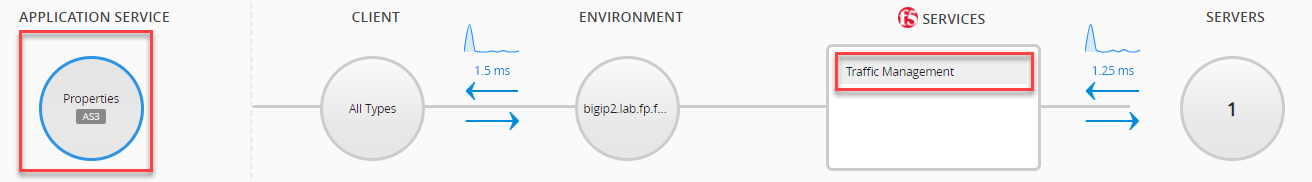
|
ANALYTICS Menu Option |
Chart Title |
Description |
|---|---|---|
|
Transactions |
HTTP Transaction Outcomes |
The average outcome assigned by the BIG-IP system to the request and response exchange between the client, BIG-IP system and server. Metric Unit: Average Transactions per Second Legend: Passthrough: HTTP transactions that completed the request and response exchange using the BIG-IP system. Incomplete: HTTP transactions that did not complete the entire request and response exchange. Cached by BIG-IP: Requests stored by the BIG-IP system to reduce the traffic load on back-end servers. BIG-IP Response: HTTP requests that received a response directly from the BIG-IP. |
|
Concurrent Connections |
Concurrent Connections |
The application’s average number of active connections per second with the BIG-IP system virtual servers, either on the client or server side. Metric Unit: Number of connections Legend: Client Side: The average number of concurrent connections from the client side Server Side: The average number of concurrent connections from the server side. |
|
Application Response Time |
Application Response Time |
The average time it takes for the server to send a response message once the server receives the request from the BIG-IP system. Metric Unit: ms Legend: Min: The lowest server latency observed. Avg: The average server latency observed. Max: The highest server latency observed. |
|
Page Load Time |
Page Load Time |
The average time it takes for a client request to receive a full response from the server and BIG-IP system.Metric Unit: ms Legend: Avg: The average page load time observed. Max: The highest page load time observed. |
|
Server Side RTT |
Server Side Round-Trip Time |
The time it takes for the BIG-IP system to send a request and receive a response from the server, not including the application response time. This is a system performance indicator.Metric Unit: ms Legend: Min: The lowest server RTT observed. Avg: The average server RTT observed. Max: The highest server RTT observed. |
|
Client Side RTT |
Client Side Round-Trip Time |
The time it takes for a client to send a request and receive a response over the BIG-IP system. This includes the time it takes for client’s request to reach the BIG-IP system and the time it takes for the client to receive a response from the BIG-IP system. Metric Unit: ms Legend: Min: The lowest server RTT observed. Avg: The average server RTT observed. Max: The highest server RTT observed. |
|
Response Codes |
Transaction Response Code Families |
The average server HTTP status code grouping responses received per second. Metric Unit: Average Transactions per Second Legend: 2XX: Server successfully connected and responded to the request. 3XX: Connection was refreshed or updated on the client’s side after sending a request. 4XX: Client-side error that does not allow the server to complete the request. 5XX: Server-side error that does not allow the server to complete the request. NA: Incomplete transaction. |
|
E2E Time |
End-to-End-Time |
The time required for an application request and response transaction, not including system latency and transmission times.Metric Unit: ms Legend: Client RTT: The average time it takes for a client to send a request and receive a response over the BIG-IP system. Server RTT: The average time it takes for a client to send a request and receive a response over the BIG-IP system. Application Response Time: The average time it takes for a server to send a response, after receiving a request. |
This table describes the menu options and charts found in the application service dashboard (Applications > APPLICATIONS > <Application Name> > <Application HTTP Service). Select the option marked in the image to view charts at the bottom of the screen. These charts display the trends of the host BIG-IP device, or service scaling group. Each chart displays an aspect of the devices as a function of the selected time period.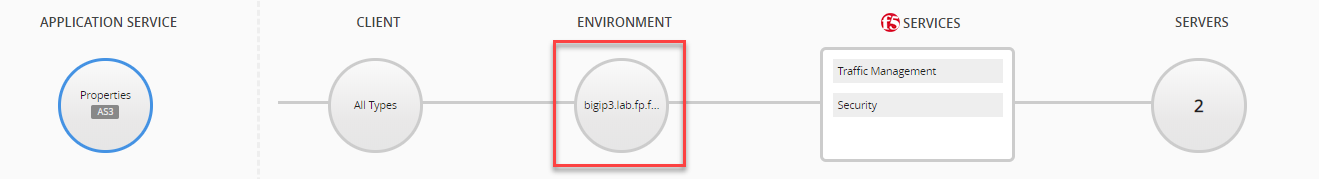
|
ANALYTICS Menu Option |
Chart Title |
Description |
|---|---|---|
|
CPU Usage |
CPU Usage (percent) |
The percentage of CPU usage based on overall and specific activities of the BIG-IP system devices.Metric Unit: Percent Legend: User: The average percentage of CPU usage for the all the BIG-IP user space programs over a given time period. System: The average percentage of CPU usage for all the running BIG-IP systems over a given time period I/O Wait: The percentage of time (during the selected time period) that a given CPU is idle for an I/O wait operation. This occurs when at least one outstanding I/O disk operation is requested by a task scheduled on system CPU. Stolen: The percentage of time a virtual CPU waits for real CPU when the hypervisor is servicing another virtual machine. |
|
Top Cores |
Top 6 CPU Cores |
The six, most active CPU cores for all monitored BIG-IP devices. Metric Unit: Percent Legend: CPU core |
|
Memory |
Memory Usage (percent) |
The percentage of RAM used by system processes of the monitored BIG-IP devices. Metric Unit: Percent Legend: TMM: The average percentage of RAM used by device TMM processes. Total: The average percentage of RAM used by all devices Other: The average percentage of used RAM from non-TMM processes. |
|
Throughput |
Throughput Bytes (average/s) |
The average rate of traffic (in bytes) processed by the BIG-IP device interfaces.Metric Unit: Average/s Legend: In: The average rate of incoming traffic to the BIG-IP devices. Out: The average rate of outgoing traffic from the BIG-IP devices. |
|
Connections |
Concurrent Connections (count) |
The average number of connections that are open at the same time, on either the client-side or the server-side.Metric Unit: Count Legend: Client Side: The average number of concurrent connections at the client side. Server Side: The average number of concurrent connections at the server side. |
|
HTTP |
HTTP Transactions (average/sec) |
The transaction includes all HTTP request and response messages passed between the client, BIG-IP system, and server.Metric Unit: Average/s Legend: Transactions: Average number of HTTP transactions per second that were processed by the BIG-IP devices. |
|
Dropped |
Throughput Drops (average/sec) |
The average rate of packets per second (pps) that were dropped by the BIG-IP device interfaces or discarded by the TMM over the course of the transaction.Metric Unit: Average/s Legend: In: The average rate of packets per second that were dropped by the BIG-IP interface. Out: The average rate of packets per second that were accepted by the BIG-IP interface, but discarded by the TMM. |
|
Errors |
Throughput Errors (average/sec) |
The average rate packets per second (pps) that were corrupted or arrived incomplete over the course of the transaction across the network,Metric Unit: Average/s Legend: In: The average packets per second received as throughput error. Out: The average packets per second transmitted out at throughput error. |
This table lists and defines the charts found under the ANALYTICS tab in the application service dashboard (Applications > APPLICATIONS > <Application Name> > <Application HTTP Service>). Select the option marked in the image to view charts at the bottom of the screen. These charts display the trends of application traffic processed by the BIG-IP system. Each chart displays an aspect of application traffic as a function of the selected time period.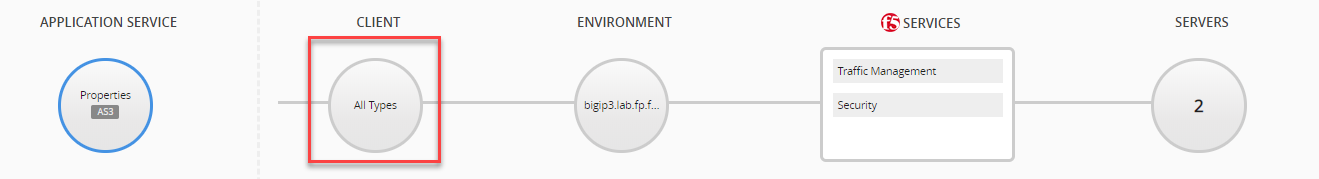
|
ANALYTICS Menu Options |
Chart Title |
Description |
|---|---|---|
|
Transactions |
HTTP Transaction Outcomes |
The average outcome assigned by the BIG-IP system to the request and response between the client, BIG-IP system and server.Metric Unit: Average Transactions per Second Legend: Passthrough: HTTP transactions that completed the request and response exchange using the BIG-IP system. Incomplete: HTTP transactions that did not complete the entire request and response exchange. Cached by BIG-IP: Requests stored by the BIG-IP system to reduce the traffic load on back-end servers. BIG-IP Response: HTTP requests that received a response directly from the BIG-IP. |
|
Page Load Time |
Page Load Time |
The average time it takes for a client request to receive a full response from the server and BIG-IP system.Metric Unit: ms Legend: Avg: The average page load time observed. Max: The highest page load time observed. |
|
Client Side RTT |
Client Side Round-Trip Time |
The time it takes for a client to send a request and receive a response over the BIG-IP system. This includes the time it takes for client’s request to reach the BIG-IP system and the time it takes for the client to receive a response from the BIG-IP system. Metric Unit: ms Legend: Min:The lowest server RTT observed. Avg: The average server RTT observed. Max: The highest server RTT observed. |
|
E2E Time |
End-to-End-Time |
The time required for an application request and response transaction, not including system latency and transmission times.Metric Unit: ms Legend: Client RTT: The average time it takes for a client to send a request and receive a response over the BIG-IP system. Server RTT: The average time it takes for a client to send a request and receive a response over the BIG-IP system. Application Response Time: The average time it takes for a server to send a response, after receiving a request. |
This table lists and defines the charts found under the ANALYTICS tab in the application service dashboard (Applications > APPLICATIONS > <Application Name> > <Application HTTP Service>). Select the option marked in the image to view charts at the bottom of the screen. These charts display the trends of the application service’s traffic processed by a Web Application Security policy. Each chart displays an aspect of traffic as a function of the selected time period.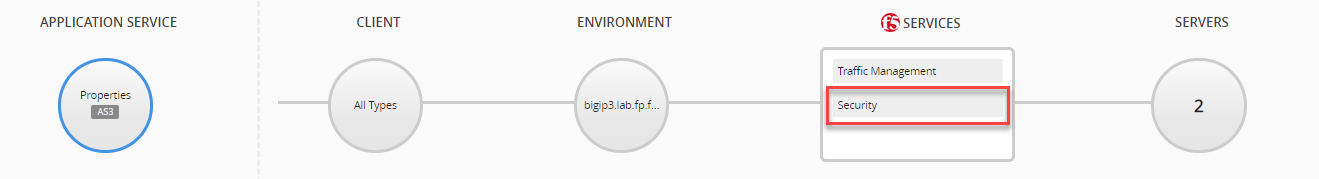
|
ANALYTICS Menu Option |
Chart Title |
Description |
|---|---|---|
|
Illegal Transactions |
Blocked and Non-Blocked Illegal Transactions Rate |
The average transaction security outcome assigned by the Web Application Security policy.Metric Unit: Average Transactions per Second Legend: Blocked TPS: The number of transactions that were blocked by the Web Application Security policy and did not pass through the system. Non-Blocked TPS: The number of transactions that passed through the Web Application Security policy. |
|
All Transactions |
Transactions Rate by Violation Rating |
The average Web Application Security policy outcome, based on the violation rating (threat level) for the application’s transactions.Metric Unit: Average Transactions per Second Legend: Legal: Transactions that are considered legal. Violation rating is 0. Likely F.P. : Transactions that are not legal, based on the security policy, but are likely false positives. Violation rating is 1 or 2. Illegal: Transactions that are considered illegal. Violation rating is 3. Malicious: Transactions that are considered malicious attacks. Violation rating is 4 or 5. |
|
Violations |
Top 6 Violations |
The number of violations per second for the most common violation types monitored by Web Application Security policy. Metric Unit: Violation per second Legend: Up to 6 violation types |
Application health alerts are based on traffic data, or surpassed thresholds, reported by application services. Active alerts reflect an application service performance issue. A critical or warning alert that is active indicates that there has been a sustained threshold violation for over five minutes.
A metric threshold violation must be sustained for 5 minutes to trigger an alert. A subsequent alert is triggered once another threshold is crossed (either an increase or decrease in severity, or cleared). To ensure that conditions are improving, an alert for declining severity (critical to warning) or a cleared alert, is triggered only when the value is sustained for five minutes at ten percent below the threshold value. For example, if a threshold value is configured for greater than 60 percent, a declining severity must be sustained at 54 percent or less to trigger an alert.
If the performance indicator or threshold does not reflect your application service’s performance, you can customize the alert rule settings. (Click the health icon at the top left of the application screen.) The application health is defined in the application template.
You can use the application health status settings to identify a specific application that has surpassed an application service performance threshold.
Note: Application health is based on HTTP traffic data and BIG-IP resource usage. DNS services are not included in the application’s health status.
-
Open the application summary screen (Applications > APPLICATIONS).
-
Locate the HEALTH area at the top left of the summary bar.
-
Click Critical and Moderate to filter the application list by applications with the selected health statuses.
Note: In the applications list, the Active Alerts field indicates the current number of alerts for an application.
-
Click the application’s name.
The application services are displayed.
-
Identify the application services with moderate or critical health, and click the name to view the summary dashboard for the selected application service.
You can use the ANALYTICS portion of the application service dashboard to evaluate charts that contain traffic data specific to the selected HTTP application service.
You can use the application alerts from the single application screen to identify when a performance issue began. You can then use the application’s transaction to evaluate how the issue is currently affecting your application’s health.
-
Open the application properties screen by selecting the application’s name from the Applications screen ( click Applications > APPLICATIONS > <Application Name> > <Application HTTP Service>).
-
To view the application’s most severe, active alerts, view the Active Alerts area at the far right of the summary bar.
-
Click See All to view the application’s Active Alert screen.
This displays a log of all alerts that have crossed a defined threshold.
-
Click the row for the most recent health alert, and view the alert details on the lower part of the screen.
- The Description field displays the affected performance indicator.
- The Value field displays the value when the alert was triggered
- The Log Level filed indicate the alert’s severity.
-
Return to the single application screen by clicking the back arrow next to Active Alerts screen title.
From the application screen, you can use the alert information to analyze and isolate if the issue is related to one or more pool members.
Application service alerts notify regarding changes in application service metrics that can affect the overall performance of traffic or security management. You can view alerts from the single application service screen (Applications > APPLICATIONS > <Application Name> > <Application HTTP Service>), or the alerts screens (Applications > ALERT MANAGEMENT > Active Alerts or Alert History).
|
Alert |
Description |
Indication |
Default Thresholds |
Action (if applicable) |
|---|---|---|---|---|
|
|
The average time from when the server receives the request from the BIG-IP system until the server sends the response. This is usually a result of pool member activity. |
An application’s pool member exceeded the defined application response time. |
Critical > 500msWarning > 100ms Cleared < 100ms |
Investigate pool member activity. |
|
|
The average round trip time (RTT) for network communication between the BIG-IP system and the application server. |
An application’s pool member exceeded the defined server side RTT. |
Critical > 50msWarning > 10ms Cleared < 10ms |
Investigate issues with BIG-IP device performance. |
|
|
The average round trip time (RTT) for network communication between the BIG-IP system and the client application request. |
The average network response to a client request exceeded the defined client side RTT. |
Critical > 1500msWarning > 750ms Cleared < 750ms |
Investigate issues with BIG-IP device performance. |
|
|
The average rate of transactions that did not complete the request and response exchange, out of the overall transactions. |
The average number of incomplete transactions exceeded the defined rate. |
Critical > 0.05%Warning > 0.01% Cleared < 0.01% |
Troubleshoot using the Transaction Outcomes data for the affected application. |
|
|
The average rate of transactions that returned a server error response code (5XX) out of all the overall transactions. |
The rate of requests receiving 5XX response codes exceeded the defined rate. |
Critical > 0.05%Warning > 0.01% Cleared < 0.01% |
Investigate pool member activity and adjust pool configurations as necessary. |
|
|
The average rate of transactions that returned a request error response code (4XX) out of all the overall transactions. |
The rate of requests receiving 4XX response codes exceeded the defined rate. |
Critical > 0.05%Warning > 0.01% Cleared < 0.01% |
Troubleshoot Client IP addresses with request errors using Enhanced Analytics. |
|
|
The number of transactions per second (TPS) is higher than the expected average. |
The rate of application activity is higher that expected. |
No default | |
|
|
The number of transactions per second (TPS) is lower than the expected average. |
The rate of application activity is lower than expected. |
No default | |
|
|
The number of times Network Access session reconnects in the last 60 minutes. |
Reconnects are higher than expected. |
Critical > 750Warning > 500 Cleared < 500 |
Check the Network Access Reconnect Detail monitoring screen (Monitoring > DASHBOARDS > Remote Access > Network Access > Network Access Reconnect Detail). |
|
|
The number of errors in Network Access session processing in the last 60 minutes. |
Errors are higher than expected, which could indicate a misconfiguration in Network Access. |
Critical > 1000Warning > 500 Cleared < 500 |
Check the Network Access Errors monitoring screen (Monitoring > DASHBOARDS > Access > Remote Access > Network Access > Network Access Errors). |
|
|
The number of Bad IP Reputation IP addresses identified in the last 60 minutes. |
Excessive bad IP addresses are attempting access. |
Critical > 1000Warning > 500 Cleared < 500 |
Check the Bad IP Reputation monitoring screen (Monitoring > DASHBOARDS > Access > Sessions > Bad IP Reputation). |
|
|
The number of denied access sessions in the last 60 minutes. |
Denied Access sessions are higher than expected. |
Critical > 100Warning > 50 Cleared < 50 |
Check the Sessions Denied monitoring screen (Monitoring > DASHBOARDS > Access > Sessions > Denied). |
|
|
The number of SAML IdP errors in the last 60 minutes. |
Errors in SAML IdP processing are higher than expected. |
Critical > 200Warning > 100 Cleared < 100 |
Check the SAML IdP Error Report monitoring screen (Monitoring > DASHBOARDS > Access > Federation > SAML > IdP > Error Report). |
|
|
The number of SAML SP errors in the last 60 minutes. |
Errors in SAML SP processing are higher than expected. |
Critical > 200Warning > 100 Cleared < 100 |
Check the SAML SP Error Report monitoring screen (Monitoring > DASHBOARDS > Access > Federation > SAML > SP > Error Report). |
|
|
The percentage of Access licenses in use over the last 5 minutes. |
Check Access licenses. |
Critical > 85Warning > 70 Cleared < 70 |
Check the Network Access Usage monitoring screen (Monitoring > DASHBOARDS > Access > Remote Access > Network Access > Network Access Usage). |
|
|
The percentage of Connectivity licenses in use over the last 5 minutes. |
Check Connectivity licenses. |
Critical > 85Warning > 70 Cleared < 70 |
Check the License Usage monitoring screen (Monitoring > DASHBOARDS > Sessions > License Usage) |
|
|
The percentage of SWG licenses in use over the last 5 minutes. |
Check SWG licenses. |
Critical > 85Warning > 70 Cleared < 85 |
Check the Bad IP Reputation monitoring screen (Monitoring > DASHBOARDS > Access > Secure Web Gateway > Users). |
The health of your application service is determined by metric thresholds that monitor your application’s traffic processing capabilities. Each metric provides information about latency of your application’s pool members, latency of the BIG-IP system, total number of connections, and transaction outcomes. These metrics and corresponding thresholds use a default application health alert rule set. You can modify the default rule set for all applications, or add a new alert rule for a single application.
Tip: You can view and edit a single application service’s health rules by clicking the health icon located at the far left of the single application service’s summary bar.
You can monitor your applications service’s health status based on the status of its connected objects and traffic performance metrics. The health alerts rules for your application can be adjusted based on your monitoring needs.
-
Go to the Alert Management screen Applications > ALERT MANAGEMENT > Alert Rules.
-
Click the alert rule name.
This opens the alert rule’s properties screen.
-
View the Metric Conditions area at the center of the screen, which displays the current metrics and thresholds for the default application alerts rule.
By default, all the metrics are enabled.
Note: BIG-IP devices earlier than version 13.1.0.5 do not collect data that supports metric alerts. Applications that are managed by earlier versions of a BIG-IP device do not receive metric alerts.
-
To disable metrics, clear the check box to the right of the metric column.
This stops any device alerts for this metric.
-
To adjust the Warning and Critical threshold values for enabled metrics, specify a different value for the metric in the appropriate fields.
-
In the Events area, you can enable or disable status alerts for application objects.
-
Use the Actions area to enable alert notifications by SNMP and Email.
-
Click Save at the bottom of the screen, or click Save & Close to save and return to the Alert Rules screen.
The health and metric rules trigger new alerts according to the saved modifications. This clears active alerts associated with this rule set, and triggers an Alert Rule Changes alert.
When you configure an application service to the BIG-IQ, the application and its services are monitored by a default health alert rule set. You can create a new health alert rule set to customize the alert notifications for a specific application service.
-
Go to the Alert Management screen Applications > ALERT MANAGEMENT > Alert Rules.
-
At the top left of the screen, click the Add button.
The New Alert Rule screen opens.
-
Type aName and an optional Description.
-
Select the Rule Type (Device Health or Device Access-health).
-
In the Metric Conditions area, enable and disable metrics as needed by selecting or clearing the box to the right of the Metric column.
Note: BIG-IP devices earlier than version 13.1.0.5 do not collect data that supports metric alerts. Applications that are managed by earlier versions of a BIG-IP device do not receive metric alerts.
-
Use the Actions area to enable alert notifications by SNMP and Email.
-
Use the Devices area at the bottom of the screen to view the available devices for the new alert rule set, and move a device from the Available list to the Selected list.
You can filter the device lists by selecting from the Filter list.
-
Click Save at the bottom of the screen, or click Save & Close to save and return to the Alert Rules screen.
The health and metric rules trigger new alerts according to the saved modifications. This clears active alerts for the associated application, which triggers the Alert Rule Changes alert.
The device health alerts notify you of changes in your application traffic that impact the health of the application. When there is a threshold violation for application traffic thresholds, the application health status changes. You can view application alerts from the single application screen (Applications > APPLICATIONS > <Application Name>), or the alerts screens (Applications > ALERT MANAGEMENT > Active Alerts or Alert History).
| Alert | Description | Indication | Default Thresholds | Action (if applicable) |
|---|---|---|---|---|
Application Health |
One or more of the application service’s health performance metrics has changed. | One or more of the enabled application service’s traffic metrics exceeded a defined threshold, which might impact the application service’s overall performance. | Applies the default-active-application- health rules. | Investigate the application’s active alerts for traffic metrics. |
An application’s performance issues might be caused by changes in a pool member’s status. Issues with a pool member can lead to increases in application response time, server-side round trip time (RTT), incomplete transactions, and server errors. An application that sustains these increases can result in a critical or moderate health status. You can use application alerts to isolate managed objects, such as pool members, or virtual servers that reported issues. You can use your findings to adjust your application’s managed objects (LTM pool members) in order to improve performance.
You identify an application with changes in pool member status by using the application health status screen (Applications > APPLICATONS). Once an application is identified (Applications > APPLICATONS > <Application Name>), you can identify which pool member(s) is affecting performance.
You can isolate pool members that are causing performance issues to mitigate the performance impact on your application service.
-
Open the application properties screen by selecting the application’s name from the Applications screen ( click Applications > APPLICATIONS > <Application Name> > <Application HTTP Service>).
-
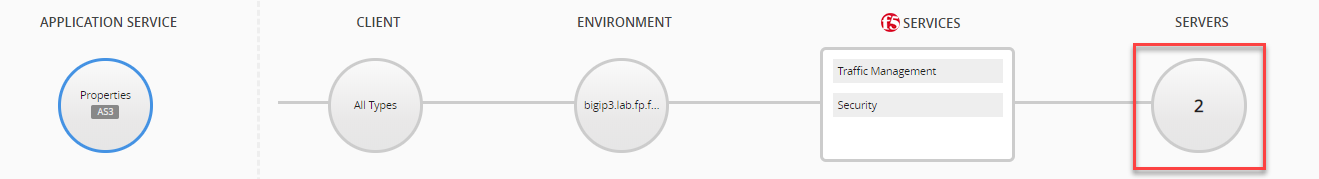
Near the middle of the screen in the SERVERS area, click the numbered icon below to display pool member information in the ANALYTICS area.
-
To view pool member traffic data, select from menu to the left of the screen in the ANALYTICS area (Server Latency, Application Response Time, or Server Side RTT).
-
In the time settings above the chart, ensure that the Events button is set to ON.
-
You can click the Category buttons below the chart such that only the System button is active.
Note: The buttons below the chart have a gray background when disabled, and a blue background, when enabled.
This action filters out all other alert and event categories displayed in the charts.
-
Click an event icon in the chart to display the events and alerts that correspond with the traffic data.
This displays the event table below the chart, which includes details about the events and alerts that occurred at that time.
Tip: You can further filter so that only pool member and virtual server events appear, use the Search events field, and type “server-readiness”.
-
Isolate the affected pool member address from the Title column in the event table, or click the event row to view event details in the Description area.
-
You can analyze additional data for the isolated pool member by expanding the Dimension pane to the right of the chart and selecting the pool member address from the Pool Members Address list.
This table lists and defines the charts found under the ANALYTICS tab in the application service dashboard (Applications > APPLICATIONS > <Application Name> > <Application HTTP Service>). Select the option marked in the image to view charts at the bottom of the screen. These charts display the trends of the application pool members. Each chart displays an aspect of pool member performance, as function of the selected time period.
|
ANALYTICS Menu Options |
Chart Title |
Description |
|---|---|---|
|
Server Latency |
Top 5 Pool Members by Server Latency |
The average number of milliseconds (ms) it took for the BIG-IP system to receive a response message from a pool member once a request was sent. This includes application response time and server RTT.Metric Unit: ms Legend: Top 5 pool member IP addresses |
|
Application Response Time |
Top 5 Pool Members by Application Response Time |
The average time it takes for the pool member to send a response message once the pool member receives the request from the BIG-IP system. Metric Unit: ms Legend: Top 5 pool member IP addresses |
|
Server Side RTT |
Top 5 Pool Members by Server Side Round-Trip Time |
The time it takes for the BIG-IP system to send a request and receive a response from the pool member, not including the application response time. This is a system performance indicator.Metric Unit: ms Legend: Pool member addresses |
|
TPS |
Top 5 Pool Members by TPS |
The average number of request transactions per second (TPS) received by a pool member. Metric Unit: TPS Legend: Pool member addresses |
Pool member events and alerts indicate the status of a pool member. You can see these events and alerts in the charts of the application properties screen (Applications > APPLICATIONS > <Application Name> > <Application HTTP Service>) and in the Local Traffic dashboards (Monitoring > DASHBOARDS > Local Traffic). You can also view alerts in the Active Alerts and Alert History screens (Applications > ALERT MANAGEMENT).
|
Alert |
Description |
Indication |
Default Thresholds |
Action (if applicable) |
|---|---|---|---|---|
|
|
The pool member (server) is offline as a result of status or configuration changes. The system then updates the pool member status with one of the following messages:
|
Pool member issues can lead to increases in application response time, server-side round trip time (RTT), incomplete transactions, and server errors. |
Critical: Offline |
Prolonged impact on application performance might require the addition of a new pool member. |
|
|
The pool member response to the server. |
Critical: All pool members in a pool are unresponsive Moderate: At least one, but not all, members in a pool are unresponsive Cleared: All pool members are back online, or the virtual server was deleted. |
Virtual Server events and indicate the status of the virtual server and its pool. You can see these events and alerts in the charts of the application properties screen ( Applications > APPLICATIONS > <Application Name> > <Application HTTP Service>) and in the Local Traffic dashboards ( Monitoring > DASHBOARDS > Local Traffic). You can also view alerts in the Active Alerts and Alert History screens (Applications > ALERT MANAGEMENT).
|
Alert |
Description |
Default Thresholds |
Action (if applicable) |
|---|---|---|---|
|
|
The virtual server is offline as a result of status or configuration changes. The system then updates the virtual server status with one of the following messages:
Note: The virtual server monitor is configured on the BIG-IP system.
|
Critical: Offline |
Prolonged issues that impact application pool member performance require either virtual server mitigation, or pool member configuration mitigation. |
|
|
The pool response to the virtual server, based on the pool member status. |
Critical: All pool members in a pool are unresponsive Moderate: At least one, but not all, members in a pool are unresponsive Cleared: All pool members are back online, or the virtual server was deleted. |
To manage LTM objects to mitigate a performance issue that you isolated using analytics, you use essentially the same screens that you used to find the problem. But instead of using the ANALYTICS option in the details area, you use the CONFIGURATION option.
The workflow for resolving the issue is essentially the same, regardless of what kind of object is triggering the issue.
- Create a replacement for the object triggering the issue.
- Delete or remove the object from service.
In these tasks, we provide an example of a problem pool member. But you can use essentially the same strategy for other LTM object types in your application.
When you isolate a pool member that is affecting traffic performance, you can create a replacement for the member that is triggering the performance issues.
-
Select the application that needs attention from the all applications screen (Applications > APPLICATIONS > Application Name).
-
Find the pool member that needs attention: At the right, center of the screen, click the number in the Servers circle.
This displays the pool member information in the CONFIGURATION area.
-
Create a new pool member.
-
At the left click CONFIGURATION.
-
Under Servers, click Create (a Create Servers popup screen opens).
-
Type the IP Address and Port for the new pool member.
-
Click Create. (This creates the pool member and closes the popup screen.)
-
The next thing you probably want to do is take this pool member out of service so that your application traffic can return to normal.
Before you start, you probably want to create a replacement pool member to handle the traffic of the problem member.
When you isolate a pool member that is affecting traffic performance, you have a couple of ways to remedy the issue. Depending on what kind of issues the pool member is experiencing, you might want to delete it immediately, disable it, or force it offline.
-
Select the application that needs attention from the all applications screen (Applications > APPLICATIONS > Application Name).
-
Find the pool member that needs attention: At the right, center of the screen, click the number in the Servers circle.
This displays the pool member information in the CONFIGURATION area.
-
Select the pool member that needs attention:
-
Click CONFIGURATION.
-
Select the check box for the pool member.
-
-
Determine what you want to do with this pool member based on the nature of the performance issue, and take the most appropriate action.
|
What do you want the member to do? |
Select this option |
|---|---|
|
Cease all traffic immediately |
Select Delete.BIG-IQ removes the pool member from the pool, but does not delete the associated node. This option is most appropriate when an issue requires a quick response. Current connections will be interrupted. |
|
Stop processing new connections but continue to process persistent or active connections. |
Select Disable.BIG-IQ continues to process persistent and active connections for this member. New connections are accepted only if they belong to an existing persistence session. This option is appropriate when you can afford the time for traffic to dissipate before the member stops processing traffic. |
|
Stop processing new connections but continue to process active connections. |
Select Force Offline.BIG-IQ continues to process active connections for this member. New connections are accepted only if they belong to an existing persistence session. This option is appropriate when you can afford the time for traffic to dissipate before the member stops processing traffic. |
The next thing you probably want to do is repeat the troubleshooting steps you used to isolate this pool member as the problem source and confirm that the issue is resolved.
You can use the Analytics area of the Application screen to collect additional data about application traffic data. This prompts the system to collect additional metrics about your application’s performance, which enhances your troubleshooting capabilities.
Tip: You can enable Enhanced Analytics on multiple applications at once to the enhanced data objects in the HTTP dashboard (click Monitoring > DASHBOARDS > Local Traffic > HTTP).
-
Open the application properties screen by selecting the application’s name from the Applications screen ( click Applications > APPLICATIONS > <Application Name> > <Application HTTP Service>).
-
Click the Enhanced Analytics button to Enhanced Analytics Settings popup screen.
Note: By default, all HTTP metrics (check boxes) are enabled (selected). Selecting only one, or a focused number of metrics, improves the quality of the data collected.
-
Ensure that the Collect HTTP metrics for <Application Name> check box is selected.
-
Leave selected only the check boxes you want, to view specific data within the chart dimensions of the Analytics area.
-
To view details about your application’s security, select Collect Security metrics for all devices hosting <Application Name>.
-
Click Start.
The detail screen for this application displays a banner across the top of the screen, Enhanced Analytics On, with a Stop button. If you return to the Applications screen, the health icon in the applications list is highlighted to indicate which application is running Enhanced Analytics.
-
To disable Enhanced Analytics, click the Stop button in the Enhanced Analytics On banner.
Tip: You can also click Enhanced Analytics, and click Stop in the Enhanced Analytics Settings popup window.
Important: Once you have completed troubleshooting, disable Enhanced Analytics to reduce disk usage allocated for statistics data collection.
When Enhanced Analytics mode is off, dimension statistics persist in the dimension object list, when viewing a time period from when Enhanced Analytics was enabled.
This table lists and describes HTTP options in the Enhanced Analytics Settings popup screen displays additional metric data for the corresponding dimensions, when enabled. The added data is displayed in the HTTP traffic charts. When disabled, these dimensions display aggregated data.
|
Enhanced Metric Setting |
Affected Dimension(s) |
Description |
Value displayed when disabled |
|---|---|---|---|
|
IP Address |
Client IPs |
The IP addresses from which your application receives requests. Suggested Uses: General application performance testing. |
N/A |
|
Geolocation |
Countries |
The countries from which your application receives requests.Suggested Uses: General application performance testing, identifying user personas, security validation. |
N/A |
|
Operating System & Browser |
OSs Browsers |
The operating systems and browsers from which your application receives requests.Suggested Uses: General application performance testing, testing performance of URLs with high resource requirements. |
N/A |
|
HTTP Method |
Methods |
The HTTP request methods to your application’s resources.Suggested Uses: General application performance testing, identifying user personas. |
N/A |
|
Subnet |
Subnets |
The client subnets from which your application receives requests.Suggested Uses: General application performance testing. |
N/A |
|
URL |
URLs |
The URLs from which your application receives requests.Suggested Uses: General application performance testing, testing performance of URLs with high resource requirements. |
N/A |
When you are troubleshooting the security status of an application, additional data can help you isolate details that characterize potential, or ongoing, vulnerabilities. On the Application screen, the Enhanced Analytics option provides you with the ability to collect more information about the Web Application Security policy for your application’s BIG-IP host device. When this feature is enabled, the enhanced data displays additional dimension objects and data for the security dimensions found in the Analytics area.
In addition to displaying enhanced traffic data, you can select additional HTTP traffic data to view details about the application’s traffic during the time of an attack (for example, Client IPs, Geolocations, or URLs).
The Enhanced Analytics option does not impact your BIG-IQ system performance. By default,you can enable up to 20 applications simultaneously in Enhanced Analytics mode.
Note: System administrators can adjust the maximum number of applications by modifying the maxNumberOfApps parameter value in the /var/config/rest/config/restjavad.properties.json file.
This table lists and describes the security dimensions that can display additional metric data, when Collect Security metrics for all devices hosting <Application Name> is selected in the Enhanced Analytics Settings popup screen. When Enhanced Analytics is enabled, the added data is displayed in the Web Application Security charts. When disabled, these dimensions display aggregated data in the dimension object list.
| Enhanced Setting Metric | Affected Dimension(s) | Description | Value displayed when disabled |
|---|---|---|---|
| Collect Security metrics for all devices hosting <Application Name> | Network Protocols | The network protocols of the requests to your application. | N/A |
| Client IPs | The client IP addresses sending requests to your application. | Aggregated | |
| Client Device IDs | The client IDs generated for requests to your application. | Aggregated | |
| IPs Reputation | The client IP reputation categories for requests to your application. | N/A | |
| Countries | The countries from which your application receives requests. | N/A | |
| Users Name | The user name input for your application. | N/A | |
| Session IDs | The assigned session IDs for requests to your application. | N/A | |
| URLs | The URLs from which your application receives requests. | N/A | |
| Methods | The HTTP request methods to your application’s resources. | N/A | |
| Mobile App Types | The mobile application type from which a user sent a request. | N/A | |
| Mobile App Versions | The mobile application version from which a user sent a request. | N/A | |
| Violations | The types of violations from requests to your application | N/A | |
| Virus Names | The names of viruses from requests application | N/A |
DNS load balances global resources to control and distribute application traffic according to your policies. Monitoring DNS application service data allows you to evaluate how your DNS configuration manages traffic. You can use the charts to evaluate the DNS application service to your application’s GSLB domain.
To view DNS traffic data, go to Applications > APPLICATIONS > <Application Name> > <DNS Application Service>. From the DNS application service’s dashboard, select the FQDN (domain name) option at the center of the screen. Ensure you are on the ANALYTICS tab, to view data. For more information about editing your DNS service properties or GSLB configuration, see Managing DNS and DNS GSLB objects using BIG-IQ.
This table describes the menu options and charts found in the DNS application service dashboard (Applications > APPLICATIONS > <Application Name> > <DNS Application Service>). Select the option marked in the image to view charts at the bottom of the screen. These charts display the trends of DNS traffic within your application’s domain.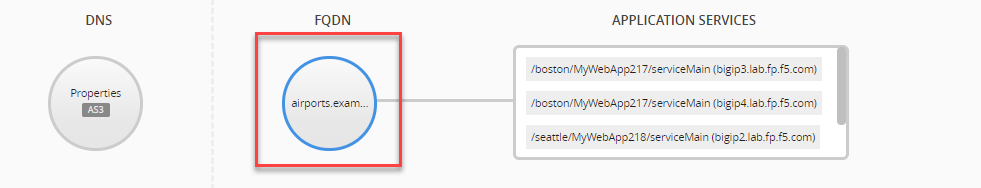
|
ANALYTICS Menu Option |
Chart Title |
Description |
|---|---|---|
|
DNS RPS |
Requests (average/sec) |
The number of DNS name resolution requests per second the BIG-IP system handles based on the rate-limited license installed on the system.Metric Unit: Average DNS requests per second Legend: Requests: The average number of DNS requests per second.Resolved: The average number of resolved DNS requests per second. Persisted: The average number of persistent DNS requests. When DNS persistence is enabled it ensures that when a local DNS makes repetitive requests on behalf of a client, the BIG-IP system reconnects the client to the same resource as previous requests Dropped: The average number of dropped DNS requests per second. |
|
DNS Load Balancing Decisions |
Load Balancing Decisions (average/sec) |
The average number of DNS requests per second, based on the most common load balancing methods applied to DNS traffic. Metric Unit: Average DNS requests per second Legend: Top load balancing methods |