The SSLO overview screen provides insights into the health of the configured objects, in addition to the average traffic data detected on all managed topologies. Each tile on this screen provides insights into the current status of all centrally managed SSLO configurations. To view the SSLO Overview screen, go to Monitoring > DASHBOARDS > SSL Orchestrator > SSLO Overview.
Note: To monitor SSLO analytics activity, you must have a DCD configured to your BIG-IQ, with statistics collection enabled. For more information about the minimum requirements for viewing SSLO data, see Monitoring BIG-IP statistics in BIG-IQ.
The tiles in the overview screen each provide unique aspects of SSLO configuration, or traffic data. The displayed traffic data is the average data collected over the past five minutes.
Select the TOPOLOGIES, DEVICES, or SERVICES tiles to view a summary list of these SSLO objects. You can click any of the remaining tiles (excluding TOP COUNTRIES MAP) to display additional details on the SSLO Analytics screen (Monitoring > DASHBOARDS > SSL Orchestrator > SSLO Analytics).
Tile
Description
Corresponding Dimension(s)
TOPOLOGIES
Displays the total number of topologies configured (deployed or in draft). Each health status lists the current number of topologies with that health status.
Topologies
DEVICES
Displays the total number of devices managing SSLO configurations. Each health status lists the current number of devices with that health status. The TOP CPU USAGE displays BIG-IP devices with the highest percent CPU usage.
BIG-IP Host Names BIG-IP Blade Numbers
Note: For Device CPU data, go to Configuration > SSL ORCHESTRATION > Devices
SERVICES
Displays the total number of services (deployed or in draft). Each health status lists the current number of services with that health status.
Service Path
SSL DECRYPTION
Displays the distribution of encrypted traffic that passed through the topologies.
Decryption Status
TOP COUNTRIES MAP
Displays a map that highlights the countries with the most requests that passed through the topologies. This information is view-only.
N/A
TOP COUNTRIES
Displays the destination countries with the most client-side new connections to your topologies.
Destination Countries
TOP URLs CATEGORIES
Displays the URL categories with the most client-side new connections. You configure these categories when you provision APM policies with secure web gateway (SWG).
URL Categories
TOP IPI CATEGORIES
Displays the top IP Intelligence categories with the most client-side new connections. IP reputation is an addition subscription of IP Intelligence to your provisioned ASM.
IPs Reputation
TOP SERVER CIPHERS
Displays the SSL server-side cipher names with the most client-side new connections to your topologies.
Server Cipher Versions Service Cipher Names
TOP CLIENT CIPHERS
Displays the SSL client-side cipher names with the most client-side new connections to your topologies.
Client Cipher Versions Client Cipher Names
DEVICES: TOP MEMORY USAGE
Displays the BIG-IP device host names with the highest percent CPU usage.
For Device CPU data, go to Configuration > SSL ORCHESTRATION > Devices
When you monitor the health of your SSLO objects, you can manage and mitigate issues that might affect the overall performance of your protected network.
You centrally manage SSLO health using the data charts and alerts that signal issues with the aspects of your topology, service chain, and device configuration. You can monitor these aspects of your SSL Orchestrator for changes in health.
Topology
You configure SSL Orchestrator topologies to support your various network routing needs. These topologies support your configured service chains and security inspection settings for an network’s inbound and outbound traffic. Topology health issues arise when either the BIG-IP device, service, or both, report health issues. The health of the topology reflects the most severe health status of any of its BIG-IP devices or services. By identifying topology health issues, you can then further isolate issues affecting services and devices
Service
Services process traffic connections based on the contexts provided by the security policy. These services are assigned to a pool that belongs to a virtual server within the BIG-IP device. The health of the service is based on the status of its connected pool. The system sends alerts for both pools and virtual servers regarding the health status of the service’s connected pool:
Pool alerts (service alerts)
The system monitors the pool status based on the pool member responses to the server. When one or more pool members becomes unresponsive, the health of the service is reduced to moderate. If all pool members within the service pool are unresponsive, the health becomes critical.
Note: A cleared pool or virtual server alert results if the pool members are back online or the pool is deleted. Additionally, a cleared alert might be sent if the virtual server is deleted.
Device
The BIG-IP devices that manage the traffic to your SSLO configuration might also manage other application services, aside from SSLO. The health of your devices isbased on configured thresholds for CPU, memory, and traffic throughput. Once these thresholds are passed, the BIG-IP device’s health is reduced to moderate or critical.
Before you can identify SSLO health issues, you must have the supported BIG-IP device and SSLO versions that are outlined in Managed BIG-IP statistics in BIG-IQ. For data visibility, you must configure:
A BIG-IQ data collection device configured for the BIG-IQ device
The BIG-IP device located in your network and running a compatible software version
Statistics collection enabled for managed BIG-IP devices
AVR provisioned on your BIG-IP devices
You isolate issues that might affect the performance of your SSLO by identifying a reduced health status of your topologies, BIG-IP devices, or SSL service.
Go to Monitoring > DASHBOARDS > SSL Orchestrator > SSLO Overview.
The overview screen displays tiles with current information about your SSLO configurations.
Use the TOPOLOGIES, DEVICES, or SERVICES tiles to evaluate whether any of your SSLO objects have critical or moderate health status.
Note: Topology health reflects the most severe health status of its connected devices and services.
Click one of the health-related tiles to view a list of the selected SSLO objects.
The screen lists the objects, and provides data regarding current traffic and health status. Data in the summary bar reflects the average of all listed objects for the past five minutes.
To filter the list to display objects with health alerts, click Critical or Moderate in the HEALTH area of the summary bar.
To further evaluate an object’s data, click the chart button (
) to the left of the object’s name and health.
The screen displays a dashboard with data based on your selection.
In the charts, evaluate whether data reflects significant changes over time.
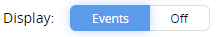
If you observe significant changes, enable Events (
) to display system notifications that might provide more information about why traffic experienced significant changes. You can click one of the numbered icons in the chart to display the list of events that occurred at that time.
To isolate details about active alerts, click See All in the ACTIVE ALERTS area at the top right of the summary bar.
This displays a list of the recent, and active, alerts relating to your selected object’s health. If there are no active alerts, the health issue was either resolved, or the object was deleted. For more information about the object’s alert history, return to the previous screen and click See All in the ALERT HISTORY area in the summary bar.
From the active alerts list, select the row of the most recent alert, to display the alert’s details a the bottom of the screen.
If you have identified a specific issue that impacts your object’s health, edit the object’s current configuration to mitigate performance impact. Edit the configuration of the object by selecting its name from the list screen.
This information describes the data provided by SSLO topologies. You can find this data when you select a single topology (Monitoring > DASHBOARDS > SSL Orchestrator > SSLO Overview > TOPOLOGIES > [Selected Topology]) or SSLO Analytics thatdisplays a summary of all topology data (Monitoring > DASHBOARDS > SSL Orchestrator > SSLO Analytics).
The summary bar is located across the top of the screen and displays the current health, traffic data, and alert information for either a selected topology, or the average data for all topologies. Traffic data and health information reflect the average over the past five minutes.
HEALTH
The SSLO topology health is measured based on the health status of the pool managing the services in the service chain, and BIG-IP devices hosting the topology. Topology health reflects the most severe status of at least one of connected objects’ health.
SSL HIT COUNT OVER TIME
The SSL hit count over time is the average number of SSL new client connections to the topology, distributed by their security outcome.
TOP CIPHER ACTIVITY
This is the most commonly detected SSL cipher names with new client connections to the topology’s host device.
THROUGHPUT IN
This shows the number of transactions (in BPS) that were detected by topology.
ALERTS
The ALERT HISTORY and ACTIVE ALERTS display the topology-related alerts, which indicate changes in the topology health status. Active alerts are listed when an alert is raised and has not been cleared.
The charts, and data widgets above the charts, display average data based on the selected time settings. You can filter the chart data using the dimension objects in the dimensions pane to the right of the charts.
Connections by Decryption Action
Displays the number of new client connections initiated with any of the topology’s host BIG-IP devices. Data in this chart is distributed by whether the connection required decryption or not. See the data in the dimension Decryption Status to evaluate data per decryption action.
Bytes per Second
Displays the average number of bytes (per second) that passed through one of the topology’s host BIG-IP devices. Data is displayed by the part of the transaction to and from the BIG-IP devices.
Analytics data for SSLO allows you to drill down into aspects of traffic and traffic management that impact the performance and protection of your applications. When reviewing analytics data, you can evaluate metric data based on traffic aspects (dimensions). The following metrics and dimensions reflect data found in the dashboards for SSLO Analytics screens (Monitoring > DASHBOARDS > SSL Orchestrator).
Metrics reflect measurable units received from traffic, which you can evaluate based on a dimension object. Each metric displays object data by average per second (Avg/s) or number of units observed for the selection period of time (count). Byte data, based on direction, reflects the transaction to and from the BIG-IP device.
Dimensions consist of objects that characterize the various aspects of SSLO traffic and traffic management. Some of the dimensions have a set list of objects, while others are dynamic-based system, or configuration, or traffic results. This list describes the type of objects found in each dimension.
BIG-IP Host Names-The host name of the BIG-IP devices over which the topology was deployed.
BIG-IP Blade Numbers–The blade number for the BIG-IP devices over which the topology was deployed.
Applications–The name of the container for the application services in the BIG-IQ user interface.
Application Services–The categorization of the application services contained within the application.
Virtual Servers–The virtual servers reporting the topology’s traffic data.
Actions–The service chain classification based on the SSLO action:
Allowed–SSLO allowed the connection to go to its destination
Bypassed–Based on the service chain classification, SSLO allowed the connection to go to its destination without traversing any service chain.
Rejected–Based on the service chain classification, or network error, SSLO terminated the connection.
Intercepted–Based on the service chain classification, SSLO stripped the TLS armor from a connection and sent the decrypted contents of the connection through a service chain.
Destination Countries–The countries listed as the destination in the payload of the client requests.
Client Cipher Versions–The cipher version used the client request.
Server Cipher Names–The server cipher names used in reported transactions.
Client Cipher Names–The client cipher names used in reported transactions.
Server Cipher Versions–The cipher version used in the server response.
Decryption Status–The traffic based on the need for decryption:
Decrypted
Unencrypted
Plain Text (requires no decryption)
Service Paths–The names of the service chains.
Traffic Types–The network protocol used in the transaction.
URL Categories–The URL categories configured for secure web gateway (SWG). This dimension is relevant to users who have configured an APM policy with a SWG.
Serving Applications IPs–IP addresses of applications connected to a topology.
IP Reputation–The IP categories configured for IP Intelligence. This dimension is relevant to users whohave configured an AFM policy with IP Intelligence.
Topologies (not relevant to single topology)–The names of the deployed topologies processing traffic.
Note: In the rare case that a dimension object is labeled as Aggregated, this indicates that data received could not be categorized by the statistics service.
The following information liststhe data provided by BIG-IP devices with an SSLO configuration. You can find this data when you select a single device (Monitoring > DASHBOARDS > SSL Orchestrator > SSLO Overview > DEVICES > [Selected Device]).
The summary bar is located across the top of the screen, and displays the current health, traffic data, and alert information for a selected device. The device throughput and health data display all activity, including non-SSLO services. Traffic data and health information for the summary reflects the average over the past five minutes.
HEALTH
The SSLO device health is measured based on metric thresholds configured for centrally managed BIG-IP devices. To review the health thresholds for your device, go to Applications > ALERT MANAGEMENT > Alert Rules and select the default device health rules.
CPU USAGE
The average percent of CPU usage for the selected device. The chart displays a different color for the metric thresholds that have been surpassed.
MEMORY USAGE
The average percent of memory usage for the selected device. The chart displays a different color for the metric thresholds that have been surpassed.
SSL DECRYPTION
The average number of connections distributed by the decryption status. Connections that do not require decryption are labeled as either Unencrypted or Plain Text.
CIPHER ACTIVITY
The most commonly detected client, or server, SSL cipher names with new client connections to the selected device.
THROUGHPUT
The number of transactions (in average BPS) that were detected by the device from the client or server (throughput in) or from the device to the client or server (throughput out).
ALERTS
The ACTIVE ALERTS area displays the device-related alerts that indicate changes in the health status. Active alerts are listed when an alert is raised and has not been cleared.
The charts display average data based on the selected time settings. You can filter the chart data using the dimension objects in the dimensions pane to the right of the charts.
CPU
The average CPU percent usage of the device over the selected period of time. The chart displays data based on which activities required the most CPU, and the overall usage of each CPU core.
Memory
The average percent of memory usage of the device over the selected period of time. The charts display data based on which activities required memory usage.
Disk
The average disk data, based on read and write activities.
Disk Usage
The average disk usage (bot read and write) based on the configured partitions for the BIG-IP device.
Interface Health
The average number of traffic errors and dropped packets detected by the BIG-IP device for incoming and outgoing traffic.
This information is the data provided by the virtual server to the SSL services. You can find this data when you select a single service (Monitoring > DASHBOARDS > SSL Orchestrator > SSLO Overview > SERVICES > [Selected Service]).
The summary bar is located across the top of the screen, and displays the current health, traffic data, and alert information for a selected SSL service. Traffic data and health information reflect the average over the past five minutes.
HEALTH
The SSLO service health is measured based on the availability of the pool members in the pool associated with the service. When a pool member is detected as offline or disabled, the health status of the service is reduced.
THROUGHPUT
The average number of transactions detected to and from the BIG-IP device to the virtual server (in average BPS).
CONCURRENT CONNECTIONS
The number of sustained connections between the virtual server and the BIG-IP device.
ALERTS
The ALERT HISTORY and ACTIVE ALERTS display the pool alerts, which indicate changes in the service’s health status. Active alerts are listed when an alert is raised and has not been cleared.
The charts display average data based on the selected time settings. You can filter the chart data using the dimension objects in the dimensions pane to the right of the charts.
New Connections
The average number of new connections per second to the virtual server over time from either the client side or server side.
Concurrent Connections
The number of ongoing connections to the virtual server from either the client side or the server side.
Throughput Bytes
The average number of bytes per second processed to and from the virtual server over the course of the transaction.
Throughput Packets
The average number of packets per second processed to and from the virtual server over the course of the transaction.
Transactions
The average number of round trip request to response cycles, per second, to the virtual server.