Manual Chapter :
ce file for analytics
Applies To:
Show Versions
BIG-IQ Centralized Management
- 7.1.0
ce file for analytics
Definitions of terms, metrics, dimensions, and charts in
analytics. In addition, common screen elements for Applications tab dashboard
elements
Before you begin this task, isolate a service scaling group device
that is experiencing health issues by using the service scaling group screen (
).
Prereqs for visibility:
- A BIG-IQ data collection device configured for the BIG-IQ device
- The BIG-IP device located in your network and running a compatible software version
- Statistics collection enabled for managed BIG-IP devices
- AVR provisioned on your BIG-IP devices
- A Data Collection Device (DCD) configured to your BIG-IQ system.
- Managed BIG-IP devices have ASM provisioned for managing security policies.
- The BIG-IQ system has Shared Security (SSM) discovered to manage virtual servers' DoS and logging profiles.
- Managed BIG-IP devices have AVR provisioned (recommended).
If you have administrative access, you can view the
Web Application Security settings for multiple applications on the Web Application
Security dashboard .
- Application Traffic MetricsApplication response time indicates the time (in ms) it takes an application server to respond once it receives a request.HTTP transactions include the entire process from when a client sends an HTTP request to the application server, until the client receives a response.Concurrent connections indicate the number of connections that are open at the same time, either on the client-, or server- side.You must have Web Application Security services installed on your application management devices in order to view security data. The BIG-IP device hosting these services must have AVR provisioned with version 13.1.0.5, or later, to view data.To view application health or traffic data, your application must have be managed by a BIG-IP device version 13.1.0.5 or later with the following device configuration:
- AVR is provisioned
- HTTP statistics collection is enabled
BIG-IP devices earlier than version 13.1.0.5 do not collect data that supports metric alerts. Applications that are managed by earlier versions of a BIG-IP device do not receive metric alerts. - TBDThe application service's dashboard is displayed. Ensure theANALYTICStab at the center of the screen is selected
- The summary bar at the top of the screen provides high-level information that indicates the status of your applications.
- Adjust the view setting for the applications listed on the screen using the grid or tile buttons
 .
. - To filter applications in either view, select an option from the filter
 , and search according to key words.
 - PressEnterto filter.
- To sort applications in grid view, click the column header.
- To sort applications in tile view, select an option from theSort bymenu.
- You can adjust the view setting for the service scaling groups listed on the screen using the grid or tile buttons.
- To filter service scaling groups in either view, select an option from the filter, and search according to key words.
- To sort service scaling groups in grid view, click the column header.
- To sort service scaling groups in tile view, select an option from theSort bymenu.
- In the single service scaling group screen ( ), clickCONFIGURATION.
- To view application traffic data, select from options to the left of the screen in the ANALYTICS area.This displays charts for the application's traffic data.Expand the chart view by collapsing the summary bar and/or application configuration map using the arrows to the right of these areas.Users with administrative access can view statistics for multiple applications by clicking .
- To view your application's current security settings, click CONFIGURATION to display the security policies and settings.Users with administrative access can edit the application's associated security policy. Select a policy based on the security service:
- For Network (AFM) go to .
- For Access Policy (APM) go to .
- For Web Application Security (ASM) go to .
- Adjust the time settings using the controls at the top of the screen according to your monitoring needs.These time settings persist when navigating among charts.
- Use the tab at the right of the chart to expand the dimension pane.
- Expand the dimension widgets to view the metric data for each dimension object.Some dimensions present aggregated data. To view detailed dimension data objects, enable theEnhanced Analyticssettings.
- Select one or more dimension objects to filter by that data in the charts and other dimensions.Certain dimensions objects are only available when Enhanced Analytics data collection is enabled.
- Open the application properties screen by selecting the application's name from the Applications screen ( click ).
- All data presented on the screen is updated according to the refresh cycle, which you can adjust using the refresh button
 .
. - Near the middle of the screen under APPLICATION SERVICES, clickSecurity.The screen displays security information in the ANALYTICS and CONFIGURATION areas.
- Adjust the time settings using the controls at the top of the chart based on when the alert was triggered, or as needed.
- To view security alerts in the chart, click theSecuritybutton from the Category filters found below the chart.EnableEventsin the time settings to view corresponding alerts.
- Expand the dimensions pane using the handle at the right side of the screen.
- In the Health area, click a health status to filter the screen list by that selection.This filters the service scaling group list on the screen.
- To customize dashboards filters:
- To sort the screen list:
- In grid view: Click one of the column headers to sort by ascending or descending order.If a column does not appear in the grid view, click theSelect columnsicon to adjust the displayed view.
- In tile view: Select an option from the Sort By list at the top left of the tiles.
- To sort the screen list by health status:
- In grid view, click the Health column header.If the Health column is not displayed, click the gear icon,
 to the right of the filter field, and
select Health.
to the right of the filter field, and
select Health. - In tile view: From theSort bymenu, clickHealth Status - High-to-Low.
- To sort the screen list by SSGs with the most active alerts:
- In grid view, click the Alerts column headerIf the Alerts column is not displayed, click the gear icon, to the right of the filter field,
and select Active Alerts.
- In tile view: From theSort bymenu, selectActive Alerts- High-to-Low
- The Health area displays the number of applications that are currently at each health status. Use this summary to identify which applications require additional analysis due to changes in performance thresholds.
- The Health area displays the number of service scaling groups that are currently at each health status. Use this summary to identify which service scaling groups require additional analysis due to changes in performance thresholds. You can select a health status to filter the service scaling group list.
- Go to the Active Alerts area at the top right of the screen to review if there are ongoing alerts. These alerts will indicate (up to) the five most severe thresholds that are currently surpassed. These thresholds are configured according to specific alert rule data collected.To see a full list of active alerts, and their details, clickSee All.
- In the CONFIGURATION area, clickDevicesfrom the left.This opens a chart that lists all the devices that are providing BIG-IP system services to the service scaling group.
- Click
 to return to the
previous screen.
to return to the
previous screen. - In a VMware environment, you can selectLoad Balancing Devicesto display device information for load balancers to the service scaling group.This area displays device configuration and details, including health and performance information. A load balancer with poor health or performance issues might impact all the devices in the service scaling group.
- Click the application's name for additional data and information about that specific application.This automatically opens the application's dashboard, where you can further isolate its performance issues, and edit its configuration and security policies.
- Click the service scaling group's name for additional data and information about that specific service scaling group.This automatically opens the service scaling group's dashboard, where you can further isolate its devices' performance, evaluate connected applications and edit its configuration.
- Security FilterSelect the number of affected applications to filter the screen list by that selection.
- Spark LineYou can hover over the spark line to view data values over the past hour.
- Summary Bar FiltersClick this area to filter the list data by value in descending order.This automatically filters the screen list.
- Click the application's name to open the single application dashboard.
- Alert Concept definitionThe system triggers alerts based on stateful and stateless data that is collected from the various system elements that are monitored. Once triggered, the alert remains active until its status changes.The following alert rule set does not apply to the BIG-IP VE devices in a service scaling group. The default rules do apply to the load balancer BIG-IP device in a service scaling group.
- You can adjust the Warning and Critical threshold values for enabled metrics.A metric threshold violation must be sustained for 5 minutes to trigger an alert. A subsequent alert is triggered once another threshold is crossed (either an increase or decrease in severity, or cleared).To ensure that metric conditions are improving, metrics are declining in severity (critical to warning), or cleared, an alert is triggered only when the value is sustained for five minutes at ten percent below the threshold value. For example, if a threshold value is configured for greater than 60 percent, a declining severity must be sustained at 54 percent or less to trigger an alert.
- ClickSaveat the bottom of the screen, or clickSave & Closeto save and return to the Alert Rules screen.
- Go to .
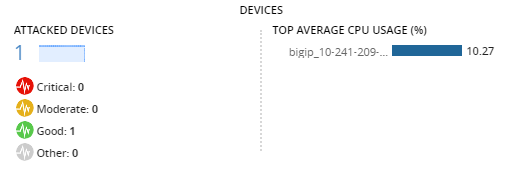
- Click the DEVICES area in the summary bar at the top of the screen to display the list of devices with ongoing DoS attacks.
- Click the PROTECTED OBJECTS area in the summary bar at the top of the screen.
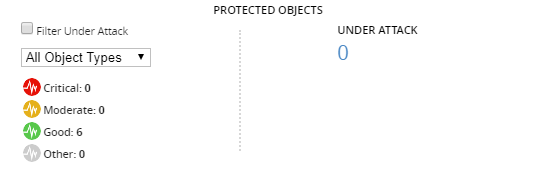 The screen displays details of all protected objects, including the object's health status, number of attacks detected, protection mode, and host BIG-IP device.
 - Locate the ATTACKS area at the top left side of the screen to view a summary of all ongoing DDoS attacks.

- To isolate attacks by severity, select one of the severity levels from ATTACK SEVERITY.
- The Warning alert. The attack's details indicate that an non-mitigated attack would have a moderate impact on your protected objects.
- The Critical alert. The attack's details indicate that a non-mitigated attack would have a critical impact on your protected objects
- To filter attacks by protection mode, specify how to view them:
- ClickMitigatedto view attacks detected by a DoS profile that is configured to mitigate or block traffic recognized at an attack.
- ClickNot Mitigatedto view attacks detected by a DoS profile that is configured to monitor traffic recognized as an attack.
- Select an attack from the Attack ID column.The screen displays attack details and statistics about the attack vectors, BIG-IP devices, and protected objects. By default, the statistics at the bottom of the screen display transaction data from the virtual server(s) that reported the attack.
- To view detailed information about the virtual server transactions, use the dimension pane to the left of the chart.You can expand these dimensions and select objects to filter displayed data.
- Go to .The screen displays a list of all DoS protected objects managed by your BIG-IP devices.
- If you are creating the filter by directly entering text into the Query Expression area, use the following syntax for that query text.
- You express elements of the filter query as key value pairs, separated by a colon, such asprofile_name:"MyCurrentProfile".
- You can use the following operators within a filter query.OperatorUsage ExampleANDThis:p1 AND bar:(A AND B AND "another value")AND NOTAND NOT qux:errorORname:"this is a name" OR bar:(A OR B OR C)OR NOTOR NOT qux:error*support_id:*123*. This operator can only be used for text fields.
- You must enclose values that have spaces within quotation marks, such askey:"two words".
- You can query any field for more than one value by enclosing the values with parentheses, such askey:(a b "two words"). In this case, the default operator is OR.
- Only pre-defined values are allowed for fields with a type of multi-value. These values are listed in the Query Parameters area, in the list next to the relevant field.
- Values with a type of date accept valid date formats, such as'Oct 30, 2017 00:00:00'.
- Values of the date range type accept input in the format of[min_date...max_date], such as'[Oct 30, 2017 00:00:00...Oct 30, 2017 06:00:00]'. The date range might also contain only minimum without maximum, and the reverse, such as'[Oct 30, 2017 00:00:00...]'or'[...Oct 30, 2017 00:00:00]'.
- Values of the numeric range type accept input in the format of[min...max], such as'[1...100]'. The numeric range might also contain only minimum without maximum, and the reverse, such as'[1...]'or'[...100]'.
- You must include the full path to the policy in a policy name, such as/Common/MyPolicy.
You can identify
the status of protected objects and BIG-IP devices that have reported DoS attacks. This
way you can evaluate the performance impact of the attack, and whether changes to your
security policy or DoS profile are required.


