Updated Date: 07/07/2026
Web Application Security Charts
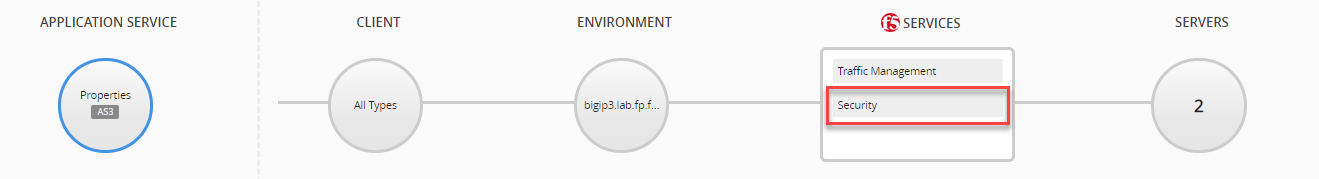
The charts that reflect Web Application Security data allow you to analyze current trends in traffic to applications with Web Application Security. The parameters found in the charts described display the detected layer 7 security threats, out of all HTTP traffic. The configuration of application service the in view is indicated in the Properties icon, as indicated in the image of an AS3 application service.
- Illegal Transactions Rate (TPS)
- The average number of illegal transactions per second that were identified by the Web Application Security profile. These transactions were detected based on the violation rating and your Web Application Security policy’s action settings. Increases in illegal traffic over time can indicate an increase in attacks to your applications, or it can indicate an overly-strict protection policy. The current protection mode is indicated by Blocked or transparent transactions. You can use the Violation Rating dimension to filter violations above a certain threat level. This will allow you to identify specific violations types that were detected.
Tip: A single illegal transaction can include multiple violations. Therefore, comparing the number of illegal transactions vs the number of violations may not accurately reflect your system’s status. It is recommended to primarily evaluate the number of illegal transactions.
- Transactions Rate by Violation Rating (TPS)
- The average number of transactions per second by the detected threat level assigned by your Web Application Security policy. The threat level of the traffic is shown in ascending order; from Legal to Malicious.
- Top 6 Violations (Violations/s)
- The six types of violations most commonly detected (per second). Violation information can be useful in adjusting your Web Application Security policy for optimized protection against the most common attacks.