


Updated Date: 07/07/2026
Monitoring Behavioral DoS protection
Behavioral DoS (BADoS) provides automatic protection against DDoS attacks by analyzing traffic behavior using machine learning and data analysis. Working together with other BIG-IP DoS protections, Behavioral DoS examines traffic flowing between clients and application servers in data centers, and automatically establishes the baseline traffic/flow profiles for Layer 7 (HTTP) and Layers 3 and 4.
For example, in the case of a DDoS attack from a botnet, each request may be completely legal but many requests all at once can slow down or crash the server. Behavioral DoS can mitigate the attack by slowing down the traffic no more than necessary to keep the server in good health.
Behavioral DoS continuously monitors server health and loading, by means of a customer feedback loop, to ensure the real-time correlations, and validate server conditions, attacks, and mitigations. Any subsequent anomalies are put on watch, and the system applies mitigations (slowdowns or blocks) as needed.
This is how Behavioral DoS works:
- Learns typical behavior of normal traffic
- Detects an attack based on current conditions (server health)
- Finds behavior anomaly (what and who changed to cause congestion?)
- Mitigates by slowing down suspicious clients
- Improves with experience
You enable Behavioral DoS, which requires minimal configuration, in a DoS profile in the Stress-based detection settings. Because the system is tracking the traffic data, it adapts to changing conditions so there are no thresholds to specify. You set the level of mitigation that you want to occur, ranging from no mitigation (learning only) to aggressive protection (proactive DoS protection). The system can quickly detect Layer 7 DoS attacks, characterize the offending traffic, and mitigate the attack.
You can use a DoS profile that has Behavioral DoS enabled to protect one or, at most, two virtual servers.
Evaluating the outcome of your Behavioral DoS (BaDoS) protection to your virtual server, or application, varies depending on the following DoS Behavioral and Stress-based settings. These settings apply thresholds that evaluate server stress, which then allow the system to identify behavioral signatures that characterize the attack. To edit your profile’s settings, go to your DoS protected objects list, and select the DDoS profile link (Monitoring > DASHBOARDS > DDoS > Protection Summary. From the DoS profile, expand Application Security and select Behavioral & Stress-based Detection. For more information about DoS profile configuration, see Create DoS Profiles.
Stress-based detection determines an ongoing DoS attack. This method combines monitoring of general traffic over time, in addition to specific detection measures that indicated a DoS attack. Using specific threshold indicators, such as repeated source IPs or URL requests, the system can identify when an attack is ongoing. Web Application Security settings trigger an attack if any (or all) options in your stress-based settings are configured in your DoS profile.
Note: Site Wide detection is applied when traffic to the entire web site has exceeded the thresholds defined in the detection thresholds, and an attack has not been detected using any of the other detection criteria.
Behavior detection settings identifies attacks and the attack’s characteristics. This detection method provides signatures of an attack that can be added to your attack signature list, when reoccurring. The following behaviors are used to trigger an attack:
- Bad Actor Detection
- Tracks and attempts to identify the bad actors contributing to a given set of malicious traffic. This method identifies a set of malicious traffic contributing to the server stress, and attempts to identify what source IP addresses are generating the malicious traffic, and what percentage of malicious traffic a given bad actor is contributing. Bad actors, are mitigated at transport layer via slowdown mitigation techniques, and the rate at which they are mitigated is directly related to their percentage of contribution to the malicious traffic set, and the mitigation selected.
- Signature Detection
- When enabled, traffic characteristics are used to identify the cause of the server stress. If there are deviating characteristics, the system dynamically generates a signature based to block traffic anomalies.
-
When Accelerated signatures is enabled, the system detects signatures before connection establishment. This automatically enables the syn-cookie mechanism during the attack.
-
When Use approved signatures only is enabled, the system administrator must manually review and approve detected signatures to enable mitigation action. To view these signatures go to Monitoring > EVENTS > DoS > Dynamic Signature.
- No Mitigation
- Monitors traffic, generates signatures, and identifies bad actors, but does not perform any mitigation.
- Standard Protection
- If Bad Actors Behavior Detectionis enabled, slows down identified bad actors.
-
If Request Signatures Detectionis enabled, blocks requests that match attack signatures.
-
Rate limits all requests based on server health
-
Limits the number of concurrent connections from bad actor IP addresses.
-
Limits the number of all concurrent connections based on server health
- Aggressive Protection
- If Bad Actors Behavior Detectionis enabled, slows down identified bad actors.
-
If Request Signatures Detectionis enabled, blocks requests that match attack signatures.
-
Rate limits all requests based on server health
-
Limits the number of concurrent connections from bad actor IP addresses.
-
Limits the number of all concurrent connections based on server health
-
Proactively performs all protection actions, even before attack detection, increasing impact of protection techniques.
When reviewing traffic, it is important to note that this protection method applies system settings to detect attacks as they occur. Once the system detects an attack, it immediately begins mitigation to protect from server overload. You can see an example of this in the image, which shows the virtual server’s report of server stress over time following two separate attacks. By evaluating signatures of attacks, you can manage your settings to allowlist or denylist traffic based on detected signature outcomes. 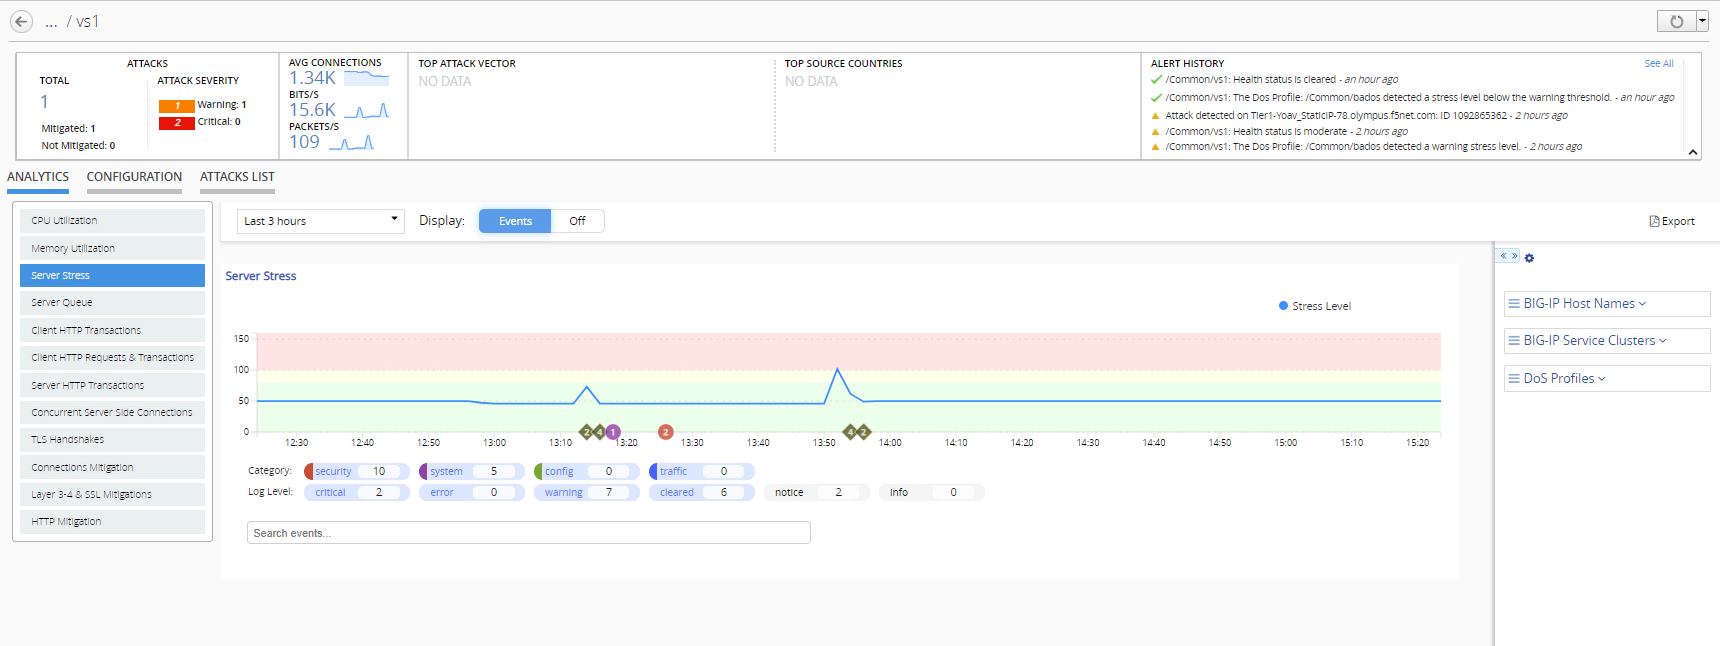
Behavioral DoS protection occurs when a protected object uses traffic thresholds to detect whether and application server (pool member) is under stress. Pool member health issues can indicate issues with the application’s performance. By monitoring virtual servers and pool member status events, you can evaluate whether mitigation action is required.
In addition, you can monitor the detected attacks over time, and evaluate whether a dynamic behavioral signature is repeatedly attacking your application.
You must have Behavioral and Stress-based DoS (BaDoS) detection enabled on your DoS profile. In addition, the DoS profile must be deployed to the protected virtual server.
Evaluate BaDoS traffic statistics to your virtual server to ensure that yor application servers are able to manage traffic properly when under DoS attack. Attacks may be indicated by virtual server or pool member alerts.
-
Go to Monitoring > DASHBOARDS > DDoS > Protection Summary.
-
Click the PROTECTED OBJECTS area in the summary bar at the top of the screen.
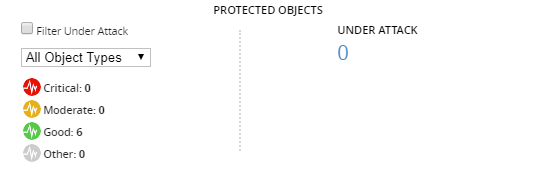
The screen displays details of all protected objects, including the object’s health status, number of attacks detected, protection mode, and host BIG-IP device.
-
Select the name of the virtual server protected by a BaDoS profile.
The screen display’s the virtual server’s dashboard. Ensure the tab at the center of the screen is set to ANALYTICS.
-
Use the menu to the bottom left of the screen to navigate among the charts.
Tip: The Server Stress chart is the primary indicator of an ongoing attack, and its mitigation status.
Virtual Server events and indicate the status of the virtual server and its pool. You can see these events and alerts in the charts of the application properties screen ( Applications > APPLICATIONS > <Application Name> > <Application HTTP Service>) and in the Local Traffic dashboards ( Monitoring > DASHBOARDS > Local Traffic). You can also view alerts in the Active Alerts and Alert History screens (Applications > ALERT MANAGEMENT).
|
Alert |
Description |
Default Thresholds |
Impact |
|---|---|---|---|
|
|
The virtual server is offline as a result of status or configuration changes. The system then updates the virtual server status with one of the following messages:
Note: The virtual server monitor is configured on the BIG-IP system.
|
Critical: Offline |
Prolonged issues that impact application pool member performance require either virtual server mitigation, or pool member configuration mitigation. |
|
|
The pool response to the virtual server. Pool status is based on the pool member response. |
Critical: All pool members in a pool are unresponsive Moderate: At least one, but not all, members in a pool are unresponsive Cleared: All pool members are back online, or the virtual server was deleted. |
Pool member events and alerts indicate the status of a pool member. You can see these events and alerts in the charts of the application properties screen (Applications > APPLICATIONS > <Application Name> > <Application HTTP Service>) and in the Local Traffic dashboards (Monitoring > DASHBOARDS > Local Traffic). You can also view alerts in the Active Alerts and Alert History screens (Applications > ALERT MANAGEMENT).
|
Alert |
Description |
Indication |
Default Thresholds |
Impact |
|---|---|---|---|---|
|
|
The pool member (server) is offline as a result of status or configuration changes. The system then updates the pool member status with one of the following messages:
|
Pool member issues can lead to increases in application response time, server-side round trip time (RTT), incomplete transactions, and server errors. |
Critical: Offline |
Prolonged impact on application performance might require the addition of a new pool member. |
|
|
The pool member response to the server. |
Critical: All pool members in a pool are unresponsive Moderate: At least one, but not all, members in a pool are unresponsive Cleared: All pool members are back online, or the virtual server was deleted. |
The charts that reflect behavioral DoS (BaDoS) data allow you to analyze traffic the system used to detect server stress over time. The parameters found in the charts described can indicate when attacks occurred and the amount of time required by the system to mitigate the attack. To view charts for an object protected by BaDoS, go to Monitoring > DASHBOARDS > Protected Objects and select a protected object name. Alternatively, go to Configuration > SECURITY > Shared Security > Protected objects > **** and select an object.
Note: Chart data is available only to certain versions of BIG-IP devices. See the chart information to verify whether data will appear for your object.
- Server Stress
- A measure of your application server (pool members) status, based on traffic volume data. Once a stress-based threshold is crossed the application’s stress status is elevated. Available to BIG-IP version 15.0 or later.
- Server Queue
- The BIG-IP host names, managing the virtual server’s traffic, with the highest server queues. Available to BIG-IP version 15.0 or later.
- Client HTTP Transactions
- The client-side outcome for HTTP transactions. Available to BIG-IP version 15.1 or later.
- Client HTTP Requests & Transactions
- The client-side outcome for HTTP requests and transactions. Available to BIG-IP version 15.1 or later.
- Server HTTP Transactions
- The server-side outcome for HTTP requests and transactions. Available to BIG-IP version 15.1 or later.
- Concurrent Server Side Connections
- The average number of active connections per second on the server side with the BIG-IP virtual server. Available to BIG-IP version 15.1 or later.
- TLS Handshakes
- The average number of transport layer security (TLS) handshakes to your virtual server. Available to BIG-IP version 15.1 or later.
- Connections Mitigation
- The average number of connection per second and the system mitigation action against the connection. Available to BIG-IP version 15.1 or later.
- Layer 3-4 & SSL Mitigations
- The number of dropped packets, or signatures, depending on the attack layer detection. Available to BIG-IP version 15.1 or later.
- HTTP Mitigation
- The number of dropped application layer connections, based on the mitigation action. Available to BIG-IP version 15.1 or later.
The following list defines the metrics gathered to monitor behavioral dos attacks and the dimension aspects from which data is observed. The information provided is found in the dimensions pane tables with the screens that display object data. You use this information to filter the on-screen data by specific dimension objects. For example, if you would like to view data that pertains to specific DoS Profiles. It is important note that all metric data is displayed as a unit over the time period selected for the screen.
The following defines the dimensions found in the dimensions pane that report behavioral DoS traffic and attack analytics.
- BIG-IP Host Names
- The name of each BIG-IP system that processed the monitored transactions.
- BIG-IP Service Cluster
- The name BIG-IP service cluster, or a group of multiple BIG-IP devices on a single network.
- DoS Profile
- The name of the dos profile(s) protecting the object.
|
Metric Set |
Metric Set Description |
Metric |
Metric Description |
|---|---|---|---|
|
Server Stress Level |
The average server stress score reported by pool members belonging to a protected virtual server. |
Avg |
Server stress is based on a threshold derived from several indicators reported by the virtual server. Warning Threshold: 80-100 Critical Threshold: >100 Cleared: <80 |
|
Transactions Queue Size |
The average number of requests in a serve queue |
Avg |
The average number of requests to an application server. |