Access reports focus on session and logging data from Access devices (managed devices with APM licensed and provisioned). F5 Secure Web Gateway Services reports focus on user requests (for URLs or applications, for example) from Access devices with Secure Web Gateway Services provisioned. BIG-IQ Centralized Management Access also supports high availability. Thus, users can view both Access and SWG reports on a secondary BIG-IQ system.
Access reports and SWG reports provide the following features.
Reports on any combination of discovered devices, Access groups, and clusters
Graphs for typical areas of concern and interest, such as cross-geographical comparisons or top 10 issues
Tabular data to support the graphs
Granular user data
Ability in some screens to drill down from summarized data to details
You can monitor your user base by viewing the BIG-IQ Centralized Management Access user dashboard for data on specific users. The system displays which users created the most sessions, were denied the most sessions, and had the longest total session duration. The administrator can enter a specific user name to get the following details for the user:
The user login locations on a world map
The total sessions, denied sessions, and session duration
The Access denied sessions.
The top authentication failures, including AD Auth and LDAP only
The device type users used to log into the system
The reason the system terminated the session
The login history showing the success and failures over time
The most accessed applications
The most accessed URLs
The login failure attempts over time, sorted by the reason
You can monitor your applications by viewing the BIG-IQ Centralized Management Access user dashboard for data on which applications are linked to the BIG-IQ Access component. The system displays the top applications used and the application usage time. Administrators can expand the GUI for a specific application and view the following information:
The application access history
The users who use the application the most
The access history
The world map, showing where the user is access the application
You can monitor the sessions that BIG-IQ® Centralized Management denies. By using the Access Monitoring option, you can view the following information:
The history of denied sessions
The reasons why sessions were denied
The top denied users, sorted by session count
The top authentication failures
The top denied policies
The top denied sessions by country of origin
The top denied session by the virtual server
The denied sessions, sorted by the client platform
From the ACCESS GROUP/DEVICE list at upper left, select Managed Devices, or one or more of these options:
<Access group name> Select to include all devices in the Access group.
<Cluster display name> Select to include the devices in the cluster.
<Device name> Select to include the device. You can select any device from Managed Devices, <Access group name>, or <Cluster display name>.
From the TIMEFRAME menu, specify a time frame:
Select a predefined time period. These range from Last hour to Last 3 months.
Set a custom time period. Select Between, After, or Before, and click the additional fields that display the set dates and times that support your selection.
To save report data in a comma-separated values (CSV) file, click the CSV Report button.
The CSV file downloads.
From the DENIED SESSIONS/AUTH FAILURES OVER TIME chart, select or deselect Auth Failures or Denied Sessions from the top right corner of the chart to add or remove them from view.
From any of the bar charts, select one of the horizontal bars to view details such as the authentication failure categories, top 10 reasons for denied sessions, top 10 denied users, top 10 denied Access policies, top 10 virtual servers by denied sessions, and top 10 client platforms by denied sessions.
You can continue drilling down in this dashboard to customize the view depending on what information you are interested in. For example, if you wanted to view details about LDAP failures associated with a particular Access policy, click the bar by the Access policy you are interested in under the chart TOP 10 DENIED POLICIES, then on the next screen, select the bar by LDAP Failure under the TOP 10 DENIED REASONS chart. The customized dashboard will display all LDAP failures that resulted in denied sessions and originated from a single Access policy.
To exit out of the nested view or to move up one level, select the blue links at the top with the dashboard you would like to navigate to.
From here, you can view details regarding denied sessions and create a report.
Before BIG-IQ can display Access report data for a managed BIG-IP device, you must first complete the following tasks:
Add the managed BIG-IP device to the BIG-IQ Centralized Management inventory
Discover and import the managed BIG-IP device
Have a BIG-IQ user enable Access remote logging configuration on the managed BIG-IP device
To discover and import a configuration and deploy configurations to a managed BIG-IP device, users must belong to one of the following RBAC roles:
Admin
Access Manager
Access Deployer
Only BIG-IQ users managing BIG-IP devices with OAuth provisioned can provide data for OAuth reports.
You can create OAuth reports for Access groups, clusters (in Access groups), or devices that you select from the Access groups and clusters (in Access groups) on the BIG-IQ Centralized Management system.
A Summary report (for all devices and a default timeframe) starts to generate and display.
From the left, select any report that you want to run.
From the ACCESS GROUP/DEVICE list at upper left, select Managed Devices or select one or more of these options:
<Access group name> Select to include all devices in the Access group.
<Cluster display name> Select to include the devices in the cluster.
<Device name> Select to include the device. You can select any device from Managed Devices, <Access group name>, or <Cluster display name>.
From the TIMEFRAME menu, specify a time frame:
Select a predefined time period. These range from Last hour to Last 3 months.
Set a custom time period. Select Between, After, or Before, and click the additional fields that display the set dates and times that support your selection.
To save report data in a comma-separated values (CSV) file, click the CSV Report button.
Before BIG-IQ can display Access report data for a managed BIG-IP device, you must first complete the following tasks:
Add the managed BIG-IP device to the BIG-IQ Centralized Management inventory
Discover and import the managed BIG-IP device
Have a BIG-IQ user enable Access remote logging configuration on the managed BIG-IP device
To discover and import a configuration and deploy configurations to a managed BIG-IP device, users must belong to one of the following RBAC roles:
Admin
Access Manager
Access Deployer
Only BIG-IQ users managing BIG-IP devices with OAuth provisioned can provide data for OAuth reports.
The Authentication Server Summary screen shows several charts that you can use to track the health of your authorization server role. Controls on this screen work together so you can fine-tune the statistics display.
Click Monitoring > DASHBOARDS > Access > Federation > OAuth > Authorization Server > Server Performance.
BIG-IQ opens the Authorization Server Performance screen.
At the top left of the screen, from the ACCESS GROUP/DEVICES list, either select one of the first two options (All Devices and All Managed Devices) or select one or more of the other options (<Access group name>, <Cluster display name>, or <Device name>).
All Managed Devices Includes all Access devices that are currently discovered.
<Access group name> Select to include all devices in the Access group.
<Cluster display name> Select to include the devices in the cluster.
<Device name> Select to include the device. You can select any device from Managed Devices, <Access group name>, or <Cluster display name>.
From the TIMEFRAME menu, specify a time frame:
Select a predefined time period. These range from Last hour to Last 3 months.
Set a custom time period. Select Between, After, or Before, and click the additional fields that display the set dates and times that support your selection.
From the AUTHORIZATION SERVER list, select an OAuth authorization server.
To save report data in a comma-separated values (CSV) file, click the CSV Report button.
The CSV file downloads.
To refresh the data on this dashboard immediately, click Refresh. To configure an automatic refresh, click the arrow next to it and then select 1 minute, 5 minutes, or 10 minutes. You can also Disable automatic refresh from this menu.
To view data for a different OAuth resource, make a selection from the Resource dropdown.
For the line charts on this dashboard, select any of the metrics in order to remove or add each metric to the chart and view a customized data set.
Before BIG-IQ can display Access report data for a managed BIG-IP device, you must first complete the following tasks:
Add the managed BIG-IP device to the BIG-IQ Centralized Management inventory
Discover and import the managed BIG-IP device
Have a BIG-IQ user enable Access remote logging configuration on the managed BIG-IP device
To discover and import a configuration and deploy configurations to a managed BIG-IP device, users must belong to one of the following RBAC roles:
Admin
Access Manager
Access Deployer
Only BIG-IQ users managing BIG-IP devices with OAuth provisioned can provide data for OAuth reports.
The Token Summary screen shows several charts that you can use to track the health of your OAuth tokens. Data appears when you configure statistics collection. Controls on this screen work together so you can fine-tune the statistics display.
At the top left of the screen, from the ACCESS GROUP/DEVICES list, either select one of the first two options (All Devices and All Managed Devices) or select one or more of the other options (<Access group name>, <Cluster display name>, or <Device name>).
All Managed Devices Includes all Access devices that are currently discovered.
<Access group name> Select to include all devices in the Access group.
<Cluster display name> Select to include the devices in the cluster.
<Device name> Select to include the device. You can select any device from Managed Devices, <Access group name>, or <Cluster display name>.
From the TIMEFRAME menu, specify a time frame:
Select a predefined time period. These range from Last hour to Last 3 months.
Set a custom time period. Select Between, After, or Before, and click the additional fields that display the set dates and times that support your selection.
From the AUTHORIZATION SERVER list, select an OAuth authorization server.
From the GRANT TYPE list, select an OAuth grant type.
To save report data in a comma-separated values (CSV) file, click the CSV Report button.
The CSV file downloads.
To refresh the data on this dashboard immediately, click Refresh. To configure an automatic refresh, click the arrow next to it and then select 1 minute, 5 minutes, or 10 minutes. You can also Disable automatic refresh from this menu.
To learn more details for the categories across the top of the page, select Total Access Tokens, Total Refresh Errors, Revoked Tokens, Expired Access Tokens, or Expired Refresh Tokens. BIG-IQ displays a screen with additional metrics for the selected category.
Note: For example, if you are interested in viewing all expired access tokens resulting clients using Windows, select Expired Access Tokens then view the data for Windows under the chart titled PLATFORM DISTRIBUTION.
To exit the nested view or to move up one level, select the breadcrumbs links at the top of the dashboard you want to navigate to.
To filter the list of tokens, select an option from the TOKEN FILTER dropdown menu. Select one of the following: Access Tokens Issued, Access Tokens Expired, Refresh Tokens Issued, or Refresh Tokens Expired.
To revoke an OAuth token, use the list of OAuth tokens on the main Token Summary dashboard or drill down one level into any of the fields on the dashboard. At the bottom of the screen, select the checkbox next to the OAuth tokens you wish to revoke.
Select Revoke Selected Tokens, and then select OK.
Before BIG-IQ can display Access report data for a managed BIG-IP device, you must first complete the following tasks:
Add the managed BIG-IP device to the BIG-IQ Centralized Management inventory
Discover and import the managed BIG-IP device
Have a BIG-IQ user enable Access remote logging configuration on the managed BIG-IP device
To discover and import a configuration and deploy configurations to a managed BIG-IP device, users must belong to one of the following RBAC roles:
Admin
Access Manager
Access Deployer
Only a device with SAML provisioned on it can provide data for SAML reports.
You can create SAML reports for Access groups, clusters (in Access groups), or devices that you select from the Access groups and clusters (in Access groups) on the BIG-IQ Centralized Management system.
A Summary report (for all devices and a default timeframe) opens, displaying chart data for assertions over time, the top SPs or IdPs with successful assertions, the top client IP addresses, the top subject values with successful assertions, and the top SP or IdPs with failed assertions.
From the ACCESS GROUP/DEVICE list at upper left, select All Managed Devices or or one of the session-specific options.
From the TIMEFRAME menu, specify a time frame:
Select a predefined time period. These range from Last hour to Last 3 months.
Set a custom time period. Select Between, After, or Before, and click the additional fields that display the set dates and times that support your selection.
From the SP list, select a service provider.
To save report data in a comma-separated values (CSV) file, click the CSV Report button.
The CSV file downloads.
To view the successful SP assertions, click Assertions Success.
The Successful Assertions screen opens, displaying data and statistics for the top 10 client IP’s, platform distribution, geolocation distribution, subject values and SPs with successful assertions.
To view the failed SP assertions, click Assertions Failed.
The Failed Assertions screen opens, displaying data and statistics for the top 10 client IP’s, platform distribution, geolocation distribution, subject values and SPs with failed assertions.
Before BIG-IQ can display Access report data for a managed BIG-IP device, you must first complete the following tasks:
Add the managed BIG-IP device to the BIG-IQ Centralized Management inventory
Discover and import the managed BIG-IP device
Have a BIG-IQ user enable Access remote logging configuration on the managed BIG-IP device
To discover and import a configuration and deploy configurations to a managed BIG-IP device, users must belong to one of the following RBAC roles:
Admin
Access Manager
Access Deployer
Only a BIG-IP device with SAML provisioned on it can provide data for SAML reports.
The SP Assertions screen shows several charts that you can use to track the health of your SAML SP assertions. Controls on this screen work together so you can fine-tune the statistics display.
The SP Assertions screen opens, displaying a table with assertion information.
At the top left of the screen, from the ACCESS GROUP/DEVICES list, either select one of the first two options (All Devices and All Managed Devices) or select one or more of the other options (<Access group name>, <Cluster display name>, or <Device name>).
All Managed Devices Includes all Access devices that are currently discovered.
<Access group name> Select to include all devices in the Access group.
<Cluster display name> Select to include the devices in the cluster.
<Device name> Select to include the device. You can select any device from Managed Devices, <Access group name>, or <Cluster display name>.
From the TIMEFRAME menu, specify a time frame:
Select a predefined time period. These range from Last hour to Last 3 months.
Set a custom time period. Select Between, After, or Before, and click the additional fields that display the set dates and times that support your selection.
To view data for a specific SAML service provider, select one from the SP dropdown list.
View the list of SP assertions in the table.
To save report data in a comma-separated values (CSV) file, click the CSV Report button.
The CSV file downloads.
To refresh the data on this dashboard immediately, click Refresh. To configure an automatic refresh, click the arrow next to it and then select 1 minute, 5 minutes, or 10 minutes. You can also Disable automatic refresh from this menu.
To view details for a specific session, click the ID under the Session ID column.
Before BIG-IQ can display Access report data for a managed BIG-IP device, you must first complete the following tasks:
Add the managed BIG-IP device to the BIG-IQ Centralized Management inventory
Discover and import the managed BIG-IP device
Have a BIG-IQ user enable Access remote logging configuration on the managed BIG-IP device
To discover and import a configuration and deploy configurations to a managed BIG-IP device, users must belong to one of the following RBAC roles:
Admin
Access Manager
Access Deployer
Only a BIG-IP device with SAML provisioned on it can provide data for SAML reports.
The SP Errors screen shows several charts that you can use to track the health of your SAML SP errors. Controls on this screen work together so you can fine-tune the statistics display.
The SP Error Reports screen opens, displaying the error logs.
At the top left of the screen, from the ACCESS GROUP/DEVICES list, either select one of the first two options (All Devices and All Managed Devices) or select one or more of the other options (<Access group name>, <Cluster display name>, or <Device name>).
All Managed Devices Includes all Access devices that are currently discovered.
<Access group name> Select to include all devices in the Access group.
<Cluster display name> Select to include the devices in the cluster.
<Device name> Select to include the device. You can select any device from Managed Devices, <Access group name>, or <Cluster display name>.
From the TIMEFRAME menu, specify a time frame:
Select a predefined time period. These range from Last hour to Last 3 months.
Set a custom time period. Select Between, After, or Before, and click the additional fields that display the set dates and times that support your selection.
To view data for a specific SAML service provider, select one from the SP dropdown list.
View the list of service provider errors in the table on the dashboard.
To save report data in a comma-separated values (CSV) file, click the CSV Report button.
The CSV file downloads.
To refresh the data on this dashboard immediately, click Refresh. To configure an automatic refresh, click the arrow next to it and then select 1 minute, 5 minutes, or 10 minutes. You can also Disable automatic refresh from this menu.
View the list of service provider errors in the table on the dashboard.
To view details for a specific session, click the ID under the Session ID column.
Before BIG-IQ can display Access report data for a managed BIG-IP device, you must first complete the following tasks:
Add the managed BIG-IP device to the BIG-IQ Centralized Management inventory
Discover and import the managed BIG-IP device
Have a BIG-IQ user enable Access remote logging configuration on the managed BIG-IP device
To discover and import a configuration and deploy configurations to a managed BIG-IP device, users must belong to one of the following RBAC roles:
Admin
Access Manager
Access Deployer
Only a managed BIG-IP device with SAML provisioned on it can provide data for SAML reports.
The IdP Assertions screen shows several charts that you can use to track the health of your SAML IdP assertions. Controls on this screen work together so you can fine-tune the statistics display.
The IdP Assertions screen opens, displaying a table with assertion information.
At the top left of the screen, from the ACCESS GROUP/DEVICES list, either select one of the first two options (All Devices and All Managed Devices) or select one or more of the other options (<Access group name>, <Cluster display name>, or <Device name>).
All Managed Devices Includes all Access devices that are currently discovered.
<Access group name> Select to include all devices in the Access group.
<Cluster display name> Select to include the devices in the cluster.
<Device name> Select to include the device. You can select any device from Managed Devices, <Access group name>, or <Cluster display name>.
From the TIMEFRAME menu, specify a time frame:
Select a predefined time period. These range from Last hour to Last 3 months.
Set a custom time period. Select Between, After, or Before, and click the additional fields that display the set dates and times that support your selection.
From the IdP dropdown menu, select one SAML identity provider to view a report for that resource.
To save report data in a comma-separated values (CSV) file, click the CSV Report button.
The CSV file downloads.
To refresh the data on this dashboard immediately, click Refresh. To configure an automatic refresh, click the arrow next to it and then select 1 minute, 5 minutes, or 10 minutes. You can also Disable automatic refresh from this menu.
View a list of IdP assertions in the dashboard for the selected SAML identity provider.
To view details for a specific session, click the ID under the Session ID column.
Before BIG-IQ can display Access report data for a managed BIG-IP device, you must first complete the following tasks:
Add the managed BIG-IP device to the BIG-IQ Centralized Management inventory
Discover and import the managed BIG-IP device
Have a BIG-IQ user enable Access remote logging configuration on the managed BIG-IP device
To discover and import a configuration and deploy configurations to a managed BIG-IP device, users must belong to one of the following RBAC roles:
Admin
Access Manager
Access Deployer
Only a managed BIG-IP device with SAML provisioned on it can provide data for SAML reports.
The IdP Errors screen shows several charts that you can use to track the health of your SAML IdP errors. Controls on this screen work together so you can fine-tune the statistics display.
The IdP Errors screen opens, displaying a table with reported errors.
At the top left of the screen, from the ACCESS GROUP/DEVICES list, either select one of the first two options (All Devices and All Managed Devices) or select one or more of the other options (<Access group name>, <Cluster display name>, or <Device name>).
All Managed Devices Includes all Access devices that are currently discovered.
<Access group name> Select to include all devices in the Access group.
<Cluster display name> Select to include the devices in the cluster.
<Device name> Select to include the device. You can select any device from Managed Devices, <Access group name>, or <Cluster display name>.
From the TIMEFRAME menu, specify a time frame:
Select a predefined time period. These range from Last hour to Last 3 months.
Set a custom time period. Select Between, After, or Before, and click the additional fields that display the set dates and times that support your selection.
From the IdP dropdown menu, select one SAML identity provider to view a report for that resource.
View a list of IdP errors in this dashboard.
To save report data in a comma-separated values (CSV) file, click the CSV Report button.
The CSV file downloads.
To refresh the data on this dashboard immediately, click Refresh. To configure an automatic refresh, click the arrow next to it and then select 1 minute, 5 minutes, or 10 minutes. You can also Disable automatic refresh from this menu.
To view details for a specific session, click the ID under the Session ID column.
BIG-IQ Centralized Management offers advanced monitoring and troubleshooting capabilities for connectivity and VPN use cases. You may use the remote access monitoring functionality to gain visibility into the behavior of VPN traffic, as well as to view the log of errors associated with failed connections. With remote access monitoring, you can maintain a high-level visibility for network access requests and session data for all users accessing the network through Access policies.
View data for Network Access usage summary. From this report, you can:
Generate a report with a different scope by making a selection from the ACCESS GROUP/DEVICE or the TIMEFRAME field, or both
Generate reports for any devices regardless of Access group membership, cluster membership, or geographical location. Select All Devices from the ACCESS GROUP/DEVICE list and select the devices that interest you.
Adjust the time slider across the top of the screen to indicate the time window for which statistics are displayed. This control sets the chart pane focus to a specific window of time within the currently selected time period. Use the sliders at either end of this control to define the window you want to examine. If you adjust the right side of the control, the auto refresh stops, effectively freezing the display so you can focus on a particular data point.
Select CSV Report to download a CSV file of this data to your local machine.
Refresh this page by clicking Refresh or set up automatic refresh by selecting the arrow next to the Refresh button and selecting how often you would like to refresh the data. You can pick from 1, 5, or 10 minutes.
Displays the total number of users actively connected to a session. Click Active Users to open the Active Users screen, which displays charts describing the top 1,000 users and the top 1,000 locations.
Active Connections
Displays the total active connections. Click Active Connections to open the Active Connections screen, which displays charts describing the top 1,000 users and the top 1,000 locations.
Total Sessions
Displays the total number of sessions established.
Total Reconnects
Displays the number of times users tried to reestablish a session. Click Total Reconnects to open the Total Reconnects screen, which displays charts describing reconnects.
Network Access Session Errors
Displays the total number of errors that occurred during network access sessions. Click Network Access Session Errors to open the Connectivity Errors screen, which displays a list of connectivity errors. Click Session ID to display detailed session details and session variable information.
Displays a chart of the network access reconnects over time.
TOP 10 USERS BY RECONNECTS
Displays the top ten users with the most reconnects. Select a user from the bar chart to display detailed information about the user.
RECONNECTS GEO DISTRIBUTION
Displays the geographical locations from which the reconnects originate. Click the locations on the map to display detailed information about the country from which the reconnect originated.
CLIENTS IPS BY RECONNECTS
Displays the IP address of the client devices from which the reconnects originate. Select a client from the bar chart to display the types of client operating systems.
Each chart displays a title that identifies the statistic plotted on that chart.
NETWORK ACCESS SESSIONS OVER TIME
Displays the network access sessions over time.
TOP 10 USERS BY SESSIONS
Displays the users with the most sessions and the number of sessions per user. Select a user from the list to display detailed session information for that user.
TOP 10 USERS BY RECONNECTS
Displays the users with the most reconnects and the number of reconnects per user. Select a user from the list to display detailed reconnect information for that user.
SESSIONS GEO DISTRIBUTION
Displays the geographical locations from which the sessions originate. Click the locations on the map to display detailed information about the country from which the session originated.
TUNNEL TYPES BY SESSIONS
Displays the types of tunnels used by all sessions and the number of tunnels used. Click the ring chart to display detailed information about the tunnel types.
TOP 10 CLIENTS IPS BY SESSIONS
Displays the IP addresses of the top client systems from which the sessions originate and the number of sessions per client. Select a client from the bar chart to display detailed session information for that client.
CLIENT OS BY SESSIONS
Displays the top operating systems used by the client devices and the number of operating systems. Click the ring chart to display detailed information about the client device.
Each chart displays a title that identifies the statistic plotted on that chart.
NETWORK ACCESS CONNECTIONS OVER TIME
Displays the network access connections over time.
TOP 10 USERS BY CONNECTIONS
Displays the users with the most connections and the number of connections per user. Select a user from the list to display detailed connections information for that user.
TOP 10 USERS BY RECONNECTS
Displays the users with the most reconnects and the number of reconnects per user. Select a user from the list to display detailed reconnect information for that user.
CONNECTIONS GEO DISTRIBUTION
Displays the geographical locations from which the connections originate. Click the locations on the map to display detailed information about the country from which the connection originated.
TUNNEL TYPES BY CONNECTIONS
Displays the types of tunnels used by all connections and the number of tunnels used. Click the pie chart to display detailed information about the tunnel types.
TOP 10 CLIENTS IPS BY CONNECTIONS
Displays the IP addresses of the top client systems from which the connections originate and the number of connections per client. Select a client from the bar chart to display detailed connection information for that client.
CLIENT OS BY CONNECTIONS
Displays the top operating systems used by the client devices and the number of operating systems. Click the ring chart to display detailed information about the client device.
Each chart displays a title that identifies the statistic plotted on that chart.
NETWORK ACCESS BYTES TRANSFERRED OVER TIME
Displays the bytes transferred over time in the network access.
TOP 10 USERS BY BYTES TRANSFERRED
Displays the users with the most bytes transferred and the size of the transfers. Select a user from the list to display detailed information for that user.
BYTES TRANSFERRED GEO DISTRIBUTION
Displays the geographical locations from which the bytes originate. Click the locations on the map to display detailed information about the country from which the bytes originated.
TOP 10 CLIENTS IPS BY BYTES TRANSFERRED
Displays the IP addresses of the top client systems that transferred bytes of information and the size of the transfers. Select a client from the bar chart to display detailed bytes transferred information for that client.
CLIENT OS BY BYTES TRANSFERRED
Displays the top operating systems used by the client devices and the number of operating systems. Click the ring chart to display detailed information about the client device.
BIG-IQ Centralized Management allows you to monitor and troubleshoot network access requests by all clients attempting to join your network. You can use the aggregated data on the following page to understand the overall success of network access requests, and to view the amount of VPN traffic at any given moment or over a period of time.
To do so, navigate to Monitoring > DASHBOARDS > Access > Remote Access > Network Access > Network Access Performance.
Within BIG-IQ, you can view data for Network Access performance. From this report, you may:
Generate a report with a different scope by making a selection from the ACCESS GROUP/DEVICE or the TIMEFRAME field, or both.
Generate reports for any devices regardless of Access group membership, cluster membership, or geographic location. Select All Devices from the ACCESS GROUP/DEVICE list and select the devices that interest you.
Adjust the time slider across the top of the screen to indicate the time window for which statistics are displayed. This control sets the chart pane focus to a specific window of time within the currently selected time period. Use the sliders at either end of this control to define the window you want to examine. You can adjust each end of the control. If you adjust the right side of the control, the auto refresh stops, effectively freezing the display so you can focus on a particular data point.
Select CSV Report to download a CSV file of this data to your local machine.
Refresh this page by clicking Refresh or set up automatic refresh by selecting the arrow next to the Refresh button and selecting how often you would like to refresh the data. You can pick from 1, 5, or 10 minutes.
From BIQ-IQ, you may view a report of all of the reconnections to your network through your VPN. You may use this page to troubleshoot connectivity issues with your VPN or to determine if a connectivity issue lies on the client-side.
To do this, view a report for Network Access reconnections. Access this page at Monitoring > DASHBOARDS > Remote Access > Network Access > Network Access Recconnect Detail.From this page, you can:
Generate a report with a different scope by making a selection from the ACCESS GROUP/DEVICE or the TIMEFRAME field, or both
Generate reports for any devices regardless of Access group membership, cluster membership, or geographical location. Select All Devices from the ACCESS GROUP/DEVICE list and select the devices that interest you.
Adjust the time slider across the top of the screen to indicate the time window for which statistics are displayed. This control sets the chart pane focus to a specific window of time within the currently selected time period. Use the sliders at either end of this control to define the window you want to examine.If you adjust the right side of the control, the auto refresh stops, effectively freezing the display so you can focus on a particular data point.
Select CSV Report to download a CSV file of this data to your local machine.
Refresh this page by clicking Refresh or set up automatic refresh by selecting the arrow next to the Refresh button and selecting how often you would like to refresh the data. You can pick from 1, 5, or 10 minutes.
Add or remove the Client Application field by clicking the settings icon on the right and selecting or deselecting Client Application report.
You may use BIG-IQ Centralized Management to log all error messages received for every failed network access request in order to facilitate troubleshooting efforts for an end-user or to understand trends with connectivity issues and come to a resolution. To do so, navigate to Monitoring > DASHBOARDS > Access > Remote Access > Network Access > Network Access Errors
View all details for Network Access errors. From this page, you can:
Generate a report with a different scope by making a selection from the ACCESS GROUP/DEVICE or the TIMEFRAME field, or both.
Generate reports for any devices regardless of Access group membership, cluster membership, or geographical location. Select All Devices from the ACCESS GROUP/DEVICE list and select the devices that interest you.
Adjust the time slider across the top of the screen to indicate the time window for which statistics are displayed. This control sets the chart pane focus to a specific window of time within the currently selected time period. Use the sliders at either end of this control to define the window you want to examine. If you adjust the right side of the control, the auto refresh stops, effectively freezing the display so you can focus on a particular data point.
Select CSV Report to download a CSV file of this data to your local machine.
Refresh this page by clicking Refresh or set up automatic refresh by selecting the arrow next to the Refresh button and selecting how often you would like to refresh the data. You can pick from 1, 5, or 10 minutes.
BIG-IQ provides you with the ability to monitor the frequency of network access requests, as well as to drill-down on the data for all of these requests. You may request reports on traffic throughput for a specific user, and you may track the geographical location of all of the network access requests in order to prevent and spot session takeover or unauthorized network access. To do so, navigate to Monitoring > DASHBOARDS > Access > Remote Access > Network Access > Network Access Usage.
From this page, you can:
Generate a report with a different scope by making a selection from the ACCESS GROUP/DEVICE or the TIMEFRAME field, or both
Generate reports for any devices regardless of Access group membership, cluster membership, or geographical location. Select All Devices from the ACCESS GROUP/DEVICE list and select the devices that interest you.
Adjust the time slider across the top of the screen to indicate the time window for which statistics are displayed. This control sets the chart pane focus to a specific window of time within the currently selected time period. Use the sliders at either end of this control to define the window you want to examine. If you adjust the right side of the control, the auto refresh stops, effectively freezing the display so you can focus on a particular data point.
Select CSV Report to download a CSV file of this data to your local machine.
Refresh this page by clicking Refresh or set up automatic refresh by selecting the arrow next to the Refresh button and selecting how often you would like to refresh the data. You can pick from 1, 5, or 10 minutes.
Displays the total number of network access connections.
Total Bytes In
Displays the total number of bytes received by the network access.
Total Bytes Out
Displays the total number of bytes sent out by the network access.
Total Bytes Transferred
Displays the total number of sent and received bytes.
Total Bytes Transferred
Displays the total number of sent and received bytes.
Total Duration
Displays the total duration when the network access connections for a user were active. When the user has multiple active connections at the same time, the total duration is the sum of the duration of those two connections.
Distinct Locations
Displays the number of unique locations from where the network access usage originates.
View network access usage for the top 1000 locations:
Country
Displays the countries from where the network access usage originates.
State
Displays the states in the countries from where the network access usage originates.
Total Connections
Displays the total number of network access connections.
Total Bytes In
Displays the total number of bytes received by the network access.
Total Bytes Out
Displays the total number of bytes sent out by the network access.
Total Bytes Transferred
Displays the total number of sent and received bytes.
Total Duration
Displays the total duration when the network access connections for a user were active. When the user has multiple active connections at the same time, the total duration is the sum of the duration of those two connections.
Note: The date filter is applied on the connection start time. If you select a date range that starts after the network access connection was established, BIG-IQ does not display the connection record because date range selected does not include connection state time.
BIG-IQ allows you to separately monitor portal access network traffic and network access requests that stem from BIG-IP Edge Client. To monitor data on portal access requests and to receive reports on this data, navigate to Monitoring > DASHBOARDS > Access > Remote Access > Portal Access.
View data for Portal Access sessions. From this report, you can:
Generate a report with a different scope by making a selection from the ACCESS GROUP/DEVICE or the TIMEFRAME field, or both
Generate reports for any devices regardless of Access group membership, cluster membership, or geographical location. Select All Devices from the ACCESS GROUP/DEVICE list and select the devices that interest you.
View the number of client requests, cache hits, and cache misses over time in the Portal Access chart.
Adjust the time slider across the top of the screen to indicate the time window for which statistics are displayed. This control sets the chart pane focus to a specific window of time within the currently selected time period. Use the sliders at either end of this control to define the window you want to examine. If you adjust the right side of the control, the auto refresh stops, effectively freezing the display so you can focus on a particular data point.
Select CSV Report to download a CSV file of this data to your local machine.
Refresh this page by clicking Refresh or set up automatic refresh by selecting the arrow next to the Refresh button and selecting how often you would like to refresh the data. You can pick from 1, 5, or 10 minutes.
You may use BIG-IQ to collect data on virtual desktop sessions in order to troubleshoot connectivity issues and view trends over time or for a certain time period. To do so, navigate to Monitoring > DASHBOARDS > Access > Remote Access > VDI Summary.
From this report, you can:
Generate reports with a different scope by making a selection from the ACCESS GROUP/DEVICE or the TIMEFRAME field, or both
Generate reports for any devices regardless of Access group membership, cluster membership, or geographical location. Select All Devices from the ACCESS GROUP/DEVICE list and select the devices that interest you.
View the number of client requests, cache hits, and cache misses over time in the Portal Access chart.
Adjust the time slider across the top of the screen to indicate the time window for which statistics are displayed. This control sets the chart pane focus to a specific window of time within the currently selected time period. Use the sliders at either end of this control to define the window you want to examine. If you adjust the right side of the control, the auto refresh stops, effectively freezing the display so you can focus on a particular data point.
Select CSV Report to download a CSV file of this data to your local machine.
Refresh this page by clicking Refresh or set up automatic refresh by selecting the arrow next to the Refresh button and selecting how often you would like to refresh the data. You can pick from 1, 5, or 10 minutes.
Before BIG-IQ can display Access report data for a managed BIG-IP device, you must first complete the following tasks:
Add the managed BIG-IP device to the BIG-IQ Centralized Management inventory
Discover and import the managed BIG-IP device
Have a BIG-IQ user enable Access remote logging configuration on the managed BIG-IP device
To discover and import a configuration and deploy configurations to a managed BIG-IP device, users must belong to one of the following RBAC roles:
Admin
Access Manager
Access Deployer
You can create session reports for any managed BIG-IP device with an APM configuration that has been discovered on the BIG-IQ system, whether or not the device is a member of an Access group. To create a report, you can select any combination of Access groups, clusters, and devices.
At the top left of the screen, from the ACCESS GROUP/DEVICES list, either select one of the first two options (All Devices and All Managed Devices) or select one or more of the other options (<Access group name>, <Cluster display name>, and <Device name>).
All Devices Includes Access devices that are currently managed, and Access devices that were managed at one time but are not managed now. (A managed device is one that has been discovered with the APM service configuration.)
All Managed Devices Includes all Access devices that are currently discovered.
<Access group name> - Select to include all devices in the Access group.
<Cluster display name> - Select to include the devices in the cluster.
<Device name> - Select to include the device. You can select any device from Managed Devices, <Access group name>, or <Cluster display name>.
From the TIMEFRAME menu, specify a time frame:
Select a predefined time period. These range from Last hour to Last 3 months.
Set a custom time period. Select Between, After, or Before, and click the additional fields that display the set dates and times that support your selection.
To save report data in a comma-separated values (CSV) file, click the CSV Report button.
The CSV file downloads.
To refresh the data on this dashboard immediately, click Refresh. To configure an automatic refresh, click the arrow next to it and then select 1 minute, 5 minutes, or 10 minutes. You can also Disable automatic refresh from this menu.
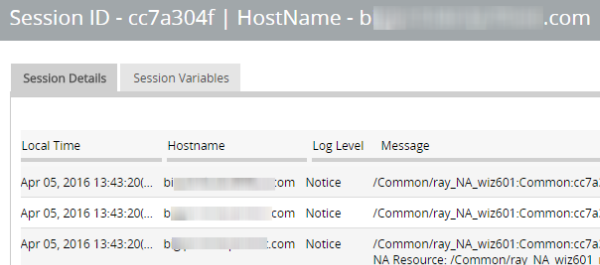
To view details for a specific session, click the ID under the Session ID column.
Use the Log Levels menu to sort by message severity. Selecting Emergency will show only the most severe warnings, and selecting Debug will display the lowest severity messages.
Before BIG-IQ can display Access report data for a managed BIG-IP device, you must first complete the following tasks:
Add the managed BIG-IP device to the BIG-IQ Centralized Management inventory
Discover and import the managed BIG-IP device
Have a BIG-IQ user enable Access remote logging configuration on the managed BIG-IP device
To discover and import a configuration and deploy configurations to a managed BIG-IP device, users must belong to one of the following RBAC roles:
Admin
Access Manager
Access Deployer
Only a device with SWG provisioned on it can provide data for Secure Web Gateway reports.
You can create SWG reports for Access groups, clusters (in Access groups), or devices that you select from the Access groups and clusters (in Access groups) on the BIG-IQ system.
Monitoring > DASHBOARDS > Access > Secure Web Gateway > Secure Web Gateway Summary.
A Summary report (for all devices and a default timeframe) starts to generate and display.
From the left, select any report that you want to run.
From the ACCESS GROUP/DEVICE list at upper left, select Managed Devices or select one or more of these options:
<Access group name> Select to include all devices in the Access group.
<Cluster display name> Select to include the devices in the cluster.
<Device name> Select to include the device. You can select any device from Managed Devices, <Access group name>, or <Cluster display name>.
From the TIMEFRAME menu, specify a time frame:
Select a predefined time period. These range from Last hour to Last 3 months.
Set a custom time period. Select Between, After, or Before, and click the additional fields that display the set dates and times that support your selection.
To save report data in a comma-separated values (CSV) file, click the CSV Report button.
From the ACCESS GROUP/DEVICE list at upper left, select Managed Devices, or one or more of these options:
<Access group name> Select to include all devices in the Access group.
<Cluster display name> Select to include the devices in the cluster.
<Device name> Select to include the device. You can select any device from Managed Devices, <Access group name>, or <Cluster display name>.
From the TIMEFRAME menu, specify a time frame:
Select a predefined time period. These range from Last hour to Last 3 months.
Set a custom time period. Select Between, After, or Before, and click the additional fields that display the set dates and times that support your selection.
To save report data in a comma-separated values (CSV) file, click the CSV Report button.
The CSV file downloads.
From the DENIED SESSIONS/AUTH FAILURES OVER TIME chart, select or deselect Auth Failures or Denied Sessions from the top right corner of the chart to add or remove them from view.
From any of the bar charts, select one of the horizontal bars to view details such as the authentication failure categories, top 10 reasons for denied sessions, top 10 denied users, top 10 denied Access policies, top 10 virtual servers by denied sessions, and top 10 client platforms by denied sessions.
You can continue drilling down in this dashboard to customize the view depending on what information you are interested in. For example, if you wanted to view details about LDAP failures associated with a particular Access policy, click the bar by the Access policy you are interested in under the chart TOP 10 DENIED POLICIES, then on the next screen, select the bar by LDAP Failure under the TOP 10 DENIED REASONS chart. The customized dashboard will display all LDAP failures that resulted in denied sessions and originated from a single Access policy.
To exit out of the nested view or to move up one level, select the blue links at the top with the dashboard you would like to navigate to.
From here, you can view details regarding denied sessions and create a report.
A session is over, but it continues to display in the Active sessions report.
Resolution
If a session starts when logging nodes are up and working, but terminates during a period when logging modes are unavailable, the session remains in the Active sessions report for 15 minutes. After 15 minutes, the session status is updated and the session is dropped from the report.
Problem
Active sessions are included in the Summary and Active sessions reports for a device that is no longer managed.
Resolution
Sessions were active on a device when it was removed from an Access group and became unmanaged. Sessions that were active when the device became unmanaged remain counted in All Active Sessions on the Summary screen and stay in the Active sessions report until the next session status update, which occurs every 15 minutes.
Problem
A session is over, but Session Termination and Session Duration are blank in a session report.
Resolution
If a session starts when logging nodes are up and working but terminates during a period when logging nodes are unavailable, the session termination is not recorded and the session duration cannot be calculated.
You can monitor your user base by viewing the BIG-IQ Centralized Management Access user dashboard for data on specific users. The system displays which users created the most sessions, were denied the most sessions, and had the longest total session duration. You may use the user summary dashboard to view and monitor per-session and per-request data for all end-users accessing the network through an Access Policy, or for a specific user. Use this dashboard to troubleshoot connectivity and security issues for a specific user accessing the network.
Dashboard
Functionality
TOP 10 USERS BY SESSION COUNT
Displays the the top 10 most frequent users and the number of sessions per user. Click on a user to open a new screen that displays the user summary for that specific user.
TOP 10 USERS BY DENIED SESSION COUNT
Displays the top 10 users who most frequently attempted to start a session but were denied by the BIG-IQ system.
TOP 10 USERS BY TOTAL SESSION DURATION
Displays the top 10 users with the longest total session time for the selected timeframe.
Chart
Functionality
Session Dashboard
Displays session information, including the overall number or sessions, the number of denied sessions, and the overall session duration for the timeframe selected.
Client Information Dashboard
Displays the number of unique devices that established a session, the number of unique geographical locations from where the devices logged in, and the number of unique application URLs.
Network Access Dashboard
Displays network access information, including the total number of network access sessions, the total bytes transferred, and the overall session duration.
Federation Dashboard
Displays the total number of SAML assertions and OAuth tokens.
SESSION COUNTS OVER TIME
Displays the total number of sessions over time for the selected timeframe for this user, separated by Allowed and Denied sessions.
SESSION DURATION OVER TIME
Displays the total duration of each session for this user over time for the selected timeframe, separated by Allowed and Denied sessions.
TOP 10 CLIENT IP’S
Lists the 10 most common IP addresses the client used to access the network during the given timeframe. Select any one of these IPs to drill down and learn more information.
LOGON DEVICE DISTRIBUTION
Lists the geographic distribution of each logon device.
SESSION TERMINATION REASONS
Displays the most common reasons for session termination for this user. Select a termination reason to learn more about a type of termination, such as associated access policies, logon devices, and more.
IDENTITY FAILURES
Displays the identity and Federation failures coming from Active Directory, LDAP, RADIUS, HTTP, SAML, and OIDC.
DEVICE POSTURE FAILURES
Displays the failures associated with device posture checks, including but not limited to antivirus, firewall, and HW encryption. Select a failure to learn more about that failure type.
DENIED SESSION REASONS
Lists the denied session reasons for this user and the number of denied sessions for each category. Select a reason to learn more about this type of denial.
DENIED RADIUS (MFA) FAILURES
Displays the list of RADIUS multi-factor authentication failures for this user. Click on a failure to learn more.
TOP 10 ACCESS PROFILES
Lists the top 10 access profiles for this user. Select an access profile to see more data associated with this user’s activity on this access profile.
TOP 10 VIRTUAL SERVERS
Lists the top 10 virtual server IP addresses for this user and the number of times it has been used by this client during the selected timeframe. Select an IP address to learn more acount activity on a certain virtual server.
TOP 10 CLIENT PLATFORMS
Displays the top 10 operating systems this user is accessing the network from. Click a platform to drill down and learn more about user activity on this operating system.
TOP 10 ACCESS POLICY RESULTS
Lists the top 10 access polciies associated with this user’s network access. Select an access policy to learn more about this user’s activity associated with that policy or to determine which policy you may need to troubleshoot in the Configuration tab.
TOP 10 APPLICATIONS
Lists the top 10 applications the user has accessed on the network.
TOP 10 ENDPOINT SOFTWARE PRODUCTS
View the top 10 endpoint security products used by the client to access the network.
LOGON DISTRIBUTION BY LOCATION
View the geographic distribution of user logons from this map. Use this map to determine if a user may have logged on from different geographic locations during a single session.
Kill User Sessions
View the geographic distribution of user logons from this map. Use this map to determine if a user may have logged on from different geographic locations during a single session.
You can configure the BIG-IQ system to log information about BIG-IQ and Secure Web Gateway events and send the log messages to remote high-speed log servers.
When configuring remote high-speed logging of events, it is helpful to understand the objects you need to create and why, as described here:
Object
Reason
Pool of remote log servers
Create a pool of remote log servers to which the BIG-IP system can send log messages.
Destination (unformatted)
Create a log destination of Remote High-Speed Log type that specifies a pool of remote log servers.
Destination (formatted)
If your remote log servers are the ArcSight, Splunk, or Remote Syslog type, create an additional log destination to format the logs in the required format and forward the logs to a remote high-speed log destination.
Publisher
Create a log publisher to send logs to a set of specified log destinations.
Log Setting
Add event logging for the APM system and configure log levels for it or add logging for URL filter events, or both. Settings include the specification of up to two log publishers: one for access system logging and one for URL request logging.
Access profile
Add log settings to the access profile. The log settings for the access profile control logging for the traffic that comes through the virtual server to which the access profile is assigned.
Before creating a pool of log servers, gather the IP addresses of the servers that you want to include in the pool. Ensure that the remote log servers are configured to listen to and receive log messages from the BIG-IP system.
Create a pool of remote log servers to which the BIG-IP system can send log messages.
On the Main tab, click Local Traffic > Pools.
The Pool List screen opens.
Click Create.
The New Pool screen opens.
In the Name field, type a unique name for the pool.
Using the New Members setting, add the IP address for each remote logging server that you want to include in the pool:
Type an IP address in the Address field, or select a node address from the Node List.
Type a service number in the Service Port field, or select a service name from the list.
Note: Typical remote logging servers require port 514.
Before you can create a new log destination, you must have configured a remote log server to send the logs to.
Use this screen to create a new log destination for a managed device.
Create a log destination to specify that log messages are sent to a remote log server.
At the top of the screen, click Configuration, then, on the left, click LOCAL TRAFFIC > Logs > Log Destinations.
The Log Destinations screen displays a list of the log destinations that are defined on this device.
To create a new log destination, click Create.
The New Log destination screen opens so you can define the settings you want for this destination.
In the Name field, type in a name for the log destination you are creating.
For Type, select the kind of destination you are creating.
Depending on the selection you make, additional controls are displayed.
Specify the additional settings needed to suit the requirements for this log destination. The fields required to create a new log destination depend on the type you choose. BIG-IQ denotes required fields using an amber box. You can also determine whether you have completed all of the required fields by noting whether the Save & Close button is enabled.
Note: Except for the Devices and Device Specific settings, the parameters on this screen perform the same function as they do when you configure a log destination on a BIG-IP device. For details about the purpose or function of a particular setting, refer to the BIG-IP reference information on support.f5.com. From the BIG-IP Knowledge Center, select the BIG-IP LTM module and the software version you have installed; then select the appropriate guide. For example, information about the log destination parameters for BIG-IP version 13.0 is provided in the External Monitoring of BIG-IP Systems: Implementations, Version 13.0 guide.
When you create a Log Destination and select a type of IPFIX or Remote High-Speed Log, you need to specify which devices to associate this destination with. When you create a Log Destination and select a type of Management Port you can specify device specific settings or, if no device specific settings are defined, the base configuration settings are used for any device associated with this log destination.
Note: For additional detail on device-specific log destination types, refer to What is a device specific log destination? in the F5 BIG-IQ Centralized Management: Local Traffic & Network Implementations guide on support.f5.com.
If you have a lot of devices that you need to associate with this log destination and want to automate the process:
Use the steps below to specify one device and then click Save.
Associate this log destination with the log publishers that are pinned to your managed devices.
Come back and edit this log destination. A Find Relevant Devices button displays. You can use this button to let BIG-IQ assemble a list of devices. BIG-IQ finds the BIG-IP devices that this destination can be deployed to. You can use the list to create a device-specific instance of this destination for each BIG-IP.
Click Save to add the listed devices to the Device Specific list.
To specify the devices for this log destination manually:
Select the device you want this destination to use
If you are creating an IPFIX or Remote High-Speed Log destination log, select the pool that you want each device to use.
Use the
button to add additional devices to the list.
Use the
button to remove a device from the list.
Click Save to add the listed devices to the Device Specific list.
Devices you select for this log destination are added to the Device Specific list.
Note: Click on a device name in the Device Specific list to edit settings for that device. Bear in mind though that changes you make to one device do not change the settings for other devices, or for the base configuration for the log destination.
Click Save & Close.
The system creates the new log destination with the settings you specified.
Changes that you make are made only to the pending version. The pending version serves as a repository for changes you stage before deploying them to the managed device. Object settings for the pending version are not the same as the object settings on the actual BIG-IP device until they are deployed or discarded.
When you finish specifying the settings for this log destination, the next step is to evaluate and then deploy the changes to the target device. Until you deploy the changes stored in the pending version, objects on the managed device are not changed.
Before you can create a new log publisher, configure a log destination with a pool of remote log servers so you can assign it to your publisher as you create it.
Log publishers specify log destinations that BIG-IP devices can send their log messages to.
At the top of the screen, click Configuration, then, on the left, click LOCAL TRAFFIC > Logs > Log Publishers.
The screen displays a list of the Log Publishers that are defined on this device.
To create a new log publisher, click Create.
The New Log Publisher screen opens so you can define the settings you want for this publisher.
In the Name field, type in a name for the log publisher you are creating.
Select the Log Destinations for this publisher.
Select a destination type from the Available list.
The list of destinations displays only the type you selected.
Select one or more destinations from the Available list.
Move the selected destinations to the Selected list.
If you are using a formatted destination, select the destination that matches your log servers, such as Remote Syslog, Splunk, or ArcSight.
Specify the additional settings needed to suit the requirements for this log publisher.
The parameters on this screen are optional and perform the same function as they do when you configure a log publisher on a BIG-IP device.
Note: For details about the purpose or function of a particular setting, refer to the BIG-IP reference information on support.f5.com. From the BIG-IP Knowledge Center, select the BIG-IP LTM module and the software version you have installed; then select the appropriate guide. For example, information about the log publisher parameters for BIG-IP version 13.0 is provided in the External Monitoring of BIG-IP Systems: Implementations guide.
Click Save & Close.
The system creates the new log publisher with the settings you specified.
Changes that you make are made only to the pending version. The pending version serves as a repository for changes you stage before deploying them to the managed device. Object settings for the pending version are not the same as the object settings on the actual BIG-IP device until they are deployed or discarded.
When you finish specifying the settings for this log publisher, the next step is to evaluate and then deploy the changes to the target device. Until you deploy the changes stored in the pending version, objects on the managed device are not changed.
Create log settings to enable event logging for access system events or URL filtering events or both. Log settings specify how to process event logs for the traffic that passes through a virtual server with a particular access profile.
At the top of the screen, select Configuration, then on the left side of the screen, click ACCESS > Access Groups.
Click the name of an Access group.
A new screen displays the group’s properties.
Click EVENT LOGS SETTINGS > Create.
Type a name for the name for the log setting.
In the SSO Configuration Description field, type a descriptive text for the configuration.
For Access System Logs, click the check box to specify a publisher for Access system logs and log levels.
For Access Logs Publisher, select a log publisher.
For the system log types, beginning with Access Policy and ending with ADFS Proxy, from the dropdown lists, select a log level. The default is Notice.
For URL Request Logs, click the check box to select a publisher for the logs and specifies the URL requests to log based on whether the request was blocked or allowed.
For URL Request Logs Publisher, select a log publisher.
For Log Allowed Events, click the check box to log request data when a user tries to access a URL that the URL filter allows.
For Log Blocked Events, click the check box to log request data when a user tries to access a URL that the URL filter blocks.
For Log Confirmed Events, click the check box to log request data when a user confirms a request for access to a URL for which the URL filter requires confirmation.
Before BIG-IQ can display Access report data for a managed BIG-IP device, you must first complete the following tasks:
Add the managed BIG-IP device to the BIG-IQ Centralized Management inventory
Discover and import the managed BIG-IP device
Have a BIG-IQ user enable Access remote logging configuration on the managed BIG-IP device
To discover and import a configuration and deploy configurations to a managed BIG-IP device, users must belong to one of the following RBAC roles:
Admin
Access Manager
Access Deployer
From the Summary report, and from most session reports, the initial display includes graphs that summarize the report data. You can get successively more detailed information by clicking a bar or a point on a graph or clicking a link if one is displayed on the screen.
On the left, select DASHBOARDS > Access.
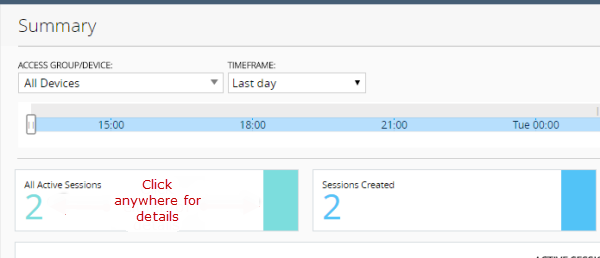
The Summary report is an example of the type of report that presents high-level data, and provides access to underlying data.
A Summary report (for all devices and a default timeframe) starts to generate and display.
Click anywhere in a summary to get more information.
Additional graphs display, and supporting data displays in a table at the bottom of the screen.
If more details are available, click the bars in the graphs to display more details.
Scroll down to the table to view the supporting data.
If the table includes a Session ID field, click the link in that field to open the session details.
To change which records display on this screen, select a log level from the LOG LEVEL list at the top of the screen.
Before BIG-IQ can display Access report data for a managed BIG-IP device, you must first complete the following tasks:
Add the managed BIG-IP device to the BIG-IQ Centralized Management inventory
Discover and import the managed BIG-IP device
Have a BIG-IQ user enable Access remote logging configuration on the managed BIG-IP device
To discover and import a configuration and deploy configurations to a managed BIG-IP device, users must belong to one of the following RBAC roles:
Admin
Access Manager
Access Deployer
You can create Access reports for any device with the APM service configuration on it that has been discovered on the BIG-IQ system, whether or not the device is a member of an Access group. To create a report, you can select any combination of Access groups, clusters, and devices.
On the left, select DASHBOARDS > Access.
A Summary report (for all devices and a default timeframe) starts to generate and display.
From the left, select any report that you want to run.
At the top left of the screen, from the ACCESS GROUP/DEVICES list, either select one of the first two options (All Devices and All Managed Devices) or, select one or more of the other options (<Access group name>, <Cluster display name>, and <Device name>).
All Devices Includes Access devices that are currently managed, and Access devices that were managed at one time but are not managed now. (A managed device is one that has been discovered with the APM service configuration.)
All Managed Devices Includes all Access devices that are currently discovered.
<Access group name> - Select to include all devices in the Access group.
<Cluster display name> - Select to include the devices in the cluster.
<Device name> - Select to include the device. You can select any device from Managed Devices, <Access group name>, or <Cluster display name>.
From the TIMEFRAME menu, specify a time frame:
Select a predefined time period. These range from Last hour to Last 3 months.
Set a custom time period. Select Between, After, or Before, and click the additional fields that display the set dates and times that support your selection.
To save report data in a comma-separated values (CSV) file, click the CSV Report button.
When you upgrade a BIG-IQ® Centralized Management system without taking a snapshot, it deletes all reporting data, including both Access and SWG reports. After upgrading, users cannot obtain these reports from the BIG-IP® devices. To prevent the loss of reports, users should take an Elasticsearch snapshot before upgrading, and restore the snapshot after upgrading. For more information on elastic snapshots, refer to F5 BIG-IQ Centralized Management: Upgrading Logging Nodes to Version x.x.
Before you can display statistics in the SWG analytics screen, you must have the following configured:
A BIG-IQ data collection device configured for the BIG-IQ device
The BIG-IP device located in your network and running a compatible software version
To view the SWG Dashboard, statistics collection on the BIG-IP device should be enabled.
Note: For BIG-IP devices running versions 13.1.0.5 or later, enabling the BIG-IP device’s statistics collection may affect the information that appears in the Secure Web Gateway Summary screen (Monitoring > DASHBOARDS > Access > Secure Web Gateway > Secure Web Gateway Summary).
For BIG-IP devices running versions 13.1.0.5, or later, you must have AVR provisioned on your BIG-IP device.
View statistics for all traffic managed with Secure Web Gateway (SWG) to ensure that your configured access profile properly secures the users within your network.
Click Monitoring > DASHBOARDS > Access > SWG.
The screen displays the SWG analytics screen. By default, the screen displays statistics from the past hour. You can adjust the time settings using the controls found at the top of the screen.
To display events that correspond with the chart timeline, click Events.
Events that occurred within the selected time period are displayed in the chart. You can select the event icons within the chart to display event details.
Expand the dimensions found at the far right of the screen to view additional data.
Filter displayed data by dimension objects:
To filter data by one or more BIG-IP devices, expand BIG-IP Host Names or BIG-IP Blade Numbers and select one or more dimension objects.
To filter data by traffic or security settings (e.g. a URL category and a corresponding action) expand the remaining dimensions and select one or more dimension objects.
Note: You can select objects from multiple dimensions. Once you select an object, only dimensions with corresponding data are displayed in the charts and dimensions
Briefly explain the outcome of having completed this task. This element is optional, but recommended.
To edit your SWG settings go to Configuration > ACCESS > Access Groups and select the Access group name. For more information about Access group configuration, refer to the BIG-IQ Centralized Management: Access on support.f5.com for configuration information.
The All Devices option for Access reports includes data from the devices that are currently managed (discovered) in the BIG-IQ system. This is in addition to data from devices that were managed at some point during the report timeframe, but that are not currently managed. With All Devices selected, if data from unmanaged devices exists, it displays in reports.
An unmanaged device might be unmanaged temporarily or permanently. Any time a configuration management change causes APM® to be undiscovered, the device and its data are moved to All Devices until APM is re-discovered on the device.
You cannot generate a report for an unmanaged device. However, you can generate a report for the timeframe when the device was managed, and then search the report for the unmanaged device name. In the Summary report, All Active Sessions includes the number of sessions that were active on the device when it became unmanaged. Those sessions stay in the Summary and in the Active sessions reports until the next session status update, which occurs every 15 minutes.
When you run an Access report or an SWG report, Access can get up to 10,000 records to display to you. After you scroll to the end of those 10,000 records, Access displays a message. At that point, all you can do is select fewer devices or select a shorter timeframe.
Logging nodes are highly available, but it is still possible for them to become unavailable. This could occur, for example, if all logging nodes are on devices in the same rack in a lab, and the power to the lab shuts down.
Before BIG-IQ can display Access report data for a managed BIG-IP device, you must first complete the following tasks:
Add the managed BIG-IP device to the BIG-IQ Centralized Management inventory
Discover and import the managed BIG-IP device
Have a BIG-IQ user enable Access remote logging configuration on the managed BIG-IP device
To discover and import a configuration and deploy configurations to a managed BIG-IP device, users must belong to one of the following RBAC roles:
Admin
Access Manager
Access Deployer
Only a device with SWG provisioned on it can provide data for SWG reports.
From the Summary report, the initial display includes graphs that summarize the report data. You can get more detailed information by clicking a bar or a point on a graph to see additional graphs and tables with supporting entries.
On the left, select DASHBOARDS > Access > Secure Web Gateway.
The Summary starts to generate and display. A timeline and some summaries display across the top of the screen. Graphs display under the summaries. Each graph provide different views of the data.
Click any bar in a graph on the display to get more information.
Additional graphs provide different views of the data, and supporting data displays in a table at the bottom of the screen.
If more details are available, click the bars in the graphs to display them.
Scroll down to the table to view the supporting data.
You can configure APM email alerts from within BIG-IQ to receive notifications when various error and license usage metrics meet either a warning or a critical threshold.
From BIG-IQ, navigate to ALERT MANAGEMENT > Alert Rules.
To create a new Alert Rule for an Access Group or a single BIG-IP device, select Add.
You may also edit the default APM alert rules by clicking on default-access-health. Doing this will change the alerts for all devices managed by this BIG-IQ.
Add a unique name and a description for this alert rule.
Select Device access-health to configure this alert rule for APM.
Select the checkbox by each of the metrics for which you would like to receive monitoring alerts.
The metrics you may receive alerts for include: Network Access Reconnects, Network Access Errors, Bad IP Reputations, Denied Sessions, SAML - IdP Errors, SAML - SP Errors, Access Usage, Connectivity Usage, and SWG Usage.
For each metric you decide to receive alerts for, set a number of occurrences at which you would like to receive a warning alert and a number of occurrences at which you would like to receive a critical alert.
Click SNMP Traps to enable alerts sent from remote SNMP-enabled devices.
To send alerts to an email inbox, select the checkbox by Email. Enter the emails to receive the alerts in the box below separated by commas.
Under Devices, select the group of devices for which you would like to configure alerts. You can select an Access Group at this point.
Select the BIG-IP devices and use the arrows to move them between the boxes.
When you have finished, click Save & Close.
Once you have finished, you will be able to receive alerts within BIG-IQ and to your email depending on your selections.
To monitor APM alerts on BIG-IQ, you must first create alert rules to establish what will constitute a warning and a critical level alert.
You may use BIG-IQ to monitor both current APM alerts and past APM alerts to determine trends with network access and connectivity issues.
To view all active alerts for APM, navigate to Applications > ALERT MANAGEMENT > Active Alerts from within BIG-IQ.
You may sort all active alerts by alert Level, Title, Start time, Type, Context, Reported Object, and Last Updated.
Sorting by Type may be particularly important when you are searching for alerts associated with the health of APM configurations.
Once APM alerts are inactive, they will move to the Alert History tab under Applications > ALERT MANAGEMENT.
From there, you can filter results by the last day and by the last two days from the dropdown menu in the top left in order to triage connection errors and other network issues for users of an APM connection.