Updated Date: 07/07/2026
Dashboard
The system dashboard displays relevant system information when you log in to the webUI.
The webUI fully supports Chrome and Firefox browsers.
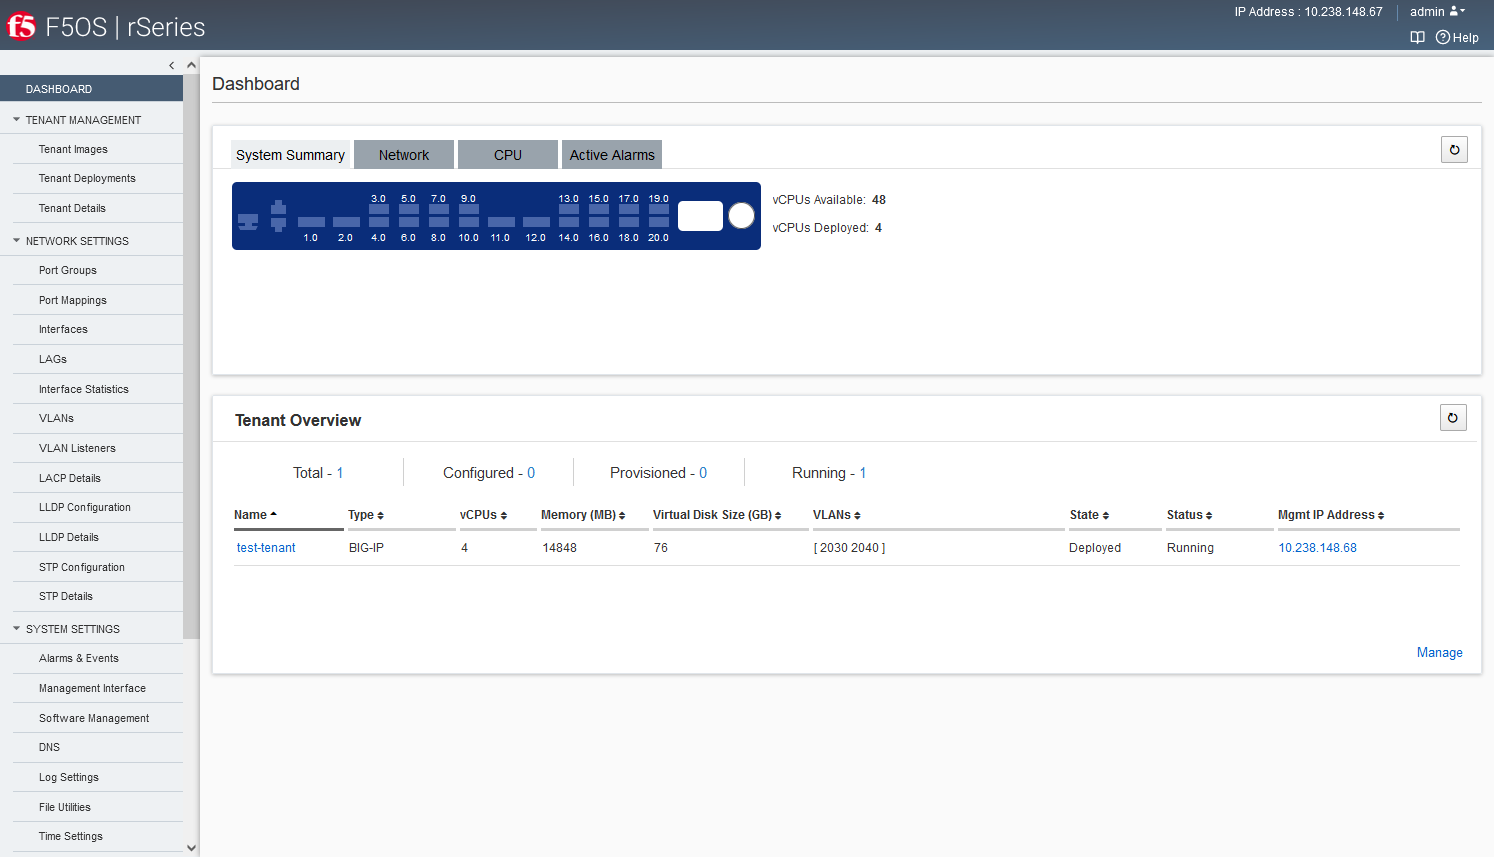
The top section of the dashboard includes these sections:
- System Summary
- Shows information about system storage, hostname, IP address, product name, software versions, available vCPUs, and deployed vCPUs.
- Network
- Shows the current state for all system interfaces (ports) and displays port mappings.
- CPU
- Shows information about CPU utilization using a color-coded chart with hover text. The system updates the data in real time. Click Tenants (All) to filter the display for all or selected tenants only.
- Active Alarms
- Shows system alerts that have occurred recently. The system updates the alarms every few seconds. It shows the source of the alert, its severity, a brief description of what occurred, and when it happened.
The lower section includes an overview of tenants deployed on the system.