Updated Date: 07/07/2026
Dashboard
The system dashboard displays relevant system information when you log in to the webUI.
F5OS webUIs fully support the latest versions of Chrome and Firefox browsers at the time of each F5OS release.
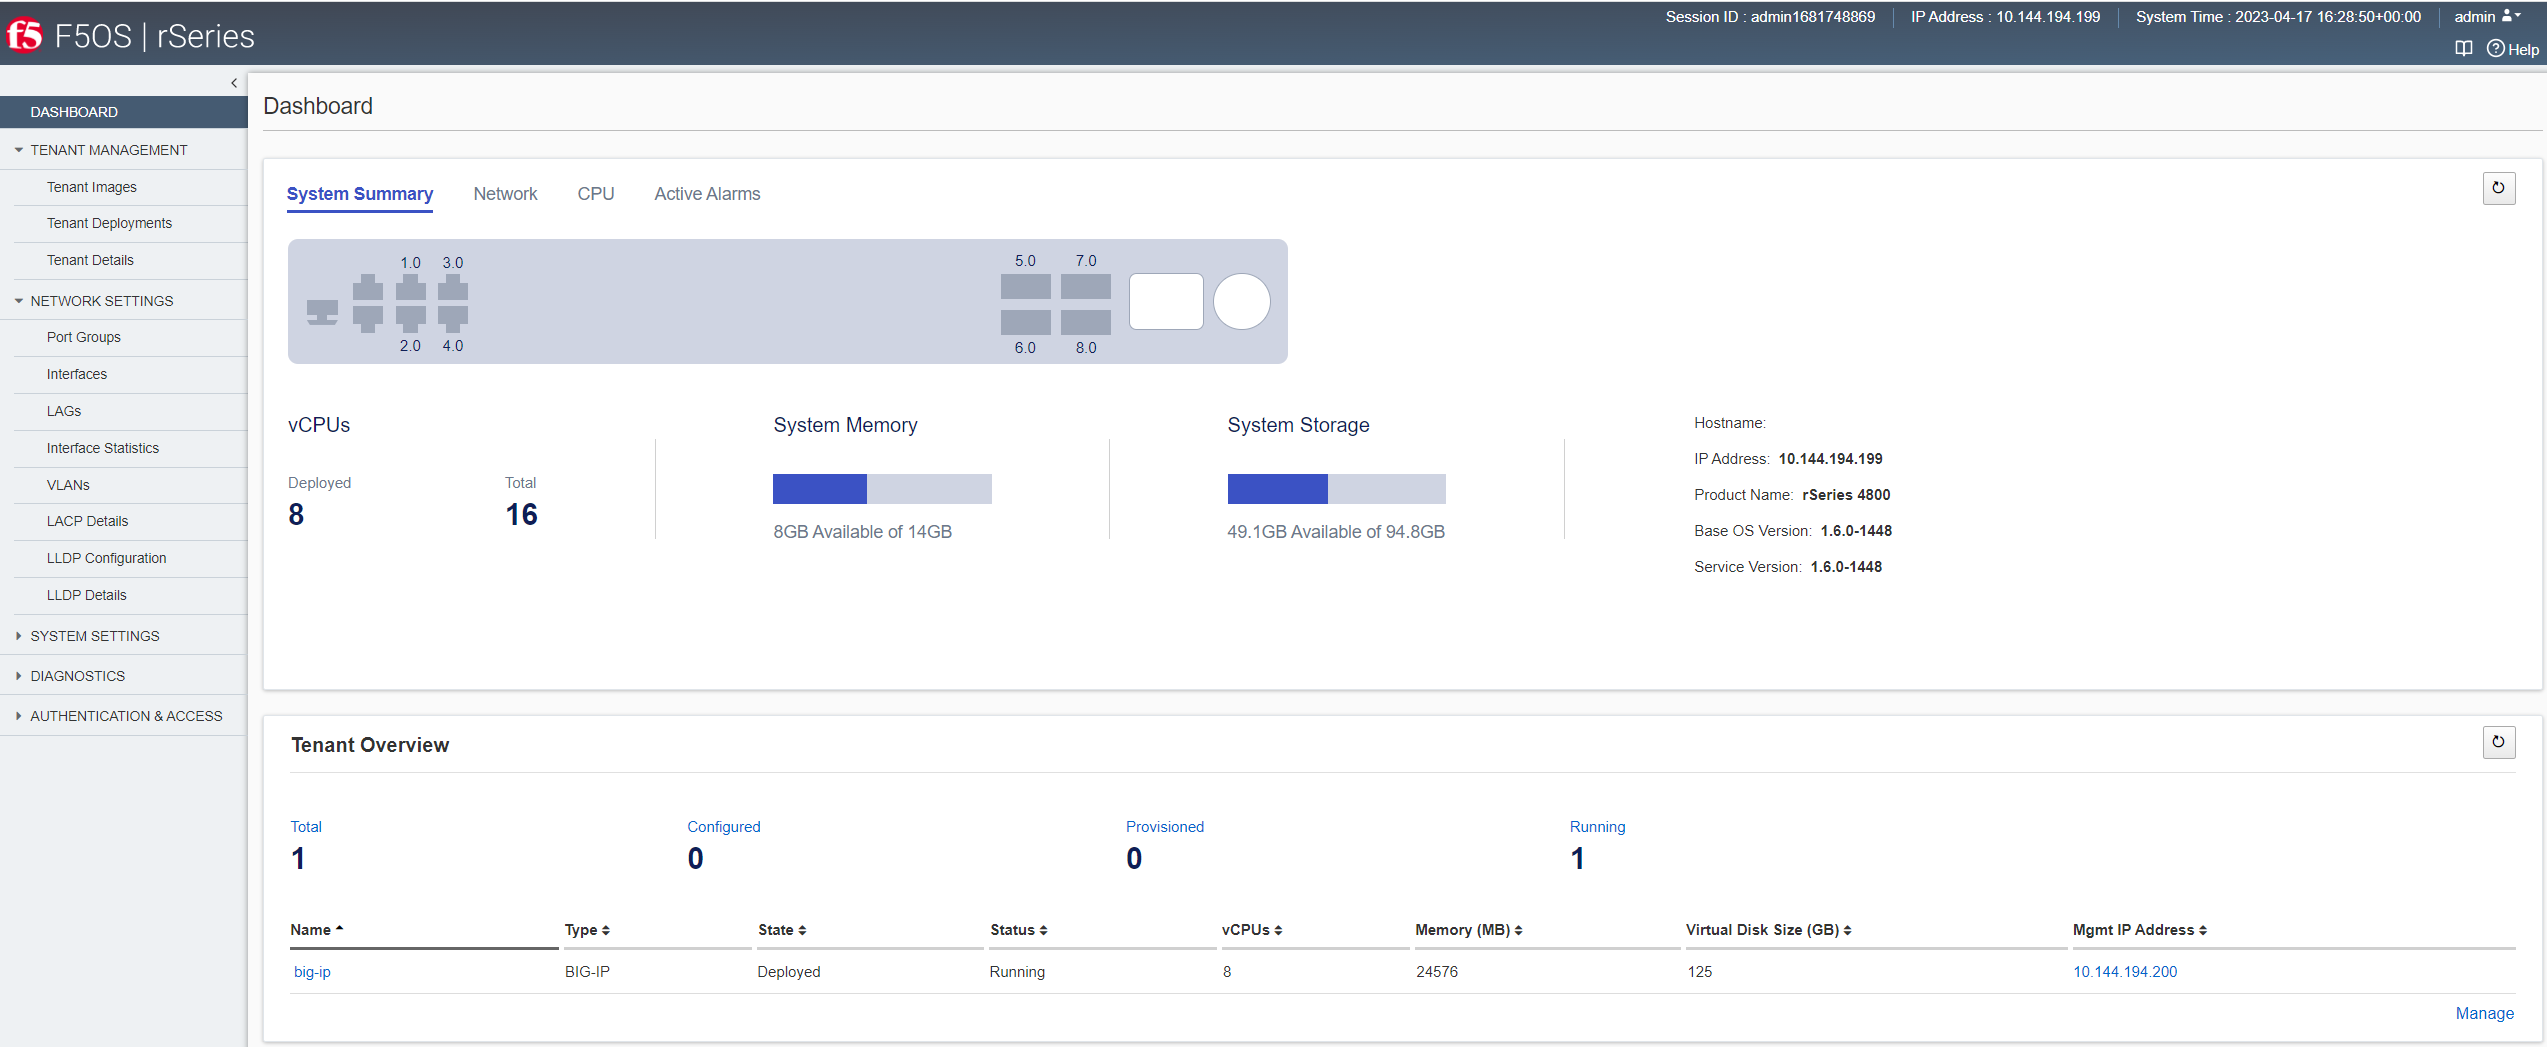
The dashboard includes these sections:
Shows information about system storage, memory utilization, hostname, IP address, product name, software versions, available vCPUs, and deployed vCPUs.
Shows the current state for all system interfaces (ports) and displays port mappings.
Shows information about CPU utilization using a color-coded chart with hover text. The system updates the data in real time. Click Tenants (All) to filter the display for all or selected tenants only.
Shows system alerts that have occurred recently. The system updates the alarms every few seconds. It shows the source of the alert, its severity, a brief description of what occurred, and when it happened.
Lists an overview of tenant deployments on the system, the type, number of vCPUs in use by the tenant, memory data, virtual disk size, VLANs, state, status, and management IP addresses. Click a tenant name to view tenant deployment details. Click the IP address to open the login screen of the tenant in a new browser window. The Manage button lists all of the tenants on a separate screen, with paging if needed.