Updated Date: 07/07/2026
Dashboards
The VELOS system dashboards display relevant system information when you log in to the system controller or chassis partition webUI.
F5OS webUIs fully support the latest versions of Chrome and Firefox browsers at the time of each F5OS release.
Both of the dashboards are divided into sections that show:
- Chassis partition details
- System controller information
- High availability status
- Tenant information
- Network information
- CPU data
- Active alarms
The system controller dashboard shows information about which slots have blades in them, how the chassis is divided into chassis partitions, system summary information, system controller high availability status, CPU data, and active alarms. It displays when you log in to the system controller webUI or click DASHBOARD from any other area in the system controller webUI. If a message of the day (MOTD) has been configured, it will display immediately upon login.
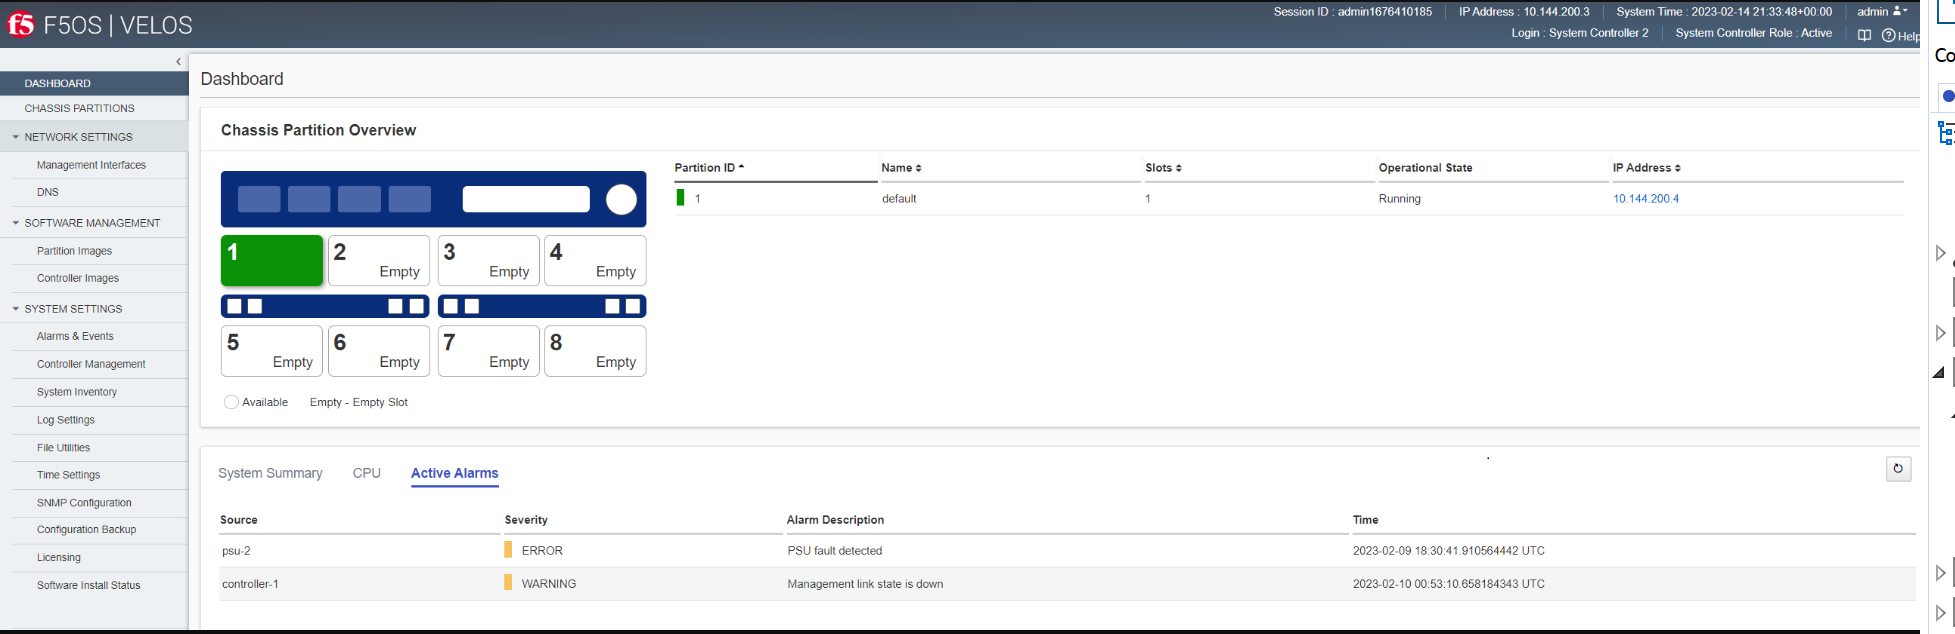
The table to the right of the graphic shows partition IDs, names, slots, IP addresses, status, and operational state.
The system controller dashboard also includes these sections:
- Partitions Overview tab
- Shows a graphical view of the chassis. Chassis partition details on the system controller dashboard show an overview of all the chassis partitions. The chassis partition dashboard shows details about the chassis partition to which you are logged in.
The slots associated with the default chassis partition are shown in green. The table on the right displays chassis partitions details. Click the IP address of an active chassis partition to log in directly to the chassis partition.
- Controller Overview tab
- Shows a tabular and graphical view of the controller, including role, status, memory and storage data, and current version information, and system uptime. A chart indicates CPU utilization.
- Active Alarms
- Shows system alerts that have occurred recently. The system updates the alarms every few seconds. It shows the source of the alert, its severity, a brief description of what occurred, and when it happened. If there is an active alarm, the Active Alarms tab will be in focus.
The chassis partition dashboard shows which chassis partition you are logged in to, which slots are associated with that chassis partition, network information, CPU data, active alarms for that chassis partition, and the tenants that are deployed in that chassis partition. It provides a quick overview of the chassis partition and displays when you log in to the chassis partition webUI or click DASHBOARD from any other area in the chassis partition webUI.
The System Summary section of the chassis partition dashboard shows a graphical view of the chassis and shows information only about the chassis partition to which you are logged in. In this example, you are logged in to the default chassis partition.
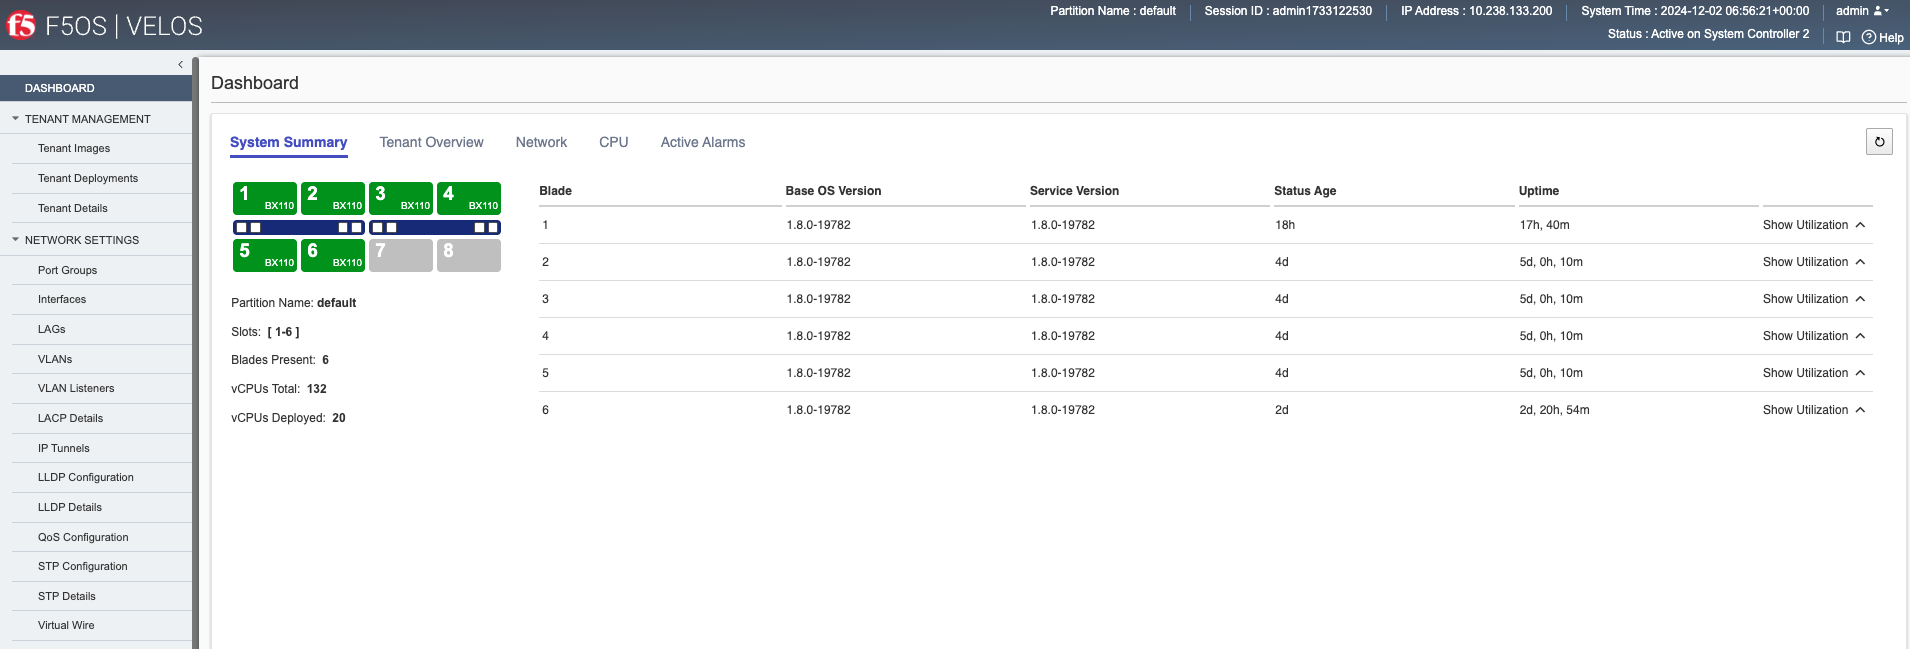
This chassis partition spans across slots 1, 7, 14, 20, and 21, and has a total of 192 vCPUs. The details on the lower left summarize how many vCPUs are available, and how many are deployed and in use by the one tenant in that chassis partition.
The chassis partition dashboard includes these sections:
Shows system memory and storage data, available vCPUs, deployed vCPUs, software versions, system uptime, and High Availability status. The High Availability status shows which system controller is currently active and whether the two controllers are both healthy. If both are healthy, the two system controllers handle traffic and are redundant, and the system is functioning normally.
-
Memory Utilization: Provides memory utilization stats of both System and Tenant.
Note: Tenant memory utilization stats show only the memory allocated to deployed tenants. Provisioned and configured tenants do not have memory assigned. Hence, provisioned and configured tenants are not considered while calculating the stats.
-
Storage Utilization: Provides a granular view of the system, F5OS images, and tenants storage utilization. The F5OS Tenant Disks represent the storage available for cBIP tenants. When a cBIP tenant is created, it uses the storage from F5OS Tenant Disks. You can use the category filter to sort the storage utilization by each category.
Lists an overview of tenant deployments in the chassis partition, the type, number of vCPUs in use by the tenant, memory data, virtual disk size, VLANs, state, status, and management IP addresses. Click a tenant name to view tenant deployment details. Click the IP address to open the login screen of the tenant in a new browser window. The Manage button lists all of the tenants on a separate screen, with paging if needed.
Shows network interfaces (ports) speed and status for installed blades.
Displays information about vCPU allocation and its utilization.
-
CPU Allocation: You can select a blade from the dropdown at the top-right to see the vCPU allocation and mapping for the selected blade.
- The vCPU allocation is categorised into four different categories:
- Tenants- vCPUs allocated to tenant and used by the tenant.
- **F5OS Data Mover -**vCPUs allocated and used by F5OS Data Movers at the F5OS platform layer.
- **F5OS Dedicated -**vCPUs allocated and used by the F5OS platform layer.
- **F5OS -**vCPUs available for tenant deployment and used by F5OS platform layer since the vCPUs are not assigned to any tenants.
- The horizontal bar chart shows the percentage at which the vCPUs are allocated between F5OS, Tenants, F5OS Data Mover, and F5OS Dedicated. Hovering over the bar chart in the graph displays the allocated vCPU thread IDs for each category.
- A grid chart shows the total vCPU count for the system and the vCPU IDs that are pinned to either F5OS, Tenants, F5OS Data Mover, and F5OS Dedicated. Hovering over the grid chart displays the information about the vCPUs mapping. Note: Grid and horizontal bar chart are dynamically adjusted based on the blade variant to reflect the actual number of vCPUs available for the blade.
- The vCPU allocation is categorised into four different categories:
-
CPU Utilization: Shows real-time information about CPU utilization using a bar chart with hover text. Click Tenants (All) to filter the display. The filtered chart will display vCPUs reserved by the filtered tenant. This feature is supported only by tenants running BIG-IP Next software version 20.2.1 and BIG-IP software versions 17.x.x and later versions. Unsupported tenant versions are listed in the Tenants list, but CPU data is unavailable.
Shows system alerts that have occurred recently. The system updates the alarms every few seconds. It shows the source of the alert, its severity, a brief description of what occurred, and when it happened. If there is an active alarm, the Active Alarms tab will be in focus.