This implementation describes how to view application statistics on the BIG-IP® system. It describes how you can examine the statistics in the Analytics charts
when Application Visibility and Reporting (AVR) is provisioned. Analytics charts display
statistical information about traffic on your system. The system updates the information every
five minutes.
The Overview screen shows all of the HTTP statistics in one place, including averages for
transactions per second (TPS), request and response throughput, server latency, page load time,
concurrent sessions, and new sessions. You can filter, drill down, and view selected information
by different metrics, such as by application, virtual server, URL, country, and so on.
The Analytics Custom screen provides a summary of the most frequent recent types of application
traffic, such as the most accessed virtual servers, URLs, pool members, and so on. You can design
the Analytics Custom screen so that it shows the specific types of data you are interested in.
You can schedule the reports to be sent to email addresses periodically. From any of the
displayed reports, you can also export them to a PDF file, or send the report to one or more
email addresses.
Note: The displayed Analytics
statistics are rounded up to two digits.
Examining application statistics
Before you can look at the
application statistics, you need to have created an HTTP Analytics profile so that the
system is capturing the application statistics internally on the BIG-IP® system. You must associate the Analytics profile with one or more
virtual servers (in the HTTP Analytics profile or in the virtual server). If you created
an iApp application service, you can use the provided template to associate the virtual
server.
You can review, filter, and compare
HTTP statistics for traffic on the BIG-IP system. The HTTP Overview screen provides
visibility into application behavior, user experience and client activity, transactions,
data center resource usage, and more.
-
On the Main tab, click .
The Overview screen opens and displays current HTTP statistics averaged
over the last hour. You can see charts on the left and a list of dimensions on
the right.
-
At the top of the screen, you can adjust the time frame and refresh details for
the statistics.
| Option |
Description |
|
Time frame
|
Specifies the time frame for which you want to display HTTP
statistics (Last hour, Last
day, Last week, and so on, or
All to display all data). |
|
Auto-refresh interval
|
Controls how often the statistics are refreshed on the screen
(1 min., 5 min.,
10min., or turns refresh
Off. |
|
Refresh button
|
Updates the statistics on the screen immediately. |
|
Timeline adjuster
|
Shows the actual time frame for which statistics are currently
displayed according to the time focus that is selected. On the graphic,
drag the handles on either end to change the focus of the
statistics. |
As you adjust the time settings, the statistics are updated on the
screen.
-
Initially, the data is unfiltered, and it displays all statistics it has for
the time frame selected (Last hour, by default). To
filter the data, select one or more dimensions in the right column.
For example, you can filter by Applications,
Virtual Servers, URLs,
Countries, and so on. You can select more than one
dimension, and one or more instances in a dimension. But note that some
combinations are restricted. So if you select URLs, then the Client IP
Addresses, Subnets, and Countries dimensions are not available.
As you select dimensions or instances, the filtered statistics are
displayed on the screen.
-
To view the statistics in table form, expand the dimension, then drag the
handle on the dimensions column to the left.
Tip: To see the full
column names, hover over the headings. To expand the table to the full width
of the screen to see all of the columns, click the handle.
Tables containing detailed statistics for the items in the dimensions
are displayed.
-
To compare two or more instances in a dimension, select the instances, click
the options icon, and select Add Comparison Chart.
The system displays a new chart at the top comparing the selected
instances.
-
You can clear all filter selections or those for a dimension.
- To clear all selections,
click the gear icon at the top of the column and select Clear
All.
- To clear selections for a
dimension, click the options icon (three horizontal lines to the left of the
title), and select Clear Selection.
You can continue to review the
statistics on the system in the charts showing average transactions per second, request
and response throughput, server latency, page load time, and concurrent and new
sessions. As a result, you become more familiar with the system, applications, resource
utilization, and more, and you can view the statistics in graphical charts and in
tables, focusing on the specific data you need.
You can save the statistics in a
file, and send the file to select users by email. You can also set up schedules to send
specific reports to specific users (go to ).
About the reporting interval for charts and reports
The system updates the statistics for charts and reports at five minute intervals: at five
minutes after the hour, ten minutes after the hour, and so on. Each five-minute mark includes
data from the previous five minutes; so 12:45 includes data starting from 12:40:01 to
12:45:00.
Charts and data that you export from charts reflect the publishing interval of five minutes.
For example, if you request data for the time period 12:40-13:40, the data in the chart or in the
file that you export is for that time period. But if there is a request for data from
12:42-13:42, the data in the chart is from 12:45-13:45. By default, the BIG-IP® system displays one hour of data.
HTTP Overview examples
This figure shows the HTTP Overview screen as it might look when first displayed. It has
several charts on the left, and the dimensions are listed on the right. The dimensions act as
filters of the data displayed in the charts. You can expand the dimensions to see, for example, a
list of the applications on the system.
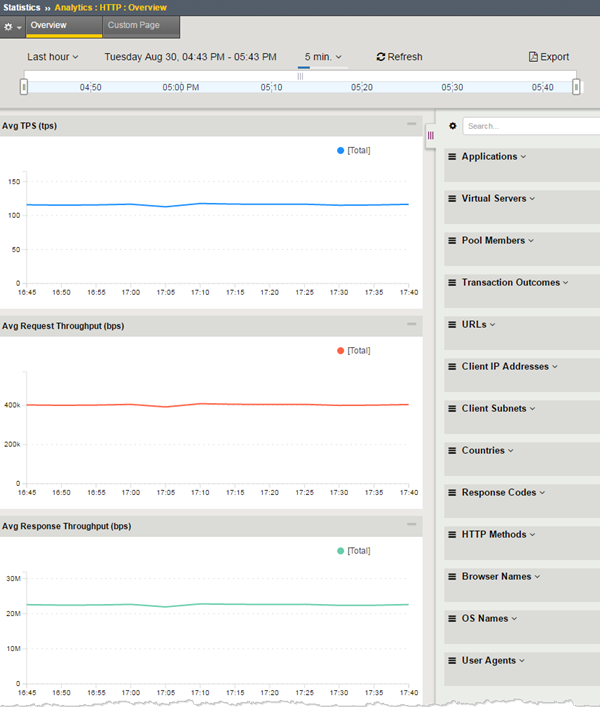
HTTP Overview screen
You can display more data by pulling the handle on the dimensions column to the left.
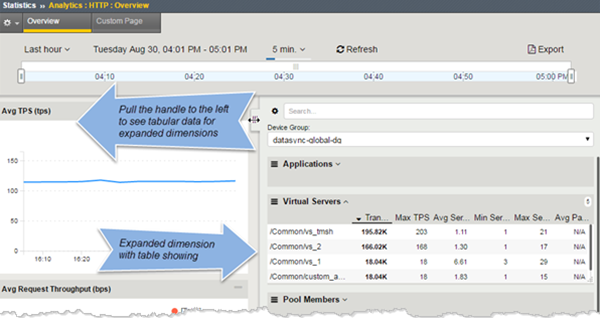
Pull handle to display data
You can expand the table to the full column width by clicking the handle. There are many
columns of data. Hover over the column headings to see the full names. When viewing the table
format of the data, it is best to maximize the browser window to see all the columns.
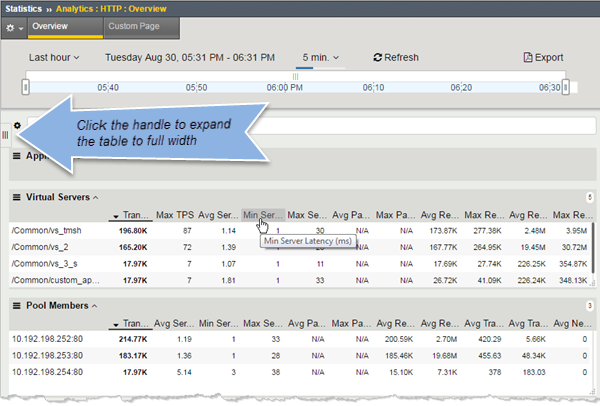
HTTP data in tabular form
Lots of data is available on the HTTP Overview. The best way to learn about it is to view the
charts on the initial view. If you see a spike or something that you want to investigate, select
one or more dimensions and view the statistics in table form. You can change the time frame, or
select specific entities to narrow down the scope of the data to determine what caused the
change.
Saving or emailing report files
To send reports by email, the default analytics profile must
specify an SMTP configuration ().
You can export or email any of the
Analytics charts including those which display statistics for HTTP, TCP, memory, disk,
virtual servers, and other charts available on your system.
-
On the main tab, click and select the type of chart to display.
-
Adjust the chart so that it shows the information you want, adjusting the
content as needed.
-
On the upper right of the charts screen, click
Export.
Tip: To send the
report to others by email, go to .
-
Click Export.
Customizing your statistics view
Before you can view HTTP
application statistics, you need to have created an Analytics profile so that the system
is capturing the application statistics internally on the BIG-IP®
system. You must associate the Analytics profile with one or more virtual servers (in
the Analytics profile or in the virtual server). If you created an iApp application
service, you can use the provided template to associate the virtual server.
You can customize how you view
statistics by displaying the information you want, organized as you want to see it into
data-specific widgets. A set of default widgets is provided showing HTTP
statistics for the top URLs, pool members, virtual servers, client subnets, and
countries. You can create additional widgets or reorganize what's there.
-
On the Main tab, click .
The Custom Page opens showing current HTTP statistics. By default, there
are five widgets organized in two columns.
-
To view statistics for a particular device group, from the
Device Group list, select the one you want.
-
To adjust the time range for all widgets, from Override time
range to, select a new time frame for which to view
statistics.
If you select (per widget), you can specify
different time ranges for each widget.
-
For each widget you want to change, click the gear icon and select
Settings.
The Modify Widget Properties popup opens where you can change what the
widget shows and the format used.
-
To change the order of the widgets, drag them up or down within the
column.
-
To delete a widget if you do not need that information, click the gear icon and
select Delete.
-
To focus in on the specific details you want more information about in any
widget, click an item in the chart.
The system refreshes the charts and displays information about the
item. Click Back to return to the Custom Page.
-
To create a new widget in either column, click Add
Widget at the bottom of the column.
-
Fill in the Add New Widget popup screen to define the widget.
-
From the Available Measurements, select the
measurement to use.
-
If there is a choice, select the data visualization.
-
Click Done.
The new widget displays in the column.
-
Click Export to create a report of this
information.
Note: The timestamp
on the report reflects a publishing interval of five minutes; therefore, a
time period request of 12:40-13:40 actually displays data between
12:35-13:35. By default, the BIG-IP system displays one hour of data.
You can continue to adjust the
Custom Page so that it displays the information you want in the order you want
it.


