Manual Chapter : Reports Logs and Statistics

Applies To:

Show Versions Show Versions

BIG-IP APM

  • 11.5.10, 11.5.9, 11.5.8, 11.5.7, 11.5.6, 11.5.5, 11.5.4, 11.5.3, 11.5.2, 11.5.1
Manual Chapter

About SWG data for threat monitoring

After Secure Web Gateway (SWG) starts proxying web access, it provides information that you can use to monitor threats and to fine-tune URL filters and schemes. SWG provides reports, statistics, and logs. If you configure high-speed remote event logging, you have data on a remote system from which you can create your own reports.

About Access Policy Manager and Secure Web Gateway logs

Secure Web Gateway (SWG) supports high-speed logging and can store event logs in a local database or on a pool of remote servers (recommended). SWG event logging occurs separately from Access Policy Manager® (APM®) logging and from BIG-IP® system logging as well.

Logs for the access policies that are part of an SWG configuration depend on APM report preference settings. Access policy logs might be in the /var/log/apm file or in a local database that APM reports uses.

About local and remote logging for Secure Web Gateway

You can log Secure Web Gateway (SWG) events either locally on the BIG-IP® system or remotely, using the BIG-IP system's high-speed logging mechanism. For remote logging, the high-speed logging mechanism sends log messages to a pool of logging servers that you define. Remote logging is the recommended configuration.

Note: When you configure remote logging, logs are not available for display in the Configuration utility.

For local logging, the high-speed logging mechanism stores the logs in either the Syslog or the MySQL database on the BIG-IP system, depending on a destination that you specify. The available local destinations are:

local-db
Causes the system to store log messages in the local MySQL database. When you choose local-db, you can view log messages in the Configuration utility.
local-syslog
Causes the system to store log messages in the local Syslog database. When you choose local-syslog, log messages are not available for display in the Configuration utility.

Although local logging is not recommended, you can store log messages locally on the BIG-IP system instead of or in addition to storing logs remotely.

Note: The BIG-IP system is not a logging server and has limited capacity for storing, archiving, and analyzing logs. For this reason a dedicated logging server is recommended.

Flowchart for local logging configuration

F5® recommends remote high-speed logging. However, you can configure local logging instead of or in addition to remote logging if you want to do so.

Note: The BIG-IP® system is not a logging server and has limited capacity for storing, archiving, and analyzing logs.
how to configure local logging 
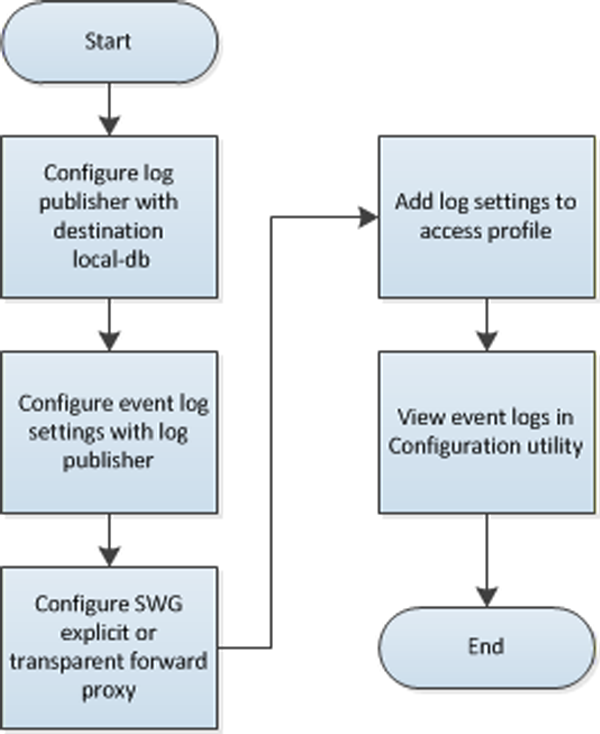
Secure Web Gateway local logging configuration

Overview: Monitoring Internet traffic and making adjustments to SWG

You can view Secure Web Gateway (SWG) statistics on the BIG-IP® system and adjust SWG based on the information that you gather from reports. Charts display statistical information about web traffic on your system, including the following details:

Client IP address
IP address from which the request for the URL originated.
URL categories
Name of the preconfigured or custom URL category into which a requested URL falls.
URLs
Requested URL.
Schemes
Name of the scheme that SWG applied to the request based on your access policy configuration.
URL filters
Name of the URL filter SWG applied to the request based on the schedule in the scheme.
Users
Name of the user that made the request, if available.
Note: Configuring your system to identify users is optional.
SSL bypass
Whether the request was bypassed; yes or no.
Note: Configuring your system to omit certain SSL traffic from inspection is optional.

The system updates the statistics every five minutes; you can refresh the charts periodically to see the updates. SWG provides overview charts and report charts.

Note: You can access statistics when SWG is provisioned and when you enable data collection for SWG reports.
Overview
The Secure Web Gateway overview charts summarize the top requests, such as top URLs, top categories by blocked request count, top users by permitted request count or by blocked request count, and so on. You can customize the Overview so that it shows the specific type of data you are interested in.
Reports
Secure Web Gateway provides two reports: All Requests and Blocked Requests. You can filter the reports to show the information that you want to see.

From the overview or reports, you can export data to a PDF or CSV file, or send the reports to one or more email addresses.

Task summary

About the reporting interval for charts and reports

The system updates the statistics for charts and reports at five minute intervals: at five minutes after the hour, ten minutes after the hour, and so on.

Charts and data that you export from charts reflect the publishing interval of five minutes. For example, if you request data for the time period 12:40-13:40, the data in the chart or in the file that you export is for the time period 12:35-13:35. By default, the BIG-IP® system displays one hour of data.

Configuring statistics collection for reports

You configure report settings to specify whether to gather statistics for Secure Web Gateway (SWG) reports and whether to use data sampling.
  1. On the Main tab, click Access Policy > Secure Web Gateway > Reports > Settings. The Report Settings screen displays.
  2. To enable statistics gathering, select the Collect Data check box. If you clear the check box, data collection stops.
  3. To enable dynamic data sampling, select the Sample Data check box. In exchange for a performance gain, data sampling might provide slightly inaccurate statistics. If statistics must be more accurate, then disable data sampling.

Examining Secure Web Gateway statistics

Note: Newer browsers (Internet Explorer 9 or later, Firefox 3.6 or later, or Chrome 14 or later) support viewing charts with no additional plug-in. If using older browsers (Internet Explorer 8 or earlier), Adobe® Flash® Player (version 8 or later) must be installed on the computer where you plan to view charts.
You can review charts that show statistical information about traffic from your enterprise to the Internet. The charts provide visibility into the top requests for URL categories, blocked URL categories, top users, and so on.
  1. On the Main tab, click Access Policy > Secure Web Gateway > Overview. The Overview screen displays charts for each widget.
  2. From the Override time range to list, select a new time frame to apply to all of the widgets in the overview.
    Tip: Within each widget you can override the default time range, as needed.
  3. For each widget, select the data format and the time range to display, as needed.
  4. To focus on the specific details you want more information about, click the chart or the View Details link. The system refreshes the charts and displays information about the item.
  5. From the View By list, select the specific network object type for which you want to display statistics. You can also click Expand Advanced Filters to filter the information that displays.
  6. On the screen, the system displays the path you followed to reach the current display, including the items you clicked. For example, to review details for the top categories, follow these steps:
    1. In the Top categories by Request Count chart, click the category that interests you. Assume that your URL filters allow access to some news and media sites and that News and Media is among the top categories. Click News and Media. Charts display the request count per action over time and the request count per action. A details table lists the request count for allowed actions.
    2. In the View By list, select URLs. Assume that one of the URLs concerns you and you want to know which URL filter or scheme allowed access to it. Charts update and a list of URLs displays in the details table. These are the top news and media URLs.
    3. To see which filter allowed this URL, from here you can continue to drill down successively by clicking a link in each details table that displays. These links should first display statistics for URL filter and then for scheme. As an alternative to drilling down, you can select any of the statistics displayed on the View By list; for example you can select URL Filter or Scheme directly.
    The Overview charts display summarized data. You might notice as you drill down that details display on the Reports screen.
You can review the access policy to ensure that you use the optimal strategy for applying a scheme a user. You can update URL filters to block or allow particular URL categories. You can update URL categories to include new URLs that you have seen in statistics details, or to recategorize existing URLs to fit your policies. You can continue to review the collected metrics and troubleshoot the system as needed.

Exporting or emailing Secure Web Gateway statistics

You can export or email charts that show Secure Web Gateway (SWG) statistics.
  1. On the Main tab, click Access Policy > Secure Web Gateway > Overview. The Overview screen displays charts for each widget.
  2. Display the charts that show the information you want, clicking any of the options and adjusting the content as needed.
  3. On the upper right of the charts screen, click Export.
    Tip: You can also export any single report widget from the Overview screen. Click the widget configuration icon for the report and select Export.
    The Choose Export Options popup screen opens.
  4. Choose the appropriate options.
    Option Action
    Export the data in option format Specify the export format:
    • Select PDF to save the information in a graphical format to a PDF file.
    • Select CSV (Time Series) to export the information to a text file including specific information for time increments.
    • Select CSV (Details Table) to export the information to a text file providing summary details.
    If exporting the entire Overview screen, the information is saved only in PDF format (no export format options are available). When exporting widgets, the format options are PDF or CSV (only one CSV format is provided).
    Save the report file on your computer Select this option to save or open the file containing the report.
    Send the report file as an attachment to the following E-mail address(es) Type one or more email addresses (separated by comma or semicolon) to which to send the report.
  5. Click Export. The system saves the report to a file, or emails the file to the specified recipients. If SMTP is not configured (when sending reports by email), you receive a message that SMTP must be set up before you can send the reports.

Creating an SMTP server configuration

You specify the SMTP server configuration so that you can send emails through an SMTP server.
  1. On the Main tab, click System > Configuration > Device > SMTP.
  2. Click the Create button. The New SMTP Configuration screen opens.
  3. In the Name field, type a name for the SMTP server that you are creating.
  4. In the SMTP Server Host Name field, type the fully qualified domain name for the SMTP server host.
  5. In the SMTP Server Port Number field, type a port number. For no encryption or TLS encryption, the default is 25. For SSL encryption, the default is 465.
  6. In the Local Host Name field, type the host name used in the SMTP headers in the form of a fully qualified domain name. This host name is not the same as the BIG-IP system's host name.
  7. In the From Address field, type the email address that you want displayed as the reply-to address for the email.
  8. From the Encrypted Connection list, select the encryption level required for the SMTP server.
  9. To require that the SMTP server validates users before allowing them to send email, select the Use Authentication check box, and type the user name and password required to validate the user.
  10. Click the Finish button.
You can now configure the system to use this SMTP server to send emails. For the SMTP mailer to work, you must make sure the SMTP server is on the DNS lookup server list, and configure the DNS server on the BIG-IP® system.

Overview: Configuring remote high-speed SWG event logging

You can configure the BIG-IP® system to log information about Secure Web Gateway (SWG) events and send the log messages to remote high-speed log servers.

Important: SWG must be licensed and provisioned before you can configure event logging for it.

When configuring remote high-speed logging of SWG events, it is helpful to understand the objects you need to create and why, as described here:

Object to create in implementation Reason
Pool of remote log servers Create a pool of remote log servers to which the BIG-IP system can send log messages.
Destination (unformatted) Create a log destination of Remote High-Speed Log type that specifies a pool of remote log servers.
Destination (formatted) If your remote log servers are the ArcSight, Splunk, or Remote Syslog type, create an additional log destination to format the logs in the required format and forward the logs to a remote high-speed log destination.
Publisher Create a log publisher to send logs to a set of specified log destinations.
Log Setting Create event log settings to enable logging of user-specified data, and associate a log publisher with the log settings.
SWG configuration Create a configuration for SWG explicit forward proxy or transparent forward proxy.
Access profile Add log settings to the access profile in the explicit forward proxy or transparent forward configuration.
Virtual server In a SWG configuration, an access profile is associated with the virtual server that handles the forward proxy traffic.
Associations between remote high-speed logging configuration objects 
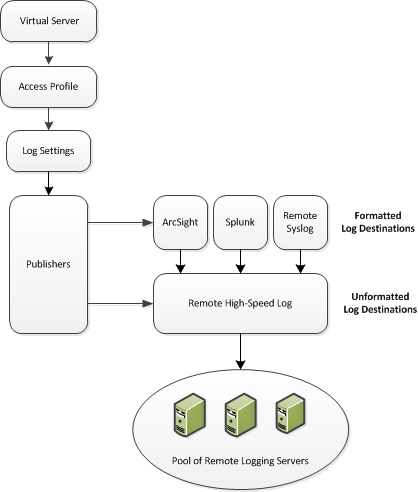
Association of remote high-speed logging configuration objects

Task summary

Perform these tasks to configure remote high-speed SWG event logging on the BIG-IP system.
Note: Enabling remote high-speed logging impacts BIG-IP system performance.

Task list

Creating a pool of remote logging servers

Before creating a pool of log servers, gather the IP addresses of the servers that you want to include in the pool. Ensure that the remote log servers are configured to listen to and receive log messages from the BIG-IP® system.
Create a pool of remote log servers to which the BIG-IP system can send log messages.
  1. On the Main tab, click Local Traffic > Pools. The Pool List screen opens.
  2. Click Create. The New Pool screen opens.
  3. In the Name field, type a unique name for the pool.
  4. Using the New Members setting, add the IP address for each remote logging server that you want to include in the pool:
    1. Type an IP address in the Address field, or select a node address from the Node List.
    2. Type a service number in the Service Port field, or select a service name from the list.
      Note: Typical remote logging servers require port 514.
    3. Click Add.
  5. Click Finished.

Creating a remote high-speed log destination

Before creating a remote high-speed log destination, ensure that at least one pool of remote log servers exists on the BIG-IP® system.

Create a log destination of the Remote High-Speed Log type to specify that log messages are sent to a pool of remote log servers.

  1. On the Main tab, click System > Logs > Configuration > Log Destinations. The Log Destinations screen opens.
  2. Click Create.
  3. In the Name field, type a unique, identifiable name for this destination.
  4. From the Type list, select Remote High-Speed Log.
    Important: If you use log servers such as Remote Syslog, Splunk, or ArcSight, which require data be sent to the servers in a specific format, you must create an additional log destination of the required type, and associate it with a log destination of the Remote High-Speed Log type. With this configuration, the BIG-IP system can send data to the servers in the required format.
    The BIG-IP system is configured to send an unformatted string of text to the log servers.
  5. From the Pool Name list, select the pool of remote log servers to which you want the BIG-IP system to send log messages.
  6. From the Protocol list, select the protocol used by the high-speed logging pool members.
  7. Click Finished.

Creating a formatted remote high-speed log destination

Ensure that at least one remote high-speed log destination exists on the BIG-IP® system.

Create a formatted logging destination to specify that log messages are sent to a pool of remote log servers, such as Remote Syslog, Splunk, or ArcSight servers.

  1. On the Main tab, click System > Logs > Configuration > Log Destinations. The Log Destinations screen opens.
  2. Click Create.
  3. In the Name field, type a unique, identifiable name for this destination.
  4. From the Type list, select a formatted logging destination, such as Remote Syslog, Splunk, or ArcSight. The BIG-IP system is configured to send a formatted string of text to the log servers.
  5. If you selected Remote Syslog, from the Syslog Format list, select a format for the logs, and then from the High-Speed Log Destination list, select the destination that points to a pool of remote Syslog servers to which you want the BIG-IP system to send log messages.
  6. If you selected Splunk from the Forward To list, select the destination that points to a pool of high-speed log servers to which you want the BIG-IP system to send log messages.
  7. Click Finished.

Creating a publisher

Ensure that at least one destination associated with a pool of remote log servers exists on the BIG-IP® system.
Create a publisher to specify where the BIG-IP system sends log messages for specific resources.
  1. On the Main tab, click System > Logs > Configuration > Log Publishers. The Log Publishers screen opens.
  2. Click Create.
  3. In the Name field, type a unique, identifiable name for this publisher.
  4. For the Destinations setting, select a destination from the Available list, and click << to move the destination to the Selected list.
    Note: If you are using a formatted destination, select the destination that matches your log servers, such as Remote Syslog, Splunk, or ArcSight.
  5. Click Finished.

Creating log settings for Secure Web Gateway events

Create log settings to specify event logging for Secure Web Gateway (SWG) events.
  1. On the Main tab, click Access Policy > Event Logs > Log Settings. A list displays.
  2. Click Create. A popup screen opens with General Information selected in the left pane.
  3. Fill in the fields. The Log for Secure Web Gateway check box is selected by default. If you clear this check box, logging is disabled in these settings.
    Note: You can create multiple log settings for Secure Web Gateway (SWG) and attach multiple log settings to an access profile.
  4. To select a publisher for a high-speed log destination or to change the types of events to log, from the left pane, select Secure Web Gateway. Settings in the right pane change.
  5. From the Log Publisher list, select the log publisher of your choice. The default log publisher publishes to a destination on the BIG-IP® system.
  6. To log events, you must select at least one check box:
    • Log Allowed Events: When selected, user requests for allowed URLs are logged.

    • Log Blocked Events: When selected, user requests for blocked URLs are logged.
    Whether a URL is allowed or blocked depends on the URL category into which it falls and on URL filter that is applicable at the time of the request.
  7. Click OK. The popup screen closes. The new log setting displays on the list.
To put a log setting into effect, assign it to an access profile.

Adding log settings to an access profile

You add log settings to an access profile to log events on the traffic that passes through the virtual server to which the access profile is assigned.
  1. On the Main tab, click Access Policy > Access Profiles. The Access Profiles List screen opens.
  2. Click the name of the access profile that you want to edit. The properties screen opens.
  3. On the menu bar, click Logs. The access profile log settings display.
  4. Move log settings between the Available and Selected lists. You can assign multiple log settings to an access profile. Logging is disabled when the Selected list is empty.
    Note: Logging can also be disabled in the log setting itself. To check the status, view Log Settings in the Event Logs area of the user interface.
  5. Click Update.
An access profile is in effect when it is assigned to a virtual server.

Disabling logging

Disable event logging for Secure Web Gateway (SWG) when you need to suspend logging for a period or time or you no longer want the BIG-IP® system to log specific events.
Note: Logging is enabled by adding log settings to the access profile.
  1. To clear log settings from access profiles, on the Main tab, click Access Policy > Access Profiles.
  2. Click the name of the access profile. Access profile properties display.
  3. On the menu bar, click Logs.
  4. Move log settings from the Selected list to the Available list.
  5. Click Update.