Applies To:
Show Versions
BIG-IP ASM
- 11.5.10, 11.5.9, 11.5.8, 11.5.7, 11.5.6, 11.5.5, 11.5.4, 11.5.3, 11.5.2, 11.5.1
What is a DoS attack?
A denial-of-service attack (DoS attack) makes a computer resource unavailable to its intended users, or obstructs the communication media between the intended users and the victim so that they can no longer communicate adequately. Perpetrators of DoS attacks typically target sites or services, such as banks, credit card payment gateways, and e-commerce web sites.
Application Security Manager (ASM) helps protect web applications from DoS attacks aimed at the resources that are used for serving the application: the web server, web framework, and the application logic. Advanced Firewall Manager (AFM) helps prevent network, SIP, and DNS DoS attacks.
HTTP-GET attacks and page flood attacks are typical examples of application DoS attacks. HTTP-GET attacks are initiated either from a single user (single IP address) or from thousands of computers (distributed DoS attack), which overwhelms the target system. In page flood attacks, the attacker downloads all the resources on the page (images, scripts, and so on) while an HTTP-GET flood repeatedly requests specific URLs regardless of their place in the application.
About recognizing DoS attacks
Application Security Manager determines that traffic is a DoS attack based on calculations for transaction rates on the client side (TPS-based) or latency on the server side (latency-based). You can specify the calculations that you want the system to use.
In addition, the system can protect web applications against DoS attacks on heavy URLs. Heavy URL protection implies that during a DoS attack, the system protects the heavy URLs using the methods configured in the DoS profile.
You can view details about DoS attacks that the system detected and logged in the event logs and DoS reports. You can also configure remote logging support for DoS attacks when creating a logging profile.
About configuring TPS-based DoS protection
When setting up DoS protection, you can configure the system to prevent DoS attacks based on transaction rates (TPS-based anomaly detection). If you choose TPS-based anomaly protection, the system detects DoS attacks from the client side using the following calculations:
- Transaction rate during detection interval
- The average number of requests per second sent for a specific URL, or by a specific IP address. Every second, the system calculates the average TPS for the last minute.
- Transaction rate during history interval
- The average number of requests per second sent for a specific URL, or by a specific IP address. The system calculates this number every minute.
If the ratio of the transaction rate during the detection interval to the transaction rate during the history interval is greater than the percentage indicated in the TPS increased by setting, the system considers the URL to be under attack, or the IP address to be suspicious. In addition, if the transaction rate during the detection interval is absolutely higher than the TPS reached setting (regardless of the history interval), then also the respective IP address is suspicious or the URL is being attacked.
Note that TPS-based protection might detect a DoS attack simply because many users are trying to access the server all at once, such as during a busy time or when a new product comes out. In this case, the attack might be a false positive because the users are legitimate. But the advantage of TPS-based DoS protection is that attacks can be detected earlier than when using latency-based protection. So you need to understand the typical maximum peak loads on your system when setting up DoS protection.
About configuring latency-based DoS protection
When setting up DoS protection, you can configure the system to prevent DoS attacks based on the server side (latency-based anomaly detection). In latency-based detection, it takes a latency increase and at least one suspicious IP address, URL, or heavy URL to consider the activity an attack.
If the ratio of recent versus historical values is greater than the Latency increased by setting, then a prerequisite for the presence of an attack is satisfied, but that is not sufficient. It also takes at least one suspicious IP address, one attacked URL based on TPS criteria, or one heavy URL for the system to declare an attack and start mitigation. In addition, if the transaction rate during the detection interval is absolutely higher than the Latency reached setting (regardless of the history interval), then also the respective IP address is suspicious or the URL is being attacked.
Latency-based protection is less prone to false positives than TPS-based protection because in a DoS attack, the server is reaching capacity and service/response time is slow: this is impacting all users. Increased latency can be used as a trigger step for detecting an L7 attack. Following the detection of a significant latency increase, it is important to determine whether you need further action. After examining the increase in the requests per second and by comparing these numbers with past activity, you can identify suspicious versus normal latency increases.
About heavy URL protection
Heavy URLs are URLs that may consume considerable server resources per request. Heavy URLs respond with low latency most of the time, but can easily reach high latency under specific conditions. Heavy URLs are not necessarily heavy all the time, but tend to get heavy especially during attacks. Therefore, low rate requests to those URLs can cause significant DoS attacks and be hard to distinguish from legitimate clients.
Typically, heavy URLs involve complex database queries; for example, retrieving historical stock quotes. In most cases, users request recent quotes with weekly resolution, and those queries quickly yield responses. However, an attack might involve requesting five years of quotes with day-by-day resolution, which requires retrieval of large amounts of data, and consumes considerably more resources.
Application Security Manager allows you to configure protection from heavy URLs in a DoS profile. You can specify a latency threshold for automatically detecting heavy URLs. If some of the web site's URLs could potentially become heavy URLs, you can add them so the system will keep an eye on them, and you can add URLs that should be ignored and not considered heavy.
About site-wide DoS mitigation
In order to mitigate highly distributed DoS attacks, such as those instigated using large scale botnets attacking multiple URLs, you can include site-wide mitigation in a DoS profile. You can use site-wide mitigation as part of the prevention policy for either TPS-based or latency-based DoS protection. In this case, the whole site can be considered suspicious as opposed to a particular URL or IP address. Site-wide mitigation goes into effect when the system determines that the whole site is experiencing high-volume traffic but is not able to pinpoint and handle the problem.
The system implements site-wide mitigation method only as a last resort because it may cause the system to drop legitimate requests. However, it maintains, at least partially, the availability of the web site, even when it is under attack. When the system applies site-wide mitigation, it is because all other active detection methods were unable to stop the attack.
The whole site is considered suspicious when configured thresholds are crossed, and in parallel, specific IP addresses and URLs could also be found to be suspicious. The mitigation continues until the maximum duration elapses or when the whole site stops being suspicious. That is, there are no suspicious URLs, no suspicious IP addresses, and the whole site is no longer suspicious.
Overview: Preventing DoS attacks for applications
You can configure the Application Security Manager to protect against DoS attacks on web applications. Depending on your configuration, the system detects DoS attacks based on transactions per second (TPS) on the client side, server latency, or heavy URLs.
You configure DoS protection for Layer 7 by creating a DoS profile with Application Security enabled. You then associate the DoS profile with one or more virtual servers representing applications that you want to protect. DoS protection is not part of a security policy.
Task Summary
Configuring DoS protection for applications
Configuring TPS-based DoS protection settings
Configuring latency-based DoS protection
Configuring heavy URL protection
Recording traffic during DoS attacks
Associating a DoS profile with a virtual server
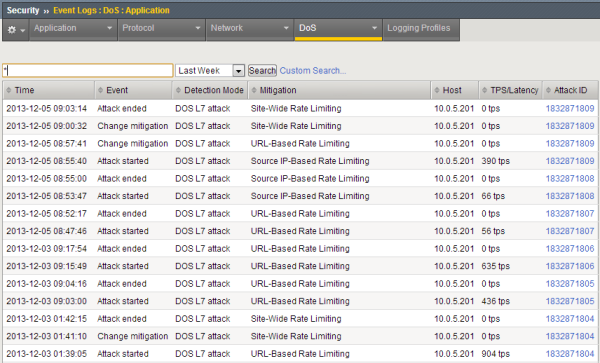
Displaying DoS event logs
Viewing DoS attack statistics
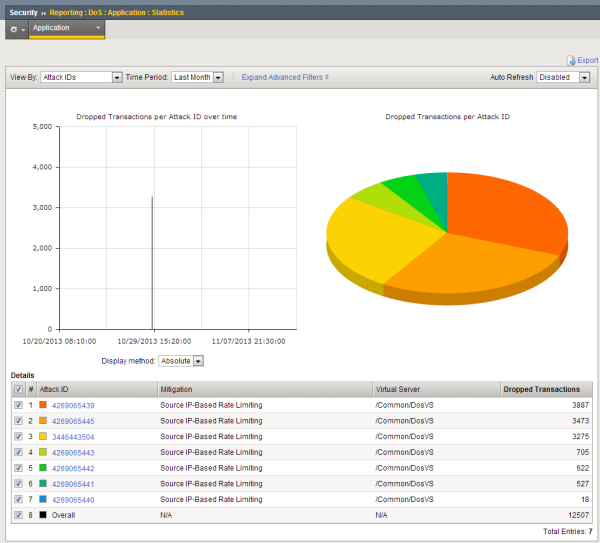
Sample DoS Statistics report
This figure shows a sample DoS Statistics report showing a number of DoS attacks listed by attack ID. The report shows the number of transactions that were dropped during these attacks which were all mitigated using source IP-based rate limiting. With this method of rate limiting, the system noticed a spike in requests coming from certain IP addresses and considered them to be suspicious IP addresses. The system limited the number of requests from these suspicious IP addresses to a reasonable number (before the attack started) or to the threshold configured in the TPS reached setting.
 Sample DoS Statistics report
Viewing URL Latencies reports
The URL Latencies report shows how fast your web application returns web pages and can show typical latency for applications (meaning virtual servers associated with a DoS profile) on your system. It can help you to identify slow pages with latency problems that may require additional troubleshooting by application developers.
You can also use the URL Latencies report for the following purposes:
- To determine the threshold latencies, especially the heaviness threshold. Tip: Set the heaviness threshold to approximately 90-95% of the latency distribution for the site. Filter the data by site (that is, by virtual server and DoS profile), and check the latency distribution in the histogram of the Total row.
- To track the current heavy URLs. You can add or remove manually configured heavy URLs depending on the information in the report.
- To monitor the latency distribution.
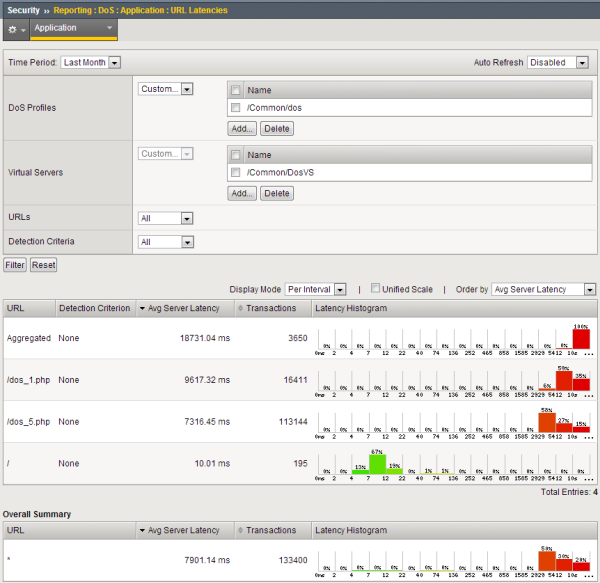
Sample URL Latencies report
This figure shows a sample URL Latencies report for a system with one DoS profile and one virtual server. It shows the latency for three web pages. One page (/) is performing within reasonable ranges displaying pages in 4 to 22 ms. However, two of the URLs, /dos_1.php and /dos_5.php, have much higher latency and might require some troubleshooting. While checking into the latency of those URLs, you can add them to the list of heavy URLs in the DoS profile so they do not trigger DoS mitigation.
 Sample URL Latencies report
Implementation Result
When you have completed the steps in this implementation, you have configured the Application Security Manager to protect against L7 DoS attacks. Depending on your configuration, the system detects DoS attacks based on transactions per second (TPS) on the client side, server latency, or both.
In TPS-based detection mode, if the ratio of the transaction rate during the history interval is greater than the TPS increased by percentage, the system considers the URL to be under attack, the IP address to be suspicious, or possibly the whole site to be suspicious.
In latency-based detection mode, if there is a latency increase and and at least one suspicious IP address, URL, or heavy URL, the system considers the URL to be under attack, the IP address to be suspicious, or possibly the whole site to be suspicious.
If you enabled heavy URL protection, the system tracks URLs that consume higher than average resources and mitigates traffic that is going to those URLs.
If you chose the blocking operation mode, the system drops requests from suspicious IP addresses and URLs. If using the transparent operation mode, the system reports DoS attacks but does not block them.
If using iRules, when the system detects a DoS attack based on the configured conditions, it triggers an iRule and responds to the attack as specified in the iRule code.
After traffic is flowing to the system, you can check whether DoS attacks are being prevented, and investigate them by viewing DoS event logs and reports.


