Once you have configured DoS protection on the BIG-IP® system, you can view charts, reports, statistics and event logs that show information about DoS attacks and mitigations in place on the system (). For example, you can view the DoS Dashboard screen, which shows at-a-glance whether or not the system is under attack, the type of attack and IP addresses of the source and destination of monitored traffic. The DoS Dashboard screen also indicates the impact of DoS attacks on your virtual servers, in addition to overall system health.
The DoS Analysis screen you can view reports of transaction outcomes, and correlate the impact of system detection and the mitigation of DoS attacks to system health and performance indicators. The reports and event logs on the DoS Analysis screen help you to understand whether the DoS protection you have implemented is protecting your application's performance, or whether you need to fine-tune the configuration. In addition, you can adjust the time line to view historical attacks and their trends, which can provide insight into the DoS threats your application commonly faces.
Investigating DoS attacks and mitigation
Before you can investigate DoS attacks, you need to have created a DoS profile so that the system is capturing the analytics on the system. You must associate the DoS profile with one or more virtual servers.
You can display the DoS Dashboard to see whether or not a DoS attack is taking place, and display information about DoS attacks.
- On the Main tab, click .
The DoS Dashboard opens and displays real-time information about all DoS attacks on the system. The system displays information about attacks that either started or ended during the last hour, by default.
- Review the charts to see if there have been any recent DoS attacks.
- At the top of the screen, you can adjust the time frame and refresh details for the statistics.
| Option |
Description |
|---|
| Time frame |
Specifies the time frame for which you want to display HTTP statistics (Last hour, Last day, Last week, and so on, or All to display all data). |
| Auto-refresh interval |
Controls how often the statistics are refreshed on the screen (1 min., 5 min., 10min., or turns refresh Off. |
| Refresh button |
Updates the statistics on the screen immediately. |
| Timeline adjuster |
Shows the actual time frame for which statistics are currently displayed according to the time focus that is selected. On the graphic, drag the handles on either end to change the focus of the statistics. |
As you adjust the time settings, the statistics are updated on the screen.
- Initially, the data is unfiltered, and it displays all statistics it has for the time frame selected (Last hour, by default). To filter the data, select one or more dimensions in the right column.
For example, you can filter by dimensions such as Attack IDs, Applications, Vectors, Countries, and so on. You can select more than one dimension, and one or more instances in a dimension. But note that some combinations are restricted.
As you select dimensions or instances, the filtered statistics are displayed on the screen.
- To view the statistics in table form, expand the dimension, then drag the handle on the dimensions column to the left.
Tip: To see the full column names, hover over the headings. To expand the table to the full width of the screen to see all of the columns, click the handle.
Tables containing detailed statistics for the items in the dimensions are displayed.
- You can clear all filter selections or those for a dimension.
- To clear all selections, click the gear icon at the top of the column and select Clear All.
- To clear selections for a dimension, click the options icon (three horizontal lines to the left of the title), and select Clear Selection.
- To view an analysis of your DoS activity, click .
You can review the details about DoS attacks on the DoS Dashboard and Analysis screens to quickly see whether or not you are under attack and view an analysis of DoS activity.
Sample DoS Dashboards
This figure shows a sample DoS Dashboard on a system that is having a low-level DoS attack now.
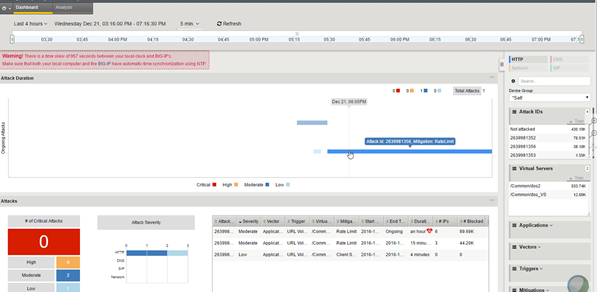
Sample DoS Dashboard
This figure shows a sample DoS Dashboard showing DoS attacks that occurred during the last week. Three of the attacks were critical but all were mitigated within minutes.
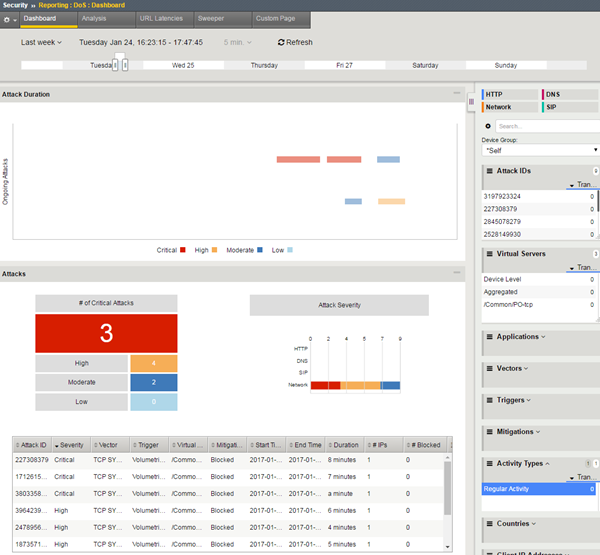
Sample DoS Dashboard showing attacks
Viewing URL Latencies reports
For the URL Latencies report to include useful information, you need to have created a DoS profile and associated it with the application's virtual server for the system to capture the latency statistics for the application.
You can display a report that shows information about the latency of traffic to specific web pages in your application. The report lists the latency for each URL separately, and one row lists the latency for all URLs combined. You can use this report to check that the latency threshold that you used is close to the value in the latency histogram column for all traffic.
- On the Main tab, click .
The URL Latencies reporting screen opens.
- From the Time Period list, select the time period for which you want to view URL latency, or specify a custom time range.
- If you want to filter the information by virtual server, DoS profile, URL, or detection criteria, specify the ones for which you want to view the URL latency, and click Filter.
By default, the report displays information for all items.
- Adjust the chart display options as you want.
| Display Option |
Description |
|---|
| Display Mode |
Select whether to display the information as Cumulative or as related to the respective latency range, Per Interval. |
| Unified Scale |
Select this check box to display all histograms using a single scale for all URLs, rather than a separate scale for each one. |
| Order by |
Select the order in which to display the statistics: by the average server latency, the number of transactions, the histogram latency ranges (in milliseconds), or by how heavy URLs were detected (automatically detected or manually set). |
- Review the latency statistics.
- The report shows the latency for the most active URLs.
- The Aggregated row summarizes the statistics for the URLs not included in the report.
- The Overall Summary shows the latency of all traffic.
- To focus in on the specific latency details for one row, click the latency histogram.
A magnified view of the histogram is displayed in a separate window. The latency histogram shows the percentage of transactions for each range of latency (0-2 ms, 2-4 ms, and so on up to 10000 ms or 10 seconds).
The URL Latencies report shows how fast your web application returns web pages and can show typical latency for applications (meaning virtual servers associated with a DoS profile) on your system. It can help you to identify slow pages with latency problems that may require additional troubleshooting by application developers.
You can also use the URL Latencies report for the following purposes:
- To determine the threshold latencies, especially the heaviness threshold.
Tip: Set the heaviness threshold to approximately 90-95% of the latency distribution for the site. Filter the data by site (that is, by virtual server and DoS profile), and check the latency distribution in the histogram of the Total row.
- To track the current heavy URLs. You can add or remove manually configured heavy URLs depending on the information in the report.
- To monitor the latency distribution.
Sample URL Latencies report
This figure shows a sample URL Latencies report for a system that has two DoS profiles and two virtual servers. It shows the latency for several web pages ranging from 10.97 ms to 2006.07 ms. One page (/DOS/latency2.php) has very high latency and might require some troubleshooting. In this case, the system determined that URL to be "heavy" based on traffic. While investigating the latency of URLs that take longer to display, if it is acceptable, you may decide to add them to the list of Ignored URLs in the DoS profile so they do not trigger DoS mitigation.
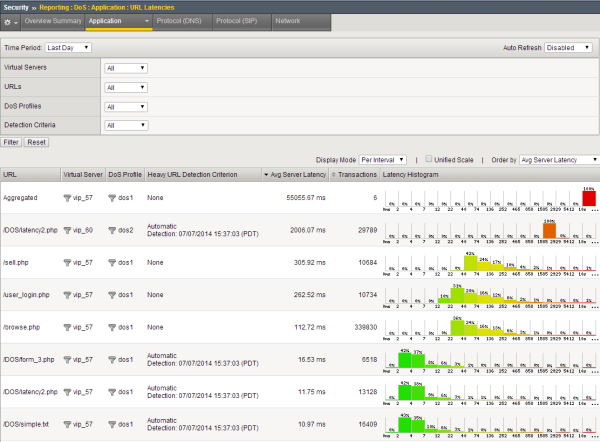
Sample URL Latencies report
Creating customized DoS reports
You can create a customized DoS reporting screen so that it shows the specific data you are interested in, such as the top DoS attacks and server latency.
- On the Main tab, click .
The DoS Custom Page screen opens, and shows default widgets (sections) you may find useful.
- Review the charts and tables provided, and click the configuration icon to adjust or delete them, as needed.
- To modify the widget and change what it displays, click the gear icon and select Settings. On the popup screen, adjust the values that control what is displayed.
- To remove the widget from the custom page, click the gear icon and select Delete.
- To create a new widget to your specifications, click Add Widget.
The Add New Widget popup screen opens where you can select custom options for what to include, the time frame, and how to display the information.
- Continue adjusting the custom page so that it shows the information you want.
You can drag and drop the widgets to change the order in which they are displayed. You can set the time range for all widgets or for each one separately.
- To save the information shown in the custom report to a file or email attachment, click Export and choose your options.
You can also export the data from a single widget by selecting Export from the configuration icon.
You have created a custom page that includes the information you need to monitor your system. As you use the reports to investigate DoS attacks, you can adjust the custom page to include additional data that you need. You can save the reports or send them to others who want to review the data.