Applies To:
Show Versions
BIG-IP GTM
- 11.6.5, 11.6.4, 11.6.3, 11.6.2, 11.6.1
Monitors Concepts
Purpose of monitors
Monitors determine the availability and performance of devices, links, and services on a network. Health monitors check the availability. Performance monitors check the performance and load. If a monitored device, link, or service does not respond within a specified timeout period, or the status indicates that performance is degraded or that the load is excessive, the BIG-IP® system can redirect the traffic to another resource.
Benefits of monitors
Monitors gather information about your network. The information that monitors gather is available for you to view. You can use this information to troubleshoot problems and determine what resources in your network are in need of maintenance or reconfiguration.
Methods of monitoring
The BIG-IP® Local Traffic Manager™, Global Traffic Manager™, and Link Controller™ provide three methods of monitoring: simple monitoring, active monitoring, and passive monitoring.
Simple monitoring
Simple monitoring determines whether the status of a resource is up or down. Simple monitors do not monitor pool members (and therefore, individual protocols, services, or applications on a node), but only the node itself. The system contains three simple monitors, Gateway ICMP, ICMP, and TCP_ECHO.
Simple monitors work well when you only need to determine the up or down status of the following:
- A Local Traffic Manager node
- A Global Traffic Manager or Link Controller server, virtual server, pool, pool member, or link
Active monitoring
Active monitoring checks the status of a pool member or node on an ongoing basis as specified. If a pool member or node does not respond within a specified timeout period, or the status of a node indicates that performance is degraded, the BIG-IP system can redirect the traffic to another pool member or node. There are many active monitors. Each active monitor checks the status of a particular protocol, service, or application. For example, one active monitor is HTTP. An HTTP monitor allows you to monitor the availability of the HTTP service on a pool, pool member, or node. A WMI monitor allows you to monitor the performance of a node that is running the Windows® Management Instrumentation (WMI) software. Active monitors fall into two categories: Extended Content Verification (ECV) monitors for content checks, and Extended Application Verification (EAV) monitors for service checks, path checks, and application checks.
An active monitor can check for specific responses, and run with or without client traffic.
Passive monitoring
Passive monitoring occurs as part of a client request. This kind of monitoring checks the health of a pool member based on a specified number of connection attempts or data request attempts that occur within a specified time period. If, after the specified number of attempts within the defined interval, the system cannot connect to the server or receive a response, or if the system receives a bad response, the system marks the pool member as down. There is only one passive monitor, called an Inband monitor.
A passive monitor creates no additional network traffic beyond the client request and server response. It can mark a pool member as down quickly, as long as there is some amount of network traffic.
Comparison of monitoring methods
In the short description, briefly describe the purpose and intent of the information contained in this topic. This element is an F5® requirement.
| Monitoring Method | Benefits | Constraints |
|---|---|---|
| Simple |
|
|
| Active |
|
|
| Passive |
|
|
Monitor destinations
By default, the value for the Alias Address setting in the monitors is set to the wildcard * Addresses, and the Alias Service Port setting is set to the wildcard * Ports. This value causes the monitor instance created for a pool, pool member, or node to take that node’s address or address and port as its destination. You can, however, replace either or both wildcard symbols with an explicit destination value, by creating a custom monitor. An explicit value for the Alias Address and/or Alias Service Port setting is used to force the instance destination to a specific address and/or port which might not be that of the pool, pool member, or node.
The ECV monitor types HTTP, HTTPS, and TCP include the settings Send String and Receive String for the send string and receive expression, respectively.
The most common Send String value is GET /, which retrieves a default HTML page for a web site. To retrieve a specific page from a web site, you can enter a Send String value that is a fully qualified path name:
"GET /www/support/customer_info_form.html"
The Receive String value is the text string that the monitor looks for in the returned resource. The most common Receive String values contain a text string that is included in a particular HTML page on your site. The text string can be regular text, HTML tags, or image names.
The sample Receive String value below searches for a standard HTML tag:
"<HEAD>"
You can also use the default null Receive String value [""]. In this case, any content retrieved is considered a match. If both the Send String and Receive String fields are left empty, only a simple connection check is performed.
For HTTP and FTP monitor types, you can use the special values GET or hurl in place of Send String and Receive String values. For FTP monitors specifically, the GET value should specify the full path to the file to retrieve.
About monitor settings
Every monitor consists of settings with values. The settings and their values differ depending on the type of monitor. In some cases, the BIG-IP® system assigns default values. This example shows that an HTTP-type monitor has these settings and default values.
The settings specify that an HTTP type of monitor is configured to check the status of an IP address every 30 seconds, and to time out every 5 seconds. The destination IP address that the monitor checks is specified by the Alias Address setting, with the value * All Addresses. Thus, in the example, all IP addresses with which the monitor is associated are checked.
Name my_http
Type HTTP
Interval 30
Timeout 5
Transparent No
Alias Address * All Addresses
Transparent and Reverse modes
The normal and default behavior for a monitor is to ping the destination pool, pool member, or node by an unspecified route, and to mark the node up if the test is successful. However, with certain monitor types, you can specify a route through which the monitor pings the destination server. You configure this by specifying the Transparent or Reverse setting within a custom monitor.
Transparent setting
Sometimes it is necessary to ping the aliased destination through a transparent pool, pool member, or node. When you create a custom monitor and set the Transparent setting to Yes, the BIG-IP® system forces the monitor to ping through the pool, pool member, or node with which it is associated (usually a firewall) to the pool, pool member, or node. (That is, if there are two firewalls in a load balancing pool, the destination pool, pool member, or node is always pinged through the pool, pool member, or node specified; not through the pool, pool member, or node selected by the load balancing method.) In this way, the transparent pool, pool member, or node is tested: if there is no response, the transparent pool, pool member, or node is marked as down.
Common examples are checking a router, or checking a mail or FTP server through a firewall. For example, you might want to check the router address 10.10.10.53:80 through a transparent firewall 10.10.10.101:80. To do this, you create a monitor called http_trans in which you specify 10.10.10.53:80 as the monitor destination address, and set the Transparent setting to Yes. Then you associate the monitor http_trans with the transparent pool, pool member, or node.
This causes the monitor to check the address 10.10.10 53:80 through 10.10.10.101:80. (In other words, the BIG-IP system routes the check of 10.10.10.53:80 through 10.10.10.101:80.) If the correct response is not received from 10.10.10.53:80, then 10.10.10.101:80 is marked down.
Reverse setting
With the Reverse setting set to Yes, the monitor marks the pool, pool member, or node down when the test is successful. For example, if the content on your web site home page is dynamic and changes frequently, you may want to set up a reverse ECV service check that looks for the string "Error". A match for this string means that the web server was down.
Monitors that contain the Transparent or Reverse settings
This table shows the monitors that contain either the Transparent setting or both the Reverse and Transparent settings.
| Monitor Type | Settings |
|---|---|
| TCP | Transparent and Reverse |
| HTTP | Transparent and Reverse |
| HTTPS | Transparent and Reverse |
| Gateway ICMP | Transparent |
| TCP Half Open | Transparent |
| UDP | Transparent |
The Manual Resume feature
By default, when a monitor detects that a resource (that is, a node or a pool member) is unavailable, the BIG-IP® system marks the resource as down and routes traffic to the next appropriate resource as dictated by the active load balancing method. When the monitor next determines that the resource is available again, the BIG-IP system marks the resource as up and immediately considers the resource to be available for load balancing connection requests. While this process is appropriate for most resources, there are situations where you want to manually designate a resource as available, rather than allow the BIG-IP system to do that automatically. You can manually designate a resource as available by configuring the Manual Resume setting of the monitor.
For example, consider a monitor that you assigned to a resource to track the availability of an HTML file, index.html, for a web site. During the course of a business day, you decide that you need to restart the system that hosts the web site. The monitor detects the restart action and informs the BIG-IP system that the resource is now unavailable. When the system restarts, the monitor detects that the index.html file is available, and begins sending connection requests to the web site. However, the rest of the web site might not be ready to receive connection requests. Consequently, the BIG-IP system sends connection requests to the web site before the site can respond effectively.
To prevent this problem, you can configure the Manual Resume setting of the monitor. When you set the Manual Resume setting to Yes, you ensure that the BIG-IP system considers the resource to be unavailable until you manually enable that resource.
Resumption of connections
If you have a resource (such as a pool member or node) that a monitor marked as down, and the resource has subsequently become available again, you must manually re-enable that resource if the monitor’s Manual Resume setting is set to Yes. Manually re-enabling the resource allows the BIG-IP® system to resume sending connections to that resource.
The procedure for manually re-enabling a resource varies depending on whether the resource is a pool, a pool member, or a node.
The Time Until Up feature
By default, the BIG-IP® system marks a pool member or node as up immediately upon receipt of the first correct response to a ping command.
The Time Until Up feature provides a way to adjust the default behavior. This feature allows the system to delay the marking of a pool member or node as up for some number of seconds after receipt of the first correct response. The purpose of this feature is to ensure that the monitor marks the pool member or node as up only after the pool member or node has consistently responded correctly to the BIG-IP system during the defined time period. With this feature, you ensure that a pool member or node that is available only momentarily, after sending one correct response, is not marked as up.
A Time Until Up value of 0 causes the default behavior. When the Time Until Up value is a non-0 value, the BIG-IP system marks a pool member or node as up only when all pool member or node responses during the Time Until Up period are correct.
About health and performance monitors
BIG-IP® systems use two categories of monitors: health monitors and performance monitors. You can associate monitors with the following resources:
- In Local Traffic Manager™: nodes, pools, and pool members
- In Global Traffic Manager™: links, servers, virtual servers, pools, and pool members
- In Link Controller™: links, pools, and pool members
| Category | Description |
|---|---|
| Health | Checks resources to determine if they are up and functioning for a given service. |
| Performance | Gathers information about resources that the system uses to dynamically load balance traffic. |
When a virtual server that is being monitored by a health monitor does not respond to a probe from the BIG-IP system within a specified timeout period, the system marks the virtual server down and no longer load balances traffic to that virtual server. When the health monitor determines that the virtual server is once again responsive, the system again begins to load balance traffic to that virtual server. To illustrate, a Gateway Internet Control Message Protocol (ICMP) monitor pings a virtual server. If the monitor does not receive a response from the virtual server, the BIG-IP system marks that virtual server down. When the ping is successful, the system marks the virtual server up.
When a server that is being monitored by a performance monitor displays a degradation in performance, the BIG-IP system redirects traffic to other resources until the performance of the server returns to normal. To illustrate, an SNMP Link monitor checks the current CPU, memory, and disk usage of a server that is running an SNMP data collection agent, and then dynamically load balances traffic based on the performance of the server.
About address check monitors
An address check monitor provides a simple verification of an address on a network. This type of monitor sends a request to an IP address. When a response is received, the test is successful.
With Global Traffic Manager™ , you can use an address check monitor to monitor a virtual server, a server (which includes all of the virtual servers on a specified server), a pool member, a pool (which includes all of the pool members of a specified pool), or a link. This monitor uses the Gateway Internet Control Message Protocol (ICMP) to perform a simple resource check. The check is successful if the monitor receives a response to an ICMP_ECHO datagram.
The following illustration depicts a Global Traffic Manager™ using a Gateway ICMP monitor to verify an IP address for a virtual server.
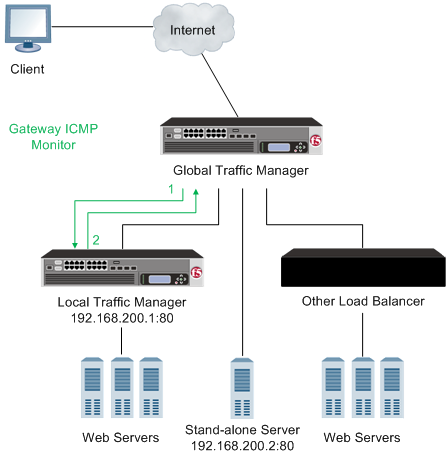
Global Traffic Manager using a Gateway ICMP monitor
- Global Traffic Manager sends an ICMP echo request to a virtual server.
- An ICMP echo response is received.
About application check monitors
An application check monitor interacts with servers by sending multiple commands and processing multiple responses.
An FTP monitor, for example, connects to a server, logs in by using a user ID and password, navigates to a specific directory, and then downloads a specific file to the /var/tmp directory. If the file is retrieved, the check is successful.
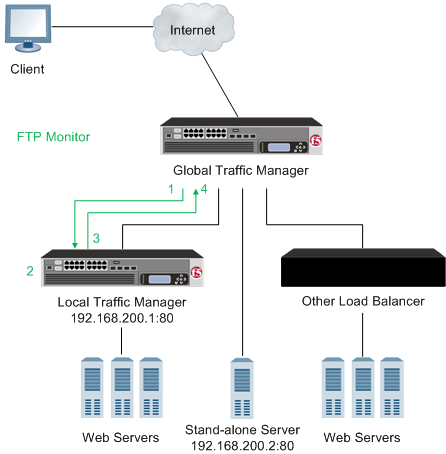
An application check monitor
- Global Traffic Manager opens a TCP connection to an IP address and port, and logs in to the server.
- A specified directory is located and a specific file is requested.
- The server sends the file to Global Traffic Manager.
- Global Traffic Manager receives the file and closes the TCP connection.
About content check monitors
A content check monitor determines whether a service is available and whether the server is serving the appropriate content. This type of monitor opens a connection to an IP address and port, and then issues a command to the server. The response is compared to the monitor's receive rule. When a portion of the server's response matches the receive rule, the test is successful.

A content check monitor
- Global Traffic Manager™ opens a TCP connection to an IP address and port, and issues a command to the server.
- The server sends a response.
- Global Traffic Manager compares the response to the monitor's receive rule and closes the connection.
About path check monitors
A path check monitor determines whether traffic can flow through a device to an endpoint. A path check monitor is successful when network paths through firewalls or routers are available.
The following illustration depicts a Global Traffic Manager™ using a Gateway ICMP monitor to verify a path to a virtual server.
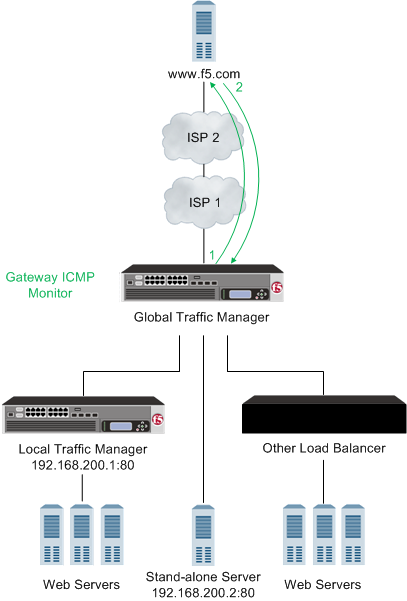
Global Traffic Manager using a Gateway ICMP monitor
- With the Gateway ICMP monitor Transparent option set to Yes, Global Traffic Manager sends an ICMP echo request to a virtual server.
- An ICMP echo response is received.
About performance check monitors
A performance check monitor interacts with a link or server to acquire information about the resource load and the condition of the virtual servers on the server.
On Global Traffic Manager™, you assign the BIG-IP Link monitor to link entries. This monitor gathers data from the gateway pool about the flow of the outbound traffic passing through the links.

A performance check monitor
- The BIG-IP Link monitor gathers data from the gateway pool.
- Global Traffic Manager evaluates the health of the link and makes a determination about load balancing traffic to the link.
About service check monitors
A service check monitor determines whether a service is available. This type of monitor opens a connection to an IP address and port, and then closes the connection. When the TCP connection is established, the test is successful.
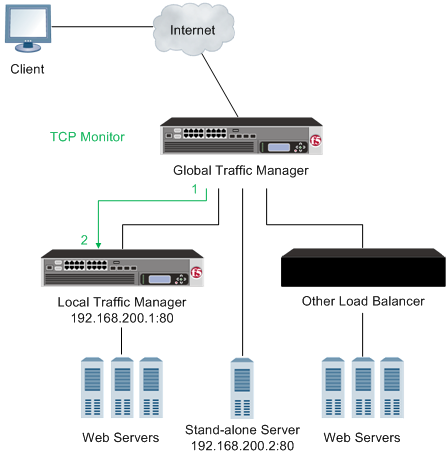
A service check monitor
- Global Traffic Manager™ opens a TCP connection to an IP address and port.
- The TCP connection is closed.
About resources and monitor queries
Network resources often perform different functions at the same time. Therefore, it is likely that multiple monitors are checking the availability of a single resource in different ways.
Example:
A BIG-IP® system may monitor a single resource to verify that the connection to the resource is available, that a specific HTML page on the resource can be reached, and that a database query returns an expected result.About the Virtual Location monitor
The Virtual Location monitor optimizes the way that the BIG-IP® system manages connections to pool members by assigning priority groups to local and remote pool members.
The monitor determines whether a pool member is local (residing in the same data center as the BIG-IP system) or remote (residing in a different data center). If a pool member is local, the monitor sets the priority group of the pool member to a higher priority. If a pool member is remote, the monitor sets the priority group of the pool member to a lower priority.
Overview of monitor implementation
You implement monitors by using either the BIG-IP® Configuration utility or a command line utility. The task of implementing a monitor varies depending on whether you are using a preconfigured monitor or creating a custom monitor. A preconfigured monitor is an existing monitor that BIG-IP system provides for you, with its settings already configured. A custom monitor is a monitor that you create based on one of the allowed monitor types.
If you want to implement a preconfigured monitor, you need only associate the monitor with a pool, pool member, or node, and then configure the virtual server to reference the relevant pool. If you want to implement a custom monitor, you must first create the custom monitor. Then you can associate the custom monitor with a pool, pool member, or node, and configure the virtual server to reference the pool.
Preconfigured monitors
For a subset of monitor types, the BIG-IP® system includes a set of preconfigured monitors. You cannot modify preconfigured monitor settings, as they are intended to be used as is. The purpose of a preconfigured monitor is to eliminate the need for you to explicitly create a monitor. You use a preconfigured monitor when the values of the settings meet your needs as is.
Preconfigured monitors include the following entries.
- bigip
- bigip_link
- gateway_icmp
- gtp
- http
- http_head_f5
- https
- https_head_f5
- tcp
- tcp_half_open
An example of a preconfigured monitor is the http monitor. The example shows the http monitor, with values configured for its Interval, Timeout, and Alias Address settings. Note that the Interval value is 30, the Timeout value is 120, the Transparent value is No, and the Alias Address value is * All Addresses.
If the Interval, Timeout, Transparent, and Alias Address values meet your needs, you simply assign the http preconfigured monitor directly to a server, virtual server, pool, pool member, or link. In this case, you do not need to use the Monitors screens, unless you simply want to view the values of the preconfigured monitor settings.
   Name http
   Type HTTP
   Interval 30
   Timeout 120
   Transparent No
   Alias Address * All Addresses
Custom monitors
You create a custom monitor when the values defined in a preconfigured monitor do not meet your needs, or no preconfigured monitor exists for the type of monitor you are creating.
When you create a custom monitor, you use the BIG-IP® Configuration utility or a command line utility to: give the monitor a unique name, specify a monitor type, and, if a monitor of that type already exists, import settings and their values from the existing monitor. You can then change the values of any imported settings.
You must base each custom monitor on a monitor type. When you create a monitor, the BIG-IP Configuration utility displays a list of monitor types. To specify a monitor type, simply choose the one that corresponds to the service you want to check. For example, if you want to want to create a monitor that checks the health of the HTTP service on a pool, you choose HTTP as the monitor type.
If you want to check more than one service on a pool or pool member (for example HTTP and HTTPS), you can associate more than one monitor on that pool or pool member.
Checking services is not the only reason for implementing a monitor. If you want to verify only that the destination IP address is alive, or that the path to it through a transparent node is alive, use a simple monitor, such as gateway_icmp. Or, if you want to verify TCP only, use the monitor tcp.
Importing settings from a preconfigured monitor
If a preconfigured monitor exists that corresponds to the type of custom monitor you are creating, you can import the settings and values of that preconfigured monitor into the custom monitor. You are then free to change those setting values to suit your needs. For example, if you create a custom monitor called my_gateway_icmp, the monitor can inherit the settings and values of the preconfigured monitor gateway_icmp. This ability to import existing setting values is useful when you want to retain some setting values for your new monitor but modify others.
The example shows a custom ICMP-type monitor called my_gateway_icmp, which is based on the preconfigured monitor gateway_icmp. Note that the Interval value is changed to 20, and the Timeout value is 100. The other settings retain the values defined in the preconfigured monitor.
Name my_gateway_icmp
Type Gateway ICMP
Interval 20
Timeout 100
Transparent No
Alias Address * All Addresses
Importing settings from a custom monitor
You can import settings from another custom monitor instead of from a preconfigured monitor. This is useful when you would rather use the setting values defined in another custom monitor, or when no preconfigured monitor exists for the type of monitor you are creating. For example, if you create a custom monitor called my_oracle_server2, you can import settings from another custom Oracle-type monitor that you created, such as my_oracle_server1. Selecting a monitor is straightforward. Like gateway_icmp, each of the monitors has a Type setting based on the type of service it checks, for example, http, https, ftp, pop3, and a Parent Monitor that is used for importing the custom monitor settings. (Exceptions are port-specific monitors, like the external monitor, which calls a user-supplied program.)
Monitor instances
When you associate a monitor with a server, the BIG-IP® system automatically creates an instance of that monitor for that server. A monitor association thus creates an instance of a monitor for each server that you specify. This means that you can have multiple instances of the same monitor running on your servers.
Because instances of monitors are not partitioned objects, a user can enable or disable an instance of a monitor without having permission to manage the associated pool or pool member.
For example, a user with the Manager role, who can access partition AppA only, can enable or disable monitor instances for a pool that resides in partition Common. However, that user cannot perform operations on the pool or pool members that are associated with the monitor. Although this is correct functionality, the user might not expect this behavior. You can prevent this unexpected behavior by ensuring that all pools and pool members associated with monitor instances reside in the same partition.


