Applies To:
Show Versions
BIG-IP AAM
- 13.0.1, 13.0.0
BIG-IP APM
- 13.0.1, 13.0.0
BIG-IP LTM
- 13.0.1, 13.0.0
BIG-IP AFM
- 13.0.1, 13.0.0
BIG-IP ASM
- 13.0.1, 13.0.0
Overview: Diagnosing IPsec tunnel issues
Using the browser interface, you can diagnose problems with the IPsec tunnels you create on the BIG-IP® system. The IPsec diagnostics search capability facilitates quick retrieval of data, even when you have a large number of IPsec tunnels. The search results list the traffic selector that meets your criteria. You can search on source IP address, destination IP address, both source and destination IP addresses, IPsec policy name, or traffic selector name.
To search on the source or destination IP address of a traffic selector, you can type either a valid IPv4 or valid IPv6 address. The BIG-IP system currently finds only exact matches for IP addresses. To use a route domain ID for a non-default route domain, that is, a route domain other than 0, append the character % and the route domain ID number to the end of the IP address. For example, to use route domain 2 with an IPv4 address of 1.1.1.1, you would type 1.1.1.1%2. For the default route domain (0), do not append any additional characters to the IP address.
Viewing the IPsec diagnostics
IPsec Diagnostics Example
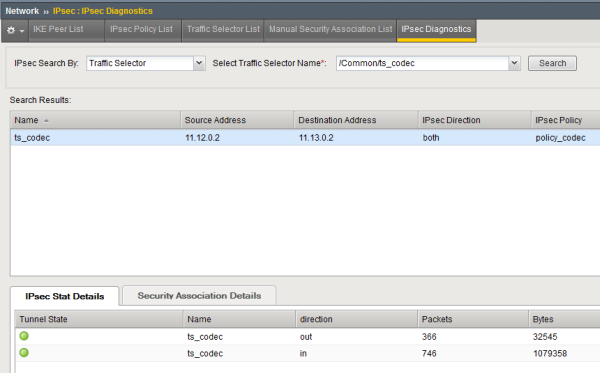
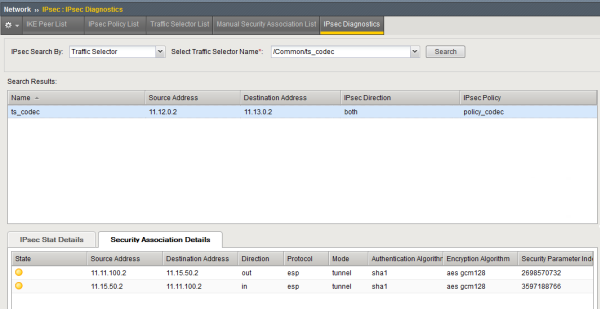
These examples show the diagnostic details that are available as the result of an IPsec traffic selector search.
The color of the icon in the Tunnel State or security association (SA) State column indicates the condition of the connection.
- Green indicates that the tunnel is up and running.
- Blue indicates that the SA is in the negotiating phase, before the tunnel is up.
- Yellow indicates that the SA is still valid, but will be deleted soon.
- Red indicates that the tunnel is down.

Example of IPsec Stat Details tab diagnostics

Example of IPsec Security Association Details tab diagnostics


