Applies To:
Show Versions
BIG-IP LTM
- 11.5.10, 11.5.9, 11.5.8, 11.5.7, 11.5.6, 11.5.5, 11.5.4, 11.5.3, 11.5.2, 11.5.1
Purpose of monitors
Monitors determine the availability and performance of devices, links, and services on a network. Health monitors check the availability. Performance monitors check the performance and load. If a monitored device, link, or service does not respond within a specified timeout period, or the status indicates that performance is degraded or that the load is excessive, the BIG-IP® system can redirect the traffic to another resource.
Benefits of monitors
Monitors gather information about your network. The information that monitors gather is available for you to view. You can use this information to troubleshoot problems and determine what resources in your network are in need of maintenance or reconfiguration.
Methods of monitoring
The BIG-IP® Local Traffic Manager™, Global Traffic Manager™, and Link Controller™ provide three methods of monitoring: simple monitoring, active monitoring, and passive monitoring.
Simple monitoring
Simple monitoring determines whether the status of a resource is up or down. The system contains three simple monitors, Gateway ICMP, ICMP, and TCP_ECHO.
Simple monitors work well when you only need to determine the up or down status of the following:
- A Local Traffic Manager node
- A Global Traffic Manager or Link Controller server, virtual server, pool, pool member, or link
Active monitoring
Active monitoring checks the status of a pool member or node on an ongoing basis as specified. If a pool member or node does not respond within a specified timeout period, or the status of a node indicates that performance is degraded, the BIG-IP system can redirect the traffic to another pool member or node. There are many active monitors. Each active monitor checks the status of a particular protocol, service, or application. For example, one active monitor is HTTP. An HTTP monitor allows you to monitor the availability of the HTTP service on a pool, pool member, or node. A WMI monitor allows you to monitor the performance of a node that is running the Windows® Management Instrumentation (WMI) software. Active monitors fall into two categories: Extended Content Verification (ECV) monitors for content checks, and Extended Application Verification (EAV) monitors for service checks, path checks, and application checks.
An active monitor can check for specific responses, and run with or without client traffic.
Passive monitoring
Passive monitoring occurs as part of a client request. This kind of monitoring checks the health of a pool member based on a specified number of connection attempts or data request attempts that occur within a specified time period. If, after the specified number of attempts within the defined interval, the system cannot connect to the server or receive a response, or if the system receives a bad response, the system marks the pool member as down. There is only one passive monitor, called an Inband monitor.
A passive monitor creates no additional network traffic beyond the client request and server response. It can mark a pool member as down quickly, as long as there is some amount of network traffic.
About health and performance monitors
BIG-IP® systems use two categories of monitors: health monitors and performance monitors. You can associate monitors with the following resources:
- In Local Traffic Manager™: nodes, pools, and pool members
- In Global Traffic Manager™: links, servers, virtual servers, pools, and pool members
- In Link Controller™: links, pools, and pool members
| Category | Description |
|---|---|
| Health | Checks resources to determine if they are up and functioning for a given service. |
| Performance | Gathers information about resources that the system uses to dynamically load balance traffic. |
Example:
When a virtual server that is being monitored by a health monitor does not respond to a probe from the BIG-IP system within a specified timeout period, the system marks the virtual server down and no longer load balances traffic to that virtual server. When the health monitor determines that the virtual server is once again responsive, the system again begins to load balance traffic to that virtual server. To illustrate, a Gateway Internet Control Message Protocol (ICMP) monitor pings a virtual server. If the monitor does not receive a response from the virtual server, the BIG-IP system marks that virtual server down. When the ping is successful, the system marks the virtual server up.
When a server that is being monitored by a performance monitor displays a degradation in performance, the BIG-IP system redirects traffic to other resources until the performance of the server returns to normal. To illustrate, an SNMP Link monitor checks the current CPU, memory, and disk usage of a server that is running an SNMP data collection agent, and then dynamically load balances traffic based on the performance of the server.
About address check monitors
An address check monitor provides a simple verification of an address on a network. This type of monitor sends a request to a virtual server. When a response is received, the test is successful.
When an address check monitor is associated with a node, it determines the availability of all services associated with that node's IP address. If the monitor is unsuccessful in determining that a node is available, the monitor marks the node and all pool members at that IP address as Offline.
The following illustration depicts a Local Traffic Manager™ using a TCP Echo monitor to verify an IP address for a virtual server.

- Local Traffic Manager sends a TCP echo request to a virtual server.
- A TCP echo response is received.
About application check monitors
An application check monitor interacts with servers by sending multiple commands and processing multiple responses.
An FTP monitor, for example, connects to a server, logs in by using a user ID and password, navigates to a specific directory, and then downloads a specific file to the /var/tmp directory. If the file is retrieved, the check is successful.
 An application check monitor
- Local Traffic Manager opens a TCP connection to an IP address and port, and logs in to the server.
- A specified directory is located and a specific file is requested.
- The server sends the file to Local Traffic Manager.
- Local Traffic Manager receives the file and closes the TCP connection.
About content check monitors
A content check monitor determines whether a service is available and whether the server is serving the appropriate content. This type of monitor opens a connection to an IP address and port, and then issues a command to the server. The response is compared to the monitor's receive rule. When a portion of the server's response matches the receive rule, the test is successful.
 A content check monitor
- Local Traffic Manager™ opens a TCP connection to an IP address and port, and issues a command to the server.
- The server sends a response.
- Local Traffic Manager compares the response to the monitor's receive rule and closes the connection
About path check monitors
A path check monitor determines whether traffic can flow through a device to an endpoint. A path check monitor is successful when network paths through firewalls or routers are available.
The following illustration depicts Local Traffic Manager™ using a TCP Echo monitor to verify a path to a virtual server.
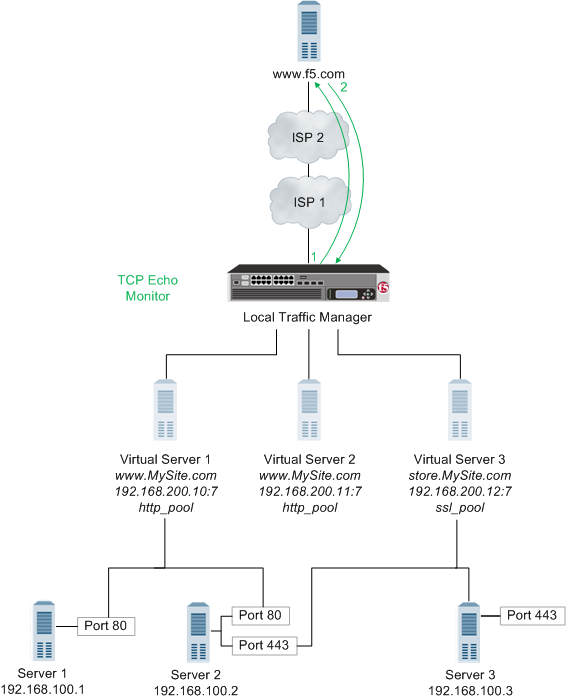 Local Traffic Manager using a TCP Echo monitor
- With the TCP Echo monitor Transparent option set to Yes, Local Traffic Manager sends a TCP Echo request to a virtual server.
- A TCP Echo response is received.
About performance check monitors
A performance check monitor interacts with servers to determine the server load, and to acquire information about the condition of virtual servers.
An SNMP DCA monitor, for example, checks the current CPU, memory, and disk usage of a pool, pool member, or node that is running an SNMP data collection agent, and then dynamically load balances traffic accordingly.
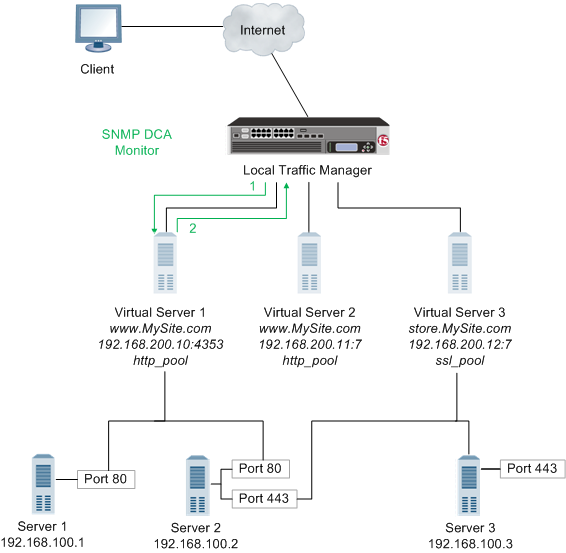 A performance check monitor
- Local Traffic Manager™ connects with a server to acquire data.
- The server sends the data to Local Traffic Manager for evaluation and determination of load balancing.
About service check monitors
A service check monitor determines whether a service is available. This type of monitor opens a connection to an IP address and port, and then closes the connection. When the TCP connection is established, the test is successful.
When a service check monitor is associated with pool members, it determines the availability of a service. If the monitor is unsuccessful in determining that a pool member is available, the monitor marks the pool member as Offline and no requests are sent to that pool member.
 A service check monitor
- Local Traffic Manager™ opens a TCP connection to an IP address and port.
- The TCP connection is closed.
About resources and monitor queries
Network resources often perform different functions at the same time. Therefore, it is likely that multiple monitors are checking the availability of a single resource in different ways.
Example:
A BIG-IP® system may monitor a single resource to verify that the connection to the resource is available, that a specific HTML page on the resource can be reached, and that a database query returns an expected result.About the Virtual Location monitor
The Virtual Location monitor optimizes the way that the BIG-IP® system manages connections to pool members by assigning priority groups to local and remote pool members.
The monitor determines whether a pool member is local (residing in the same data center as the BIG-IP system) or remote (residing in a different data center). If a pool member is local, the monitor sets the priority group of the pool member to a higher priority. If a pool member is remote, the monitor sets the priority group of the pool member to a lower priority.


