Manual Chapter : Viewing vCMP Statistics

Applies To:

Show Versions Show Versions

BIG-IP AAM

  • 13.1.5, 13.1.4, 13.1.3, 13.1.1, 13.1.0

BIG-IP APM

  • 13.1.5, 13.1.4, 13.1.3, 13.1.1, 13.1.0

BIG-IP Link Controller

  • 13.1.5, 13.1.4, 13.1.3, 13.1.2, 13.1.1, 13.1.0

BIG-IP Analytics

  • 13.1.5, 13.1.4, 13.1.3, 13.1.1, 13.1.0

BIG-IP LTM

  • 13.1.5, 13.1.4, 13.1.3, 13.1.1, 13.1.0

BIG-IP AFM

  • 13.1.5, 13.1.4, 13.1.3, 13.1.1, 13.1.0

BIG-IP PEM

  • 13.1.5, 13.1.4, 13.1.3, 13.1.1, 13.1.0

BIG-IP DNS

  • 13.1.5, 13.1.4, 13.1.3, 13.1.1, 13.1.0

BIG-IP ASM

  • 13.1.5, 13.1.4, 13.1.3, 13.1.1, 13.1.0
Manual Chapter

Overview: Viewing vCMP statistics

After creating vCMP® guests to process application traffic, you can display vCMP statistics to better manage performance.

Viewing virtual disk statistics

Using the BIG-IP® Configuration utility, you can view information about the virtual disks that are currently allocated to vCMP® guests:
  • The virtual disk names
  • The slot number corresponding to each virtual disk image
  • The size in gigabytes of each virtual disk
  • The name of the guest to which each virtual disk is currently allocated
  1. On the Main tab, click vCMP > Virtual Disk List .
  2. Locate the Virtual Disk List area of the screen.

The following table shows sample statistics for three separate virtual disks.

Virtual Disk Name Slot ID Operating System Status Disk use
GuestA.img 1 TMOS Ready 64.4G
GuestB.img 1 Unknown Unknown 64.4G
GuestC.img 1 TMOS Ready 64.4G

Viewing vCMP guest information

Before viewing a list of vCMP guests, you must be logged in to the vCMP host.
Using the BIG-IP® Configuration utility, you can list the names of, and information about, the vCMP® guests that are currently on the system.
  1. On an external system, open a browser window and access the vCMP host, using the vCMP host's management IP address.
    This displays the login window for the BIG-IP Configuration utility.
  2. Using your user credentials, log in to the BIG-IP Configuration utility.
  3. On the Main tab, click vCMP > Guest List .
The system displays a list of vCMP guest names, as well as this information:
  • The state configured for each guest
  • The number of cores allocated to each guest
  • The slot numbers on which each guest is running or slated to run
  • The management IP address and netmask for each guest
  • The minimum number of slots allocated to each guest
  • The slot numbers on which each guest is allowed to run

Viewing current vCMP guest statistics

Before viewing vCMP® statistics, you must be logged in to the vCMP host.
You can review current vCMP statistics for all guests on the BIG-IP® system. The information shown includes the guest name, bytes, packets, multicast packets, dropped packets, average CPU use, and slot information.
  1. On the Main tab, click VCMP > Statistics .
    The vCMP Guest screen opens and summarizes vCMP activity on the system.
  2. You can adjust the display options to change the data format.

Viewing srTCM policier statistics for vCMP guests

Before performing this task, confirm that you have created a single rate three-color marker (srTCM) policer and assigned the policer to a vCMP guest.
You can use this task to view throughput statistics associated with an srTCM policer and its associated guests.
  1. On the vCMP host, open the Traffic Management shell (TMSH).
  2. At the tmsh command-line prompt, type: show net rate-shaping sr-tcm-policer.
    This command sequence displays statistics for each srTCM policier on the system and its associated guest.
  3. View the results.
    The following shows sample srTCM statistics for a policer named standardSLA that is associated with guest myGuest:
    ---------------------------------------------------
    Net::Rate srTCM: standardSLA      
    ---------------------------------------------------
        Settings                   CIR  CBS  EBS
        limits                  50Mbps  10M  20M
        Statistics            
    ---------------------------------------------------
        VCMP Guest              Green Yellow Red Dropped
        myGuest                 53.9K 12.1K 5.1K    5.1K 

Viewing statistics for physical disk usage

Using the BIG-IP® Configuration utility, you can view information about usage of the physical disk on a vCMP® system:
  • Disk name
  • The slot numbers corresponding to the disk name
  • The number of virtual disks
  • The total vCMP application volume size, in gigabytes
  • The available vCMP application volume size, in gigabytes
  1. On the Main tab, click vCMP > Virtual Disk List .
  2. Locate the Disk Usage area of the screen.

The following table shows sample statistics.

Disk Slot ID Number of Virtual Disks Total Volume Size (GB) Available Volume Size (GB)
HD1 2 1 84 14

Viewing historical statistics about vCMP

To view vCMP® statistics, you must be logged in to the Virtual Clustered Multiprocessing™ (vCMP) host.
You can review detailed historical vCMP statistics in graphical form on the BIG-IP® system. The statistics provide an overview of vCMP performance, network throughput, CPU usage, and disk usage over time.
  1. On the Main tab, click Statistics > Analytics > vCMP .
    The vCMP Overview screen opens and summarizes vCMP activity on the system.
  2. You can change the time period for which to examine statistics; adjust the time for each widget or for all widgets (using the override time range).
  3. If you want to add new information to the Overview screen, click Add Widget.
    The Add New Widget popup screen opens.
  4. Specify the page, information, range, the details, and measurements to display, and click Done.
    A new widget with your specifications is added to the vCMP Overview.
  5. From the menu bar, select the type of vCMP statistics you want to view.
    Select this option To see these vCMP statistics
    Overview Top statistical information about vCMP traffic on your system, such as the top vCMP guests by average CPU usage. You can customize the information that is displayed by adding widgets that show the information you want from the other screens.
    Network Average throughput or bytes in or out per vCMP guest, interface, or chassis slot.
    CPU Usage Average CPU usage per vCMP guest or chassis slot.
    Disk Usage Average bytes or requests read or written per vCMP guest or chassis slot.
  6. From the View By list, select the item for which to display statistics.
    Tip: You can also click Expand Advanced Filters to filter the information that displays.
  7. You can select a different time for which to view the statistics, and you can also customize the Time Period by marking the appropriate zone one line chart using the mouse (hold and draw to select the required period).
  8. To focus in on the specific details you want more information about, click the chart, an item in the details list, or the pie chart on the right (for some entities).
    For example, if you are displaying information about vCMP Guests, you can click one of the guests to display a chart that shows details about that guest.
    As you drill down into the statistics, you can locate more details and view information about a specific item on the charts.
  9. If you want to export the information in any of the charts, click Export and specify your options for how and where to send the data.
    To send reports by email, the system requires an SMTP configuration.
The statistics show an overview of vCMP performance: network throughput, CPU usage, and disk usage. The data can be displayed per guest, interface, or chassis slot depending on the selected statistics page. Review the vCMP statistics to understand how the guests and chassis are using resources on the system. As a result, you become more familiar with the system and its resource utilization, and you can troubleshoot the system as needed.

Sample vCMP Statistics reports

This figure shows a sample vCMP® Statistics report showing a system on which there are two guests. The chart shows the average CPU usage for the guests over the past day.
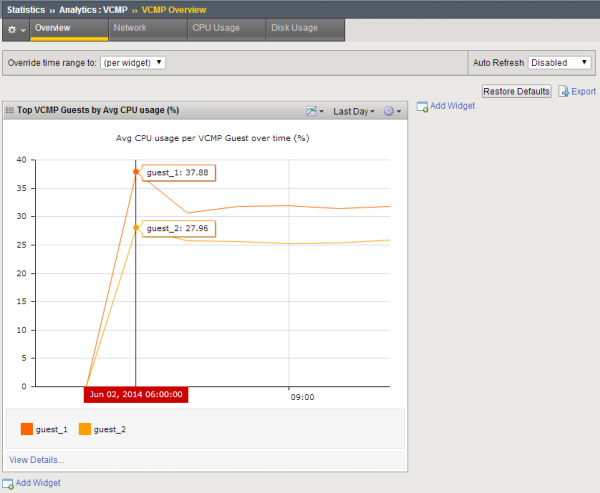
Sample vCMP Overview

Sample vCMP Overview

You can view other statistics, such as network statistics, by clicking items on the menu bar. This figure shows network statistics for vCMP guests during the last hour, but you can also view statistics by vCMP interfaces or chassis slots. You can also change the time frame for which to view the statistics.
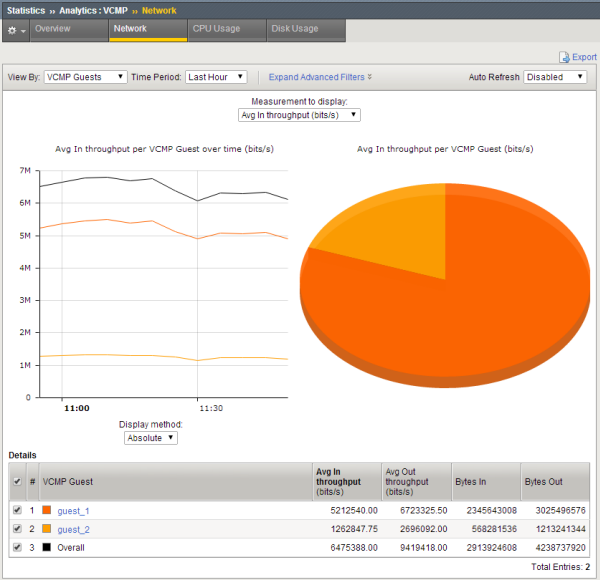
Sample vCMP Network statistics

Sample vCMP Network statistics

By clicking guest_1 in the table below the chart, you can drill down to see what is happening for that guest. For example, here you can see the throughput for each of the interfaces on guest_1.
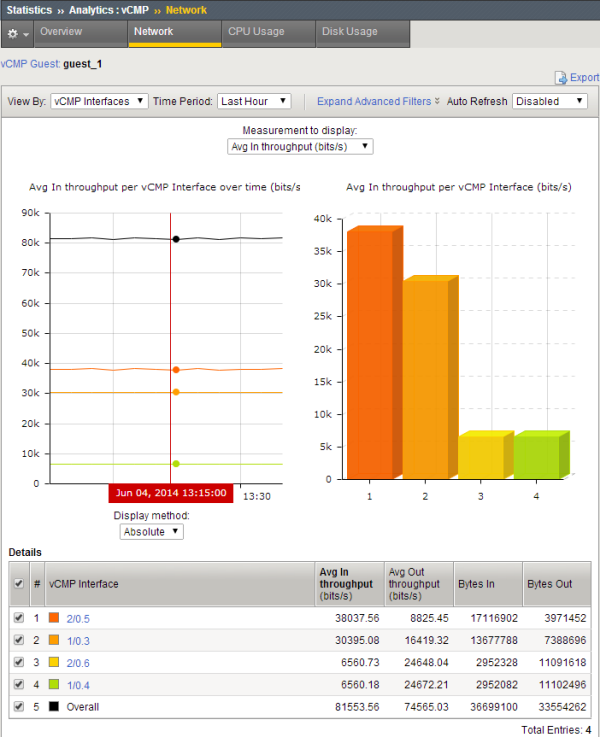
Sample Network statistics after drill down

Sample vCMP Network statistics after drill down

You can further drill down by clicking an interface to see additional details, or view CPU or disk usage by clicking the menu bar.