Manual Chapter : Access Reporting and Statistics

Applies To:

Show Versions Show Versions

BIG-IQ Centralized Management

  • 5.3.0
Manual Chapter

About Access and SWG reports

Access reports focus on session and logging data from Access devices (managed devices with APM licensed and provisioned). F5® Secure Web Gateway Services reports focus on user requests (for URLs or applications, for example) from Access devices with Secure Web Gateway Services provisioned. BIG-IQ® Centralized Management Access also supports high availability. Thus, users can view both Access and SWG reports on a secondary BIG-IQ system.

Access reports and SWG reports provide the following features.

  • Reports on any combination of discovered devices, Access groups, and clusters
  • Graphs for typical areas of concern and interest, such as cross-geographical comparisons or top 10 issues
  • Tabular data to support the graphs
  • Ability in some screens to drill down from summarized data to details
  • Ability to save data to CSV files

Setup requirements for Access and SWG reports

Before you can produce Access reports and SWG reports, you must ensure that these tasks are already complete.

  • Set up the BIG-IQ® Centralized Management data collection devices.
  • Add the BIG-IP® devices to BIG-IQ inventory.
  • Discover the devices. (Devices with the Access service configuration are what you need.)
  • Run the data collection device configuration setup on the devices from the Access Reporting screen.

What data goes into Access reports for the All Devices option?

The All Devices option for Access reports includes data from the devices that are currently managed (discovered) in the BIG-IQ® system. This is in addition to data from devices that were managed at some point during the report timeframe, but that are not currently managed. With All Devices selected, if data from unmanaged devices exists, it displays in reports.

An unmanaged device might be unmanaged temporarily or permanently. Any time a configuration management change causes APM® to be undiscovered, the device and its data are moved to All Devices until APM is re-discovered on the device.

You cannot generate a report for an unmanaged device. However, you can generate a report for the timeframe when the device was managed, and then search the report for the unmanaged device name. In the Summary report, All Active Sessions includes the number of sessions that were active on the device when it became unmanaged. Those sessions stay in the Summary and in the Active sessions reports until the next session status update, which occurs every 15 minutes.

About upgrades affecting reports

When you upgrade a BIG-IQ® Centralized Management system without taking a snapshot, it deletes all reporting data, including both Access and SWG reports. After upgrading, users cannot obtain these reports from the BIG-IP® devices. To prevent the lost of reports, users should take an Elasticsearch snapshot before upgrading, and restore the snapshot after upgrading. For more information on elasticsnapshots, refer to F5 BIG-IQ Centralized Management: Upgrading Logging Nodes to Version x.x.

About the application dashboard

The Application Summary dashboard is your starting point to view and download general reports for BIG-IQ Access.

View the Application Summary dashboard

The BIG-IQ® Centralized Management Application Summary dashboard displays information regarding the applications linked to the system.
  1. Log in to the BIG-IQ system with your user name and password.
  2. At the top of the screen, click Monitoring.
  3. On the left, select DASHBOARDS > Access > Application Summary .
The Application Summary screen opens, showing detailed information and charts for specific applications.

About user visibility

You can monitor your user base by viewing the BIG-IQ® Centralized Management Access user dashboard for data on specific users. The system displays which users created the most sessions, were denied the most sessions, and had the longest total session duration. The administrator can enter a specific user name to get the following details for the user:

  • The user login locations on a world map
  • The total sessions, denied sessions, and session duration
  • The Access denied sessions.
  • The top authentication failures, including AD Auth and LDAP only
  • The device type users used to log into the system
  • The reason the system terminated the session
  • The login history showing the success and failures over time
  • The most accessed applications
  • The most accessed URLs
  • The login failure attempts over time, sorted by the reason
  • The client session duration over time
  • The Access denied reason over time

About application visibility

You can monitor your applications by viewing the BIG-IQ® Centralized Management Access user dashboard for data on which applications are linked to the BIG-IQ Access component. The system displays the top applications used and the application usage time. Administrators can expand the GUI for a specific application and view the following information:

  • The application access history
  • The users who use the application the most
  • The access history
  • The world map, showing where the user is access the application

About denied sessions

You can monitor the sessions that BIG-IQ® Centralized Management denies. By using the Access Monitoring option, you can view the following information:

  • The history of denied sessions
  • The reasons why sessions were denied
  • The top denied users, sorted by session count
  • The top authentication failures
  • The top denied policies
  • The top denied sessions by country of origin
  • The top denied session by the virtual server
  • The denied sessions, sorted by the client platform

Viewing denied sessions

You can use the BIG-IQ® Centralized Management Access reporting features to see which sessions were denied by the system, as well to create a report.
  1. Log in to the BIG-IQ system with your user name and password.
  2. Click Monitoring > DASHBOARDS > Access > Sessions > Denied .
  3. From the ACCESS GROUP/DEVICE list at upper left, select Managed Devices or select one or more of these options:
    • <Access group name> - Select to include all devices in the Access group.
    • <Cluster display name> - Select to include the devices in the cluster.
    • <Device name> - Select to include the device. You can select any device from Managed Devices, <Access group name>, or <Cluster display name>.
  4. From the TIMEFRAME list, specify a time frame:
    • Select a predefined time period - These range from Last hour to Last 3 months.
    • Set a custom time period - Select Between, After, or Before, and click the additional fields that display the set dates and times that support your selection.
  5. To save report data in a comma-separated values file, click the CSV Report button.
    A CSV file downloads.
From here, you can view details regarding denied sessions and create a report.

Overview: About the BIG-IP configuration for BIG-IQ application visibility

The F5® BIG-IQ® Centralized Management Application Summary dashboard displays statistics for applications and users that are managed by the BIG-IP® system. This includes the most requested applications, and how often individual users access the applications. For example, as an administrator, you can see the application summary report for the SharePoint application managed by the BIG-IQ system. You can use the report to track usage statistics, such as the request count for SharePoint and the most frequent users by request count. You can also adjust the time slider to see statistics for a certain time period.

To display these statistics, you must configure the BIG-IP system to classify the application traffic, create log messages, and send them to the BIG-IQ system. You can choose from two types of configurations:
Basic
A Basic configuration is your starting point to configure the BIG-IP system for application visibility. In some cases, you only need this option to generate the application logs and send them to the BIG-IQ system.
Advanced
In an Advanced configuration, after you configure a basic configuration and validate the reports, you might need to configure more BIG-IP resources such as classification presets and profiles. This situation typically occurs if there is not a predefined classification profile in the application that you want to display statistics and reports in.

Before you begin configuring application visibility, refer to Access Reporting and Statistics, in the F5® BIG-IQ® Centralized Management: Monitoring and Reports guide.

Note: Configure both BIG-IP® LTM® and BIG-IP® APM®. Portal Access is not supported.

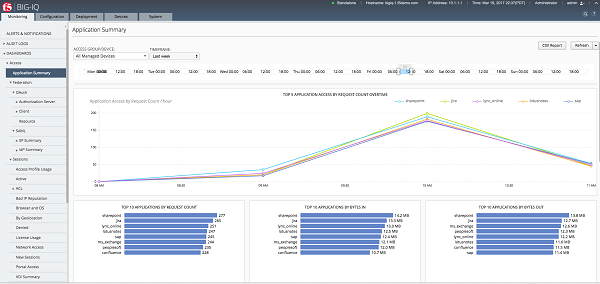
Sample Application Summary dashboard

Notice the length of time displayed by the line graph, dictated by the time slider above. Also notice the top ten applications, with SharePoint at number one. You can select an application and view the usage over time and the top users for that application.

View the Application Summary dashboard

The BIG-IQ® Centralized Management Application Summary dashboard displays information regarding the applications linked to the system.
  1. Log in to the BIG-IQ system with your user name and password.
  2. At the top of the screen, click Monitoring.
  3. On the left, select DASHBOARDS > Access > Application Summary .
The Application Summary screen opens, showing detailed information and charts for specific applications.

What is a basic configuration?

The basic BIG-IP® system configuration for BIG-IQ® application visibility is when a classification profile is already available to the administrator. This situation occurs when you want to track predefined access applications in BIG-IQ, such as SharePoint, OWA, PeopleSoft, or Lotus Notes. When you configure the virtual server for one or more of these applications, the BIG-IP system has already configured a classification profile. For most other applications, this basic configuration does not apply, and you must create the classification profile as well as other necessary resources.

In some cases, you might want to define your own signatures. If so, even in a basic configuration, you must upload the signatures in Traffic Intelligence.

For a basic configuration, configure the following resources in both the BIG-IQ and BIG-IP systems:
  • Enable remote logging in the Access area of BIG-IQ. Refer to the "BIG-IQ Centralized Management: Access" manual to learn how to configure remote logging.
  • Update classification signatures in BIG-IP Traffic Intelligence.
  • Configure a virtual server in BIG-IP Local Traffic.
  • Attach an existing classification profile to the virtual server.
Note: You must use BIG-IP version 13.0 as well as BIG-IQ version 5.2 or later.
Note: As part of the remote log configuration process, the system creates only the classification profile object name (classification _access). Because this classification profile is not attached to any virtual servers, you must add it to the virtual server used for applications that display reporting data. You should also enable the classification profile on the virtual server.

About traffic signatures for application visibility

Classification signatures define different types of traffic that the BIG-IP® system can recognize through Traffic Intelligence. The system recognizes a predefined set of signatures for common applications and application categories that are updated periodically. You can download signature updates from F5 Networks, and schedule the system to automatically update the signatures (pull the updated signatures automatically). You can also manually install the classification signatures and updates, for example, if the BIG-IP system does not have Internet access.

Signatures are updated once a month and have the following requirements:
  • Set up the DNS server on the BIG-IP system in order for the automatic updates to work.
  • The management network should be on the Internet.

Scheduling automatic signature updates

You can set up the BIG-IP® system to automatically update the classification signatures. This ensures that the system always has the latest classification signature files.
  1. On the Main tab, click Traffic Intelligence > Applications > Signature Update .
    The Signatures screen opens.
  2. Click Check for Updates to manually upload a signature file update if one is available.
    You see the current date and time in the Latest Update Check setting of the Signature Definitions area.
  3. To upload a signature file update, in the Signature Definitions area, click Import Signatures.
    The Applications screen displays a Signatures File field where you can select the new signature file.
  4. To discard and remove any installed upgrades and reset the classification engine and signatures to factory default, click Reset to Defaults.
  5. In the Signatures File field, click Choose File to navigate to the previously uploaded signatures file.
  6. Click Upload.
    A message displays indicating whether your upload was successful.
  7. For the Automatic Updates Settings, in the Signature Update screen, select Enabled.
  8. From the Update Schedule setting, select Daily, Weekly, or Monthly to specify how often you want the system to check for updates.
  9. Click Update to save your settings.
The signature updates take effect immediately.

Modify the virtual server for a basic configuration

Before you configure the virtual server in the BIG-IP® system, you must enable remote logging in the BIG-IQ® system.
For the BIG-IQ system to display statistics and reporting for an application such as SharePoint, OWA, or Lotus Notes, the application's virtual server must have a classification profile attached.
  1. In the Main tab, click Local Traffic > Virtual Servers > Virtual Server List .
    A list of existing virtual servers displays.
  2. Select the virtual server of the application that you wish to map to the BIG-IQ system.
    The virtual server editing (properties) screen opens.
  3. From the Configuration list, select Advanced.
  4. From the Classification Profile list, select classification_access.
    This classification profile was created by the BIG-IP system when you enabled remote logging in the BIG-IQ system.
  5. Click Update.
You have added a classification profile to the virtual server.

What is an advanced configuration?

If you want to display statistics and reports using the Access feature of BIG-IQ® in an application that does not have a predefined classification profile, you must create the classification profile and attach it to the virtual server. This is considered an advanced configuration, and applies to most applications.

Because of this, you must configure the following resources in both BIG-IQ and BIG-IP® systems:
  1. Enable remote logging in BIG-IQ Access. Refer to the BIG-IQ Centralized Management: Access manual to learn how to configure remote logging.
  2. Create a classification policy in BIG-IP system Traffic Intelligence screens.
  3. Create a new application from the Traffic Intelligence application list by customizing a category.
  4. Update the existing classification preset or create a new preset.
  5. Create a classification profile in the BIG-IP system's Local Traffic settings if you created a new classification preset. Otherwise, update the existing classification profile to include the existing preset.
  6. Configure a virtual server in the BIG-IP system's Local Traffic settings.
Note: Advanced configuration is introduced in BIG-IP version 13.1 and 13.0 Hotfix build 13.0.0 HF3.
Note: As part of the remote log configuration, only the classification profile object name (classification _access) is created. Because this classification profile is not attached to any virtual servers, you must add to the virtual server used for applications that display reports. You should also enable the classification profile on the virtual server.

Creating a custom local traffic policy

You can create a custom local traffic policy to manage traffic assigned to a virtual server.
  1. On the Main tab, click Local Traffic > Policies .
    For more information about local traffic policies, refer to BIG-IP® Local Traffic Manager™: Implementations.
    The Policy List screen opens.
  2. Click Create.
    The New Policy List screen opens.
  3. In the Policy Name field, type a unique name for the policy, for example companyA.
  4. In the Description field, type descriptive text that identifies the policy definition.
  5. From the Strategy list, select the action that the policy initiates when there are multiple rules that match.
    Rule Description
    All Uses the first or best strategy to resolve the conflict of rule match.
    Best Applies the actions of the rule specified in the list of defined strategies for the associated policy.
    First Applies the actions of only the first rule. This implies that the rule with the lowest ordinal, highest priority, or first in the list is applied.
  6. From the Type list, select CE Profile to attach the policy to a CE profile.
  7. Click Create Policy.
    This creates a policy that manages traffic assigned to a virtual server.
You have created a new local traffic policy for application visibility.

Creating a category

On the BIG-IP® system, you can create customized categories for classifying traffic if the predefined categories are not sufficient for your needs. For example, if you plan to create new application types unique to your organization, you can create a category to group them together. Alternatively, you can add an existing category to your application list.
  1. On the Main tab, click Traffic Intelligence > Applications > Application List .
    The Applications screen displays a list of the supported classification categories.
  2. On the Main tab, click Traffic Intelligence > Categories > Category List .
    The Category list screen opens.
  3. Click Create.
    The New URL Category screen opens.
  4. In the Name field, type a name for the classification category.
  5. In the Description field, type optional informative text.
  6. In the Category ID field, type an identifier for this category, a unique number.
  7. In the Application List setting, select applications from the list and use the Move buttons to move applications from one list to the other.
  8. Click Finished.
You have created custom applications to handle traffic.

Create a classification application

The BIG-IP® system classifies many categories of traffic, and specific applications within those categories. You can create a new classification application, and determine which categories and applications of traffic the system can classify.
  1. On the Main tab, click Traffic Intelligence > Applications > Application List .
    The Applications screen displays a list of the supported classification categories.
  2. To view the applications in each category, click the + icon next to the category.
  3. To view or edit the properties of the application or category, click the name to open its properties screen.
    Tip: Here you can view the application or category ID number.
  4. Click Create.
  5. In the Name field, type a name for the classification application.
  6. In the Description field, type a descriptive text identifying the classification application.
  7. In the Application ID field, type the identifier for a category, a new, unique number.
  8. From the Category list, select an existing category or a category that you created.
  9. Click Finished.

About presets and profiles

In BIG-IQ® application visibility, as part of the advanced configuration, there are two ways to configure the BIG-IP® classification preset and classification profile.

  • You can use the existing classification preset, and make sure it is associated with the current classification profile.
  • You can create a new classification preset, but you must also associate it with a new classification profile.
Updating classification presets
On the BIG-IP® system, you can update classification preset settings for a classification policy that you have previously created. Alternatively, you can create a new preset for application visibility.
  1. On the Main tab, click Traffic Intelligence > Presets .
    The Presets screen displays a list of the supported classification categories.
  2. From the preset list, select the preset CE.
  3. From the Policies setting, move policies from the Available list to the Enabled list.
  4. Click Update.
Updating a classification profile
If you update the existing classification preset, update the existing classification profile and attach the existing preset. In the profile, you can change which virtual servers and which categories of traffic are included in the classification statistics.
  1. On the Main tab, click Local Traffic > Profiles > Classification .
    The Classification screen opens.
  2. Click the Create.
    The New Classification Profile screen displays.
  3. In the Name field, type a name for the classification profile.
  4. In the Description field, click the check box and type a description for the profile.
  5. From the Parent Profile dropdown list, select an existing profile from which this profile is derived.
    This profile inherits settings from the parent profile.
  6. Click the check box next to Custom.
  7. From the Preset dropdown list, select the preset CE.
  8. From the Log Publisher dropdown list, select access-gpa-log-publisher.
  9. Click Finished.
The BIG-IP system classifies traffic for the virtual servers and categories specified in the Classification profile.
Creating classification presets
On the BIG-IP® system, you can create classification preset settings for a classification policy that you have previously created.
  1. On the Main tab, click Traffic Intelligence > Presets .
    The Presets screen displays a list of the supported classification categories.
  2. Click Create.
    The New Presets screen opens.
  3. In the Name field, type a name for the application.
  4. In the Description field, type optional descriptive text for the classification presets.
  5. For the Policy setting, move the classification policies from Available list to the Selected list, to create a new preset.
  6. In the Allow Reclassification list, Enabled is the default selection.
  7. In the Flow Bundling list, Enabled is the default selection.
  8. In the Cache Results list, Enabled is the default selection.
  9. Click Finished.
Creating a classification profile
If you create a new classification preset, you must create a new classification profile and attach the preset. In the profile, you can change which virtual servers and which categories of traffic are included in the classification statistics.
  1. On the Main tab, click Local Traffic > Profiles > Classification .
    The Classification screen opens.
  2. Click the Create.
    The New Classification Profile screen displays.
  3. In the Name field, type a name for the classification profile.
  4. In the Description field, click the check box and type a description for the profile.
  5. From the Parent Profile dropdown list, select an existing profile from which this profile is derived.
    This profile inherits settings from the parent profile.
  6. Click the check box next to Custom.
  7. From the Preset dropdown list, select the new preset that you created previously.
  8. From the Log Publisher dropdown list, select access-gpa-log-publisher.
  9. Click Finished.
The BIG-IP system classifies traffic for the virtual servers and categories specified in the Classification profile.

Modify the virtual server for an advanced configuration

Before you configure the virtual server in the BIG-IP® system, enable remote logging in BIG-IQ® and create a classification profile.
For the Access feature of BIG-IQ to display statistics and reporting for an application such as SharePoint, OWA, or Lotus Notes, the application's virtual server must have a classification profile attached.
  1. In the Main tab, click Local Traffic > Virtual Servers > Virtual Server List .
    A list of existing virtual servers displays.
  2. Select the virtual server of the application that you want to map to the BIG-IQ system.
    The virtual server editing screen opens.
  3. From the Configuration setting, select Advanced.
  4. From the Classification Profile list, select the classification profile associated with the advanced configuration use case.
  5. Click Update.
You have added a classification profile to the virtual server.

How much memory does application visibility need?

In the BIG-IP® system configuration for BIG-IQ® application tracking reporting, you do not need to allocate separate memory resources to enable the application visibility functionality. The runtime memory consumption depends on the amount of traffic processed, such as concurrent TCP flows.

Application visibility troubleshooting commands

Type these commands in the BIG-IP® UNIX shell to start and stop debugging and logging.

Command Description
tmctl gpa_classification_stats Displays classification results in a table that lists all applications that were classified, the number of flows, the bytes in, and the bytes out.

tmsh modify sys db tmm.cec.log.level value Debug

tmsh modify sys db tmm.gpa.log.level value Debug

Generates debug logs. The log messages are stored in /var/log/tmm.

tmsh modify sys db tmm.cec.log.level reset-to-default

tmsh modify sys db tmm.gpa.log.level reset-to-default

Stops debug log messages.

Managing a specific user in Access reporting

You can use the BIG-IQ® Centralized Management Access reporting tools to view the user dashboard for data on a specific user.
  1. Log in to the BIG-IQ system with your user name and password.
  2. Click Monitoring > DASHBOARDS > Access > User Summary .
    The User Summary screen displays, showing detailed information for specific users.

Running Access reports

For Access to have report data for a device, the device must have been added to the BIG-IQ® Centralized Management system, discovered, and had the Access remote logging configuration run for it.
You can create Access reports for any device with the APM® service configuration on it that has been discovered on the BIG-IQ system, whether or not the device is a member of an Access group. To create a report, you can select any combination of Access groups, clusters, and devices.
  1. At the top of the screen, click Monitoring.
  2. On the left, select DASHBOARDS > Access .
    A Summary report (for all devices and a default timeframe) starts to generate and display.
  3. From the left, select any report that you want to run.
  4. At the top left of the screen, from the ACCESS GROUP/DEVICES list, either select one of the first two options (All Devices and All Managed Devices) or, select one or more of the other options (<Access group name>, <Cluster display name>, and <Device name>).
    • All Devices Includes Access devices that are currently managed, and Access devices that were managed at one time but are not managed now. (A managed device is one that has been discovered with the APM service configuration.)
    • All Managed Devices Includes all Access devices that are currently discovered.
    • <Access group name> - Select to include all devices in the Access group.
    • <Cluster display name> - Select to include the devices in the cluster.
    • <Device name> - Select to include the device. You can select any device from Managed Devices, <Access group name>, or <Cluster display name>.
  5. From the TIMEFRAME list, specify a time frame:
    • Select a predefined time period - These range from Last hour to Last 3 months.
    • Set a custom time period - Select Between, After, or Before, and click the additional fields that display the set dates and times that support your selection.
  6. To save report data in a comma-separated values file, click the CSV Report button.
    A CSV file downloads.

Getting the details that underlie an Access report

For Access to have report data for a device, the device must have been added to the BIG-IQ® Centralized Management system, discovered, and had the Access remote logging configuration run for it.
From the Summary report, and from most session reports, the initial display includes graphs that summarize the report data. You can get successively more detailed information by clicking a bar or a point on a graph or clicking a link if one is displayed on the screen.
  1. Log in to the BIG-IQ system with your user name and password.
  2. At the top of the screen, click Monitoring.
  3. On the left, select DASHBOARDS > Access .
    The Summary report is an example of the type of report that presents high-level data, and provides access to underlying data.
    A Summary report (for all devices and a default timeframe) starts to generate and display.
  4. Click anywhere in a summary to get more information.
    To get details from a summary, click the brightly colored number or the brightly colored bar.

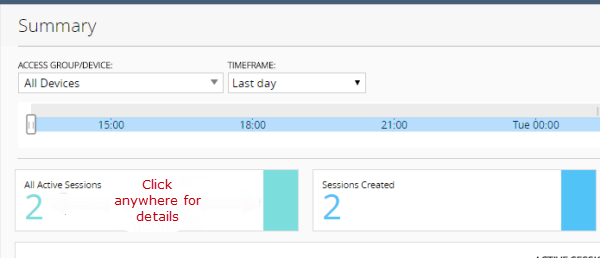
    Top left portion of the Summary report display

    Additional graphs display, and supporting data displays in a table at the bottom of the screen.
  5. If more details are available, click the bars in the graphs to display more details.
  6. Scroll down to the table to view the supporting data.
  7. If the table includes a Session ID field, click the link in that field to open the session details.
    Session details report displays local time, hostname, log level, message, and a Session Variables tab.

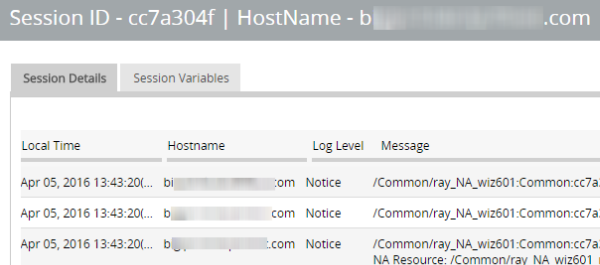
    Session details popup screen (with addresses and host names blurred)

  8. To change which records display on this screen, select a log level from the LOG LEVEL list at the top of the screen.

About the maximum number records for Access and SWG reports

When you run an Access report or an SWG report, Access can get up to 10,000 records to display to you. After you scroll to the end of those 10,000 records, Access displays a message. At that point, all you can do is select fewer devices or select a shorter timeframe.

Setting the timeframe for your Access or SWG report

For Access to have report data for a device, the device must have been added to the BIG-IQ® Centralized Management system, discovered, and had the Access remote logging configuration run for it.
Use the TIMEFRAME list at the top of any Access or SWG report to change the report time period.
  1. Log in to BIG-IQ Centralized Management with your admin user name and password.
  2. At the top of the screen, click Monitoring.
  3. To set a predefined timeframe, select one of these from the TIMEFRAME list: Last hour, Last day, Last week, Last 30 days, Last 3 months.
  4. To set a custom timeframe, select one of these from theTIMEFRAME list:
    • Between: Click each of the additional fields that display to select dates and times. The report displays the records between those dates and times.
    • Before: Click the additional fields that display to select a date and a time. The report displays the records before that date and time.
    • After: Click the additional fields that display to select a date and a time. The report displays the records after that date and time.

Access report problems: causes and resolutions

Problem Resolution
A session is over, but it continues to display in the Active sessions report. If a session starts when logging nodes are up and working, but terminates during a period when logging modes are unavailable, the session remains in the Active sessions report for 15 minutes. After 15 minutes, the session status is updated and the session is dropped from the report.
Active sessions are included in the Summary and Active sessions reports for a device that is no longer managed. Sessions were active on a device when it was removed from an Access group and became unmanaged. Sessions that were active when the device became unmanaged remain counted in All Active Sessions on the Summary screen and stay in the Active sessions report until the next session status update, which occurs every 15 minutes.
A session is over, but Session Termination and Session Duration are blank in a session report. If a session starts when logging nodes are up and working but terminates during a period when logging nodes are unavailable, the session termination is not recorded and the session duration cannot be calculated.

What can cause logging nodes to become unavailable?

Logging nodes are highly available, but it is still possible for them to become unavailable. This could occur, for example, if all logging nodes are on devices in the same rack in a lab, and the power to the lab shuts down.

Sessions

Running Session reports

For Access to have report data for a device, the device must have been added to the BIG-IQ® Centralized Management system, discovered, and had the Access remote logging configuration run for it.
You can create Session reports for any device with the APM® service configuration on it that has been discovered on the BIG-IQ system, whether or not the device is a member of an Access group. To create a report, you can select any combination of Access groups, clusters, and devices.
  1. At the top of the screen, click Monitoring.
  2. On the left, select DASHBOARDS > Access > Sessions .
    A Summary report (for all devices and a default timeframe) starts to generate and display.
  3. From the left, select any report that you want to run.
  4. At the top left of the screen, from the ACCESS GROUP/DEVICES list, either select one of the first two options (All Devices and All Managed Devices) or select one or more of the other options (<Access group name>, <Cluster display name>, and <Device name>).
    • All Devices Includes Access devices that are currently managed, and Access devices that were managed at one time but are not managed now. (A managed device is one that has been discovered with the APM service configuration.)
    • All Managed Devices Includes all Access devices that are currently discovered.
    • <Access group name> - Select to include all devices in the Access group.
    • <Cluster display name> - Select to include the devices in the cluster.
    • <Device name> - Select to include the device. You can select any device from Managed Devices, <Access group name>, or <Cluster display name>.
  5. From the TIMEFRAME list, specify a time frame:
    • Select a predefined time period - These range from Last hour to Last 3 months.
    • Set a custom time period - Select Between, After, or Before, and click the additional fields that display the set dates and times that support your selection.
  6. To save report data in a comma-separated values file, click the CSV Report button.
    A CSV file downloads.

Stopping sessions on BIG-IP devices from Access

For Access to have report data for a device, the device must have been added to the BIG-IQ® Centralized Management system, discovered, and had the Access remote logging configuration run for it.
You can stop currently active sessions on BIG-IP® devices, using the Active sessions report on the BIG-IQ system.
  1. Log in to the BIG-IQ system with your user name and password.
  2. At the top of the screen, click Monitoring.
  3. On the left, select DASHBOARDS > Access .
    A Summary report (for all devices and a default timeframe) starts to generate and display.
  4. On the left, from Sessions, select Active.
    The screen displays a list of active sessions for all devices.
  5. To display sessions for particular devices, groups, or clusters only, select them from the ACCESS GROUP/DEVICE list at upper left.
    The screen displays the active sessions for the selected devices.
  6. To stop specific sessions only, select the sessions that you want to end and click Kill Selected Sessions.
  7. To stop all sessions, click Kill All Sessions.

Running Secure Web Gateway reports

For Access to have report data for a device, the device must have been added to the BIG-IQ® Centralized Management system, discovered, and had the Access remote logging configuration run for it.Only a device with SWG provisioned on it can provide data for Secure Web Gateway reports.
You can create SWG reports for Access groups, clusters (in Access groups), or devices that you select from the Access groups and clusters (in Access groups) on the BIG-IQ system.
  1. Log in to the BIG-IQ system with your user name and password.
  2. At the top of the screen, click Monitoring.
  3. On the left, select DASHBOARDS > Access > Secure Web Gateway .
    A Summary report (for all devices and a default timeframe) starts to generate and display.
  4. From the left, select any report that you want to run.
  5. From the ACCESS GROUP/DEVICE list at upper left, select Managed Devices or select one or more of these options:
    • <Access group name> - Select to include all devices in the Access group.
    • <Cluster display name> - Select to include the devices in the cluster.
    • <Device name> - Select to include the device. You can select any device from Managed Devices, <Access group name>, or <Cluster display name>.
  6. From the TIMEFRAME list, specify a time frame:
    • Select a predefined time period - These range from Last hour to Last 3 months.
    • Set a custom time period - Select Between, After, or Before, and click the additional fields that display the set dates and times that support your selection.
  7. To save report data in a comma-separated values file, click the CSV Report button.
    A CSV file downloads.

Getting the details that underlie an SWG report

For Access to have report data for a device, the device must have been added to the BIG-IQ® Centralized Management system, discovered, and had the Access remote logging configuration run for it.Only a device with SWG provisioned on it can provide data for SWG reports.
From the Summary report, the initial display includes graphs that summarize the report data. You can get more detailed information by clicking a bar or a point on a graph to see additional graphs and tables with supporting entries.
  1. Log in to BIG-IQ Centralized Management with your admin user name and password.
  2. At the top of the screen, click Monitoring.
  3. On the left, select DASHBOARDS > Access > Secure Web Gateway .
    The Summary starts to generate and display. A timeline and some summaries display across the top of the screen. Graphs display under the summaries. Each graph provide different views of the data.
  4. Click any bar in a graph on the display to get more information.
    Additional graphs provide different views of the data, and supporting data displays in a table at the bottom of the screen.
  5. If more details are available, click the bars in the graphs to display them.
  6. Scroll down to the table to view the supporting data.

About VDI reports

You can monitor your virtual desktop infrastructure (VDI) by viewing the BIG-IQ® Centralized Management Access user dashboard for VDI applications, and creating a VDI report. The system displays the top VDI applications used and the application usage time. Administrators can expand the UI for a specific application, and view the following information:
  • The top 10 VDI applications
  • The top users for the VDI applications
  • The application usage history

Federation

Running OAuth reports

For Access to have report data for a device, the device must have been added to the BIG-IQ® Centralized Management system, discovered, and had the Access remote logging configuration run for it.Only a device with OAuth provisioned on it can provide data for OAuth reports.
You can create OAuth reports for Access groups, clusters (in Access groups), or devices that you select from the Access groups and clusters (in Access groups) on the BIG-IQ® Centralized Management system.
  1. Log in to the BIG-IQ system with your user name and password.
  2. At the top of the screen, click Monitoring.
  3. On the left, select DASHBOARDS > Access > Federation > OAuth .
  4. Select Authorization Server, Client, or Resource.
    A Summary report (for all devices and a default timeframe) starts to generate and display.
  5. From the left, select any report that you want to run.
  6. From the ACCESS GROUP/DEVICE list at upper left, select Managed Devices or select one or more of these options:
    • <Access group name> - Select to include all devices in the Access group.
    • <Cluster display name> - Select to include the devices in the cluster.
    • <Device name> - Select to include the device. You can select any device from Managed Devices, <Access group name>, or <Cluster display name>.
  7. From the TIMEFRAME list, specify a time frame:
    • Select a predefined time period - These range from Last hour to Last 3 months.
    • Set a custom time period - Select Between, After, or Before, and click the additional fields that display the set dates and times that support your selection.
  8. To save report data in a comma-separated values file, click the CSV Report button.
    A CSV file downloads.

Running SAML reports

For Access to have report data for a device, the device must have been added to the BIG-IQ® Centralized Management system, discovered, and had the Access remote logging configuration run for it.Only a device with SAML provisioned on it can provide data for SAML reports.
You can create SAML reports for Access groups, clusters (in Access groups), or devices that you select from the Access groups and clusters (in Access groups) on the BIG-IQ® Centralized Management system.
  1. Log in to the BIG-IQ system with your user name and password.
  2. At the top of the screen, click Monitoring.
  3. On the left, select DASHBOARDS > Access > Federation > SAML .
  4. Select SP Summary or IdP Summary.
    A Summary report (for all devices and a default timeframe) starts to generate and display.
  5. From the left, select any report that you want to run.
  6. From the ACCESS GROUP/DEVICE list at upper left, select Managed Devices or select one or more of these options:
    • <Access group name> - Select to include all devices in the Access group.
    • <Cluster display name> - Select to include the devices in the cluster.
    • <Device name> - Select to include the device. You can select any device from Managed Devices, <Access group name>, or <Cluster display name>.
  7. From the TIMEFRAME list, specify a time frame:
    • Select a predefined time period - These range from Last hour to Last 3 months.
    • Set a custom time period - Select Between, After, or Before, and click the additional fields that display the set dates and times that support your selection.
  8. To save report data in a comma-separated values file, click the CSV Report button.
    A CSV file downloads.

About Application Summary and traffic signatures

In BIG-IQ Access, to view the Sharepoint and OWA application names in the Application dashboard correctly, update the classification signatures on the BIG-IP device. You can also customize your traffic signature by creating a custom signature.

Note: Not updating the classification signatures on the BIG-IP device can prevent the Sharepoint and OWA application names from displaying.

Overview: Updating classification signatures

Classification signatures define different types of traffic that Policy Enforcement Manager™ (PEM) can recognize, through Traffic Intelligence™. PEM™ recognizes a predefined set of signatures for common applications and application categories that are updated periodically. You can download signature updates from F5 Networks, and schedule the system to automatically update the signatures. You can also manually install the classification signatures and updates, for example, if the BIG-IP® system does not have Internet access.

Task Summary

Scheduling automatic signature updates

You can set up the BIG-IP® system to automatically update the classification signatures. This ensures that the system always has the latest classification signature files.
  1. On the Main tab, click Traffic Intelligence > Classification > Signature Update .
    The Signatures screen opens.
  2. Click Check for Updates to manually upload a signature file update if one is available.
    You see the current date and time in the Latest Update Check setting of the Signature Definitions area.
  3. To upload a signature file update, in the Signature Definitions area, click Import Signatures.
    The Applications screen displays a Signatures File field where you can select the new signature file.
  4. In the Signatures File field, click Choose File to navigate to the previously uploaded signatures file.
  5. Click Upload.
    A message displays indicating whether your upload was successful.
  6. For the Automatic Updates Settings, in the Signature Update screen, select Enabled.
  7. From the Update Schedule setting, select Daily, Weekly, or Monthly to specify how often you want the system to check for updates.
  8. Click Update to save your settings.
The signature updates take effect immediately.

Overview: Creating custom classifications

Traffic Intelligence analyzes and identifies higher level protocols and applications. It has the ability to detect applications and protocols in Service Provider networks, for example, HTTP, popular P2P, and top categories (Audio/Video, File Transfer, Instant Messaging, Mail, P2P, Web). It provides an application update mechanism, which in turn, provides the ability to keep up with new, modified, or obsolete applications without going through software release upgrades. IP traffic classifications are based on the IP protocol field of the IP header (IANA protocol).

Note: You can update the library (so) and signature definitions for web traffic (cpm) with hitless upgrade in Policy Enforcement Manager™ (PEM™).

Task summary

Determining and adjusting traffic classifications

The BIG-IP® system classifies many categories of traffic and specific applications within those categories. You can determine which categories and applications of traffic the system can classify, and find out information about them such as their application or category ID.
  1. On the Main tab, click Traffic Intelligence > Applications > Application List .
    The Applications screen displays a list of the supported classification categories.
  2. To view the applications in each category, click the + icon next to the category.
  3. To view or edit the properties of the application or category, click the name to open its properties screen.
    Tip: Here you can view the application or category ID number.
  4. Click Update to save any changes.

Creating a category

On the BIG-IP® system, you can create customized categories for classifying traffic if the predefined categories are not sufficient for your needs. For example, if you plan to create new application types unique to your organization, you can create a category to group them together.
  1. On the Main tab, click Traffic Intelligence > Applications > Application List .
    The Applications screen displays a list of the supported classification categories.
  2. Click Create.
    The New Application screen opens.
  3. From the Type list, select Category.
  4. In the Name field, type a name for the classification category.
  5. In the Description field, type optional descriptive text for the classification presets.
  6. In the Category ID field, type an identifier for this category, a unique number.
  7. For the Application List setting, move applications that you want to associate with this category from the Unknown list to the Selected list.
    If the applications are not listed yet, you can associate the applications with the category when you create them.
  8. Click Finished.
You have created custom applications to handle traffic.

Creating classification presets

On the BIG-IP® system, you can create classification preset settings for a classification policy that you have previously created.
  1. On the Main tab, click Traffic Intelligence > Presets .
    The Presets screen displays a list of the supported classification categories.
  2. Click Create.
    The New Presets screen opens.
  3. In the Name field, type a name for the application.
  4. In the Description field, type optional descriptive text for the classification presets.
  5. For the Policy setting, move the classification policies from Available list to the Selected list, to create a new preset.
  6. In the Allow Reclassification list, Enabled is the default selection.
  7. In the Flow Bundling list, Enabled is the default selection.
  8. In the Cache Results list, Enabled is the default selection.
  9. Click Finished.

Creating a custom URL database

You can create a customized URL database that can be used for adding custom URLs and categories.
  1. On the Main tab, click Traffic Intelligence > Categories > Feed Lists .
    The URL DB feed list screen opens.
  2. Click Create.
    The New Feed List screen opens.
  3. In the Name field, type a unique name for the URL feed list.
  4. In the Description field, type optional descriptive text for the URL feed list.
  5. In the Category ID field, select a category name from the drop-down list.
  6. In the URL DB Location area, select the appropriate option for URL DB location.
    Option Description
    File Click the Browse button, and select the customdb file. The customdb file should be present on your machine, and is not present on the BIG-IP system. The customdb file is a CSV file of the format. The format is: URL/IPv4 [,cat1] [,cat2]...
    Note: The non-IP URL should have a IANA registered top level domain. The URL category ID should be in the form of integer and the range is 24576 to 32767.
    For example, sample lines of customdb entry is:
                          weather.gov, 28678
                          pconline.com.cn, 28679
                          kannadaprabha.com, 28680
                          yandex.ru, 28677, 28676, 28681
                          pitt.edu,28682 
    FTP Type the ftp location and the User and Password.
    HTTP Type the HTPP location and the User and Password.
    HTTPS Type the HTPPS location and the User and Password.
  7. In the Poll Interval field, type the time interval in seconds at which the url needs to be polled.
  8. On the Main tab, click Traffic Intelligence > Policies .
    The Policy list opens.
  9. Click Create.
    The New Policy screen opens.
  10. In the Name field, type a unique name for the URL category policy.
  11. In the Description field, type optional descriptive text for the URL category policy.
  12. In the Feed List area, select the feed list that you created to attach to the policy.
  13. Click Finished.
The category lookup is done in the custom database, and the URL list is loaded into the custom database through file input. You can also perform URL categorization by looking up the server name indication (SNI) in SSL traffic.

Using iRules with classification categories and applications

If you are using custom classification categories or applications, you can use iRules® to identify the traffic for the custom classifications, or you can initiate an action based on how the traffic is classified.
  1. On the Main tab, click Local Traffic > iRules .
  2. Click Create.
  3. In the Name field, type a 1- to 31-character name.
  4. In the Definition field, type the syntax for the iRule using Tool Command Language (Tcl) syntax.
    For example, to classify traffic as xxx_app, a custom classification application that you created, you can use this iRule:
    when HTTP_REQUEST {
                            if { [HTTP::header "Host"] contains "xxx" }  {  
                            CLASSIFY::application set xxx_app 
                            }  
                            }  
                            } 
                        
    For example, to perform an action (in this case, drop) on traffic classified as xxx_app, you can use this iRule:
    when CLASSIFICATION_DETECTED {
                            if { [CLASSIFICATION::APP == "xxx_app"]}  {  
                            drop 
                            }  
                            } 
                        
    For complete and detailed information about iRules syntax, see the F5 Networks DevCentral web site http://devcentral.f5.com.
  5. Click Finished.
After creating the iRules, you must assign them as resources for each relevant virtual server on the BIG-IP® system.

Modifying iRule event for URL categories

On the BIG-IP® system, you can modify iRules® Event settings for URL categories.
  1. On the Main tab, click Traffic Intelligence > Categories > Category List .
  2. Select a URL category.
    The URL Properties screen opens.
  3. In the Name field, type a unique name for the URL category policy.
  4. In the Description field, type optional descriptive text for the classification presets.
  5. In the Category ID field, type an identifier for this category, a unique number.
  6. For the Application List setting, move applications that you want to associate with this category from the Unknown list to the Selected list.
    If the applications are not listed yet, you can associate the applications with the category when you create them.
  7. Click Finished.
  8. On the Main tab, click Local Traffic > Profiles > Classification .
    The Classification screen opens.
  9. Select a classification profile or create one.
  10. From the URL Categorization field, select Enabled from the drop-down list.
  11. In the iRule Event field, select the appropriate setting.
    • To trigger an iRule event for this category of traffic, select Enabled. You can then create an iRule that performs an action on this type of traffic.
    • If you do not need to trigger an iRule event for this category of traffic, select Disabled.
    Note: CLASSIFICATION::DETECTED is the only event that is supported.
You have modified an iRule event setting for an existing URL category.

Classification iRule commands

When the BIG-IP® system identifies a specific type of traffic with iRules® enabled, it triggers a CLASSIFICATION_DETECTED event. You can use the commands within iRules for additional system flexibility to classify the flow as one or more of the application or category classifications. The CLASSIFY commands are available from the HTTP_REQUEST or HTTP_RESPONSE iRule events.

iRule Command Description
CLASSIFICATION::app Gets the name of the classified application (the most explicit classified application).
CLASSIFICATION::category Gets the category of the application.
CLASSIFICATION::disable Disables the classification for a flow.
CLASSIFICATION::enable Enables the classification for a flow.
CLASSIFICATION::protocol Gets the name of the classified protocol (the least explicit classified application).
CLASSIFY::application set appname Classifies the flow as appname and associates the category that appname belongs to.
CLASSIFY::category set catname Classifies the flow as catname and also associates the flow with the unknown category.
CLASSIFY::application add appname Adds the application appname to the classification statistics.
CLASSIFY::category add catname Adds the category catname to the classification statistics.