Manual Chapter :
Viewing DDoS Reports Statistics and Logs
Applies To:
Show Versions
F5 DDoS Hybrid Defender
- 14.0.0
Viewing DDoS Reports, Statistics, and Logs
Reviewing statistics about ongoing attacks
The DoS Overview screen shows a snapshot of
statistics about ongoing network, DNS, and SIP attacks, and allows you to adjust the
vector settings for those attacks. It does not include HTTP statistics.
You can continue to review DoS attack details using the DoS Overview screen to become
more familiar with the types of attacks your network is experiencing, examining attack
status, average traffic levels, dropped packets, and current thresholds. You may also
want to review relevant settings for the protected object, protection profile, or device
protection to further tune DoS protection. You can investigate further by looking at the
charts and event logs on the Main tab under Visibility.
Investigating DDoS attacks and mitigation
On the DoS Dashboard, you can display an overview
of DoS attack activity and review corresponding system information on the system.
You can continue to review the system snapshot using the DoS Dashboard screen. As a
result, you become more familiar with system activities during DoS attacks. You can also
view the statistics in graphical charts and in tables, focusing on the specific data you
need using attack and dimension filters.
Sample DoS Dashboards
This figure shows a sample DoS Dashboard on a system that is having a low-level DoS attack now.
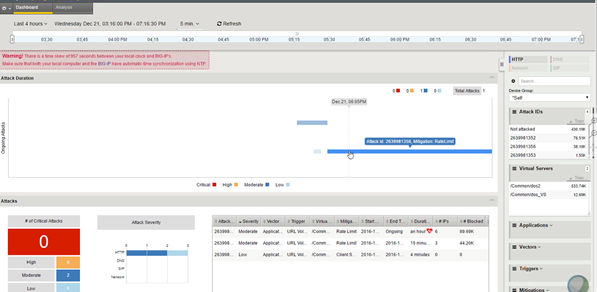
Sample DoS Dashboard
This figure shows a sample DoS Dashboard showing DoS attacks that occurred during the last week. Three of the attacks were critical but all were mitigated within minutes.
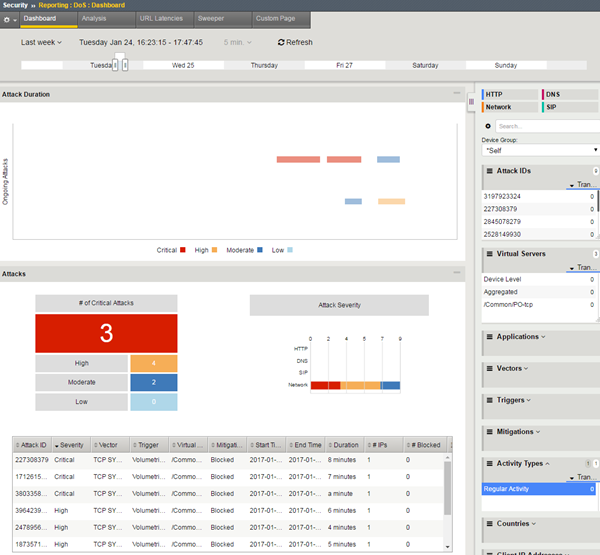
Sample DoS Dashboard showing attacks
Displaying DDoS Event logs
You can display DoS Event logs to
see whether DDoS attacks have occurred, and view information about the attacks. The logs
show details about the DDoS events.
- If DoS attacks are listed, review the list of attacks to see what has occurred, when it occurred, the mitigation, and the severity of the attack.
-
To view information about other types of DoS
attacks, from the DoS menu on the bar at the top, choose another event log to
view:
- For DNS DoS event logs, click DNS Protocol.
- For SIP DoS event logs, click SIP Protocol.
- For network firewall DoS event logs, click Network.
- To view event logs if using automatic threshold configuration and you selected Log Auto Threshold Events, click Auto Threshold.
Displaying DoS Application Events logs
You can display DoS Application Events logs to see whether L7 DoS attacks have
occurred, and view information about the attacks. The logs show details about the DoS
events.
Creating customized DoS reports
You can create a customized DoS reporting screen so that it shows the specific data
you are interested in, such as the top DoS attacks and server latency.
You have created a custom page that includes the information you need to monitor
your system. As you use the reports to investigate DoS attacks, you can adjust the
custom page to include additional data that you need. You can save the reports or send
them to others who want to review the data.


