Applies To:
Show Versions
F5 DDoS Hybrid Defender
- 13.0.0
Investigating DoS attacks and mitigation
Sample DoS Overview screen
This figure shows a sample DoS Overview screen on a system that is having an attack.
The Overview screen includes information on throughput and RAM and CPU usage. Because the statistics vary from system to system, it is a good idea to become familiar with typical memory and CPU usage and throughput on your system as well as checking for recent attacks.
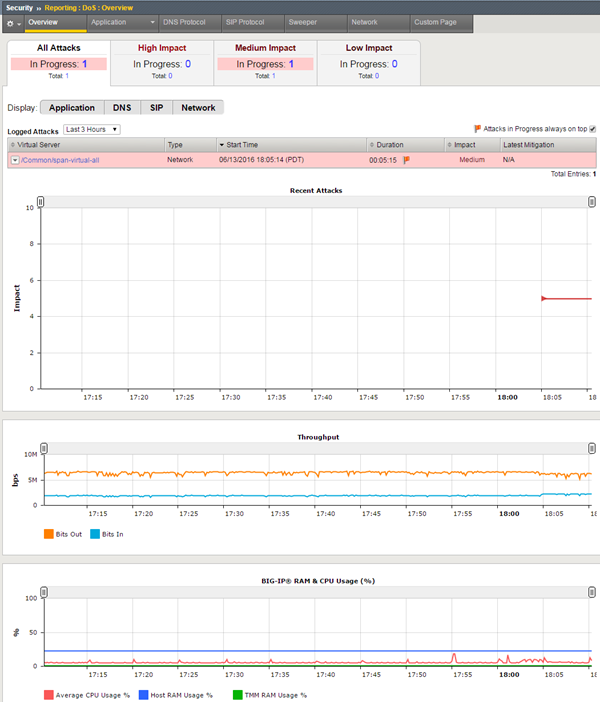
Sample DDoS Overview screen
Click the down arrow next to the protected object (in the Virtual Server column) to find out what type of attack it is. Here you can see the attack is a UDP flood attack.
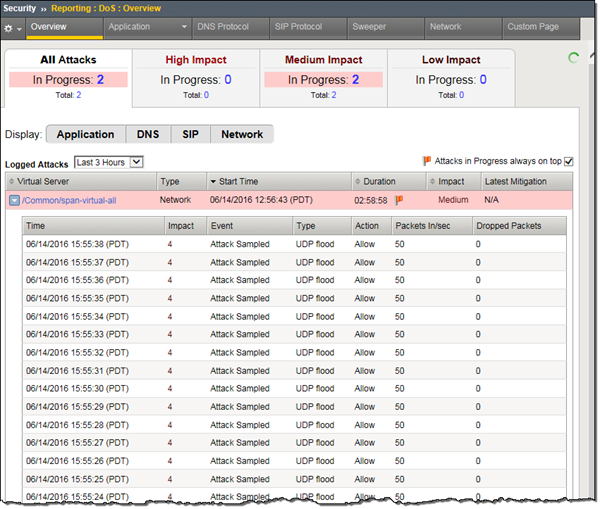
Events related to an attack
Sample DoS Dashboard
This figure shows a sample DoS Dashboard on a system that is having a low-level DoS attack now.
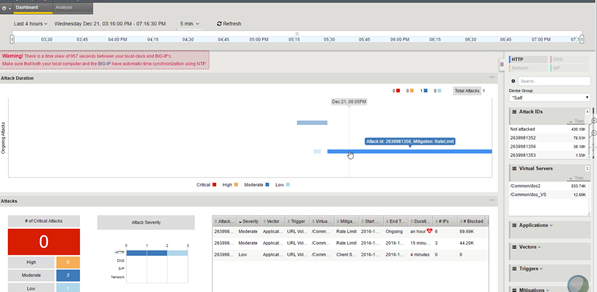
Sample DoS Dashboard
Displaying DDoS Events logs
Sample DDoS event log
This figure shows a sample DDoS event log on a system that is experiencing UDP flood attack. When the attack exceeds the maximum packets per seconds (50 pps), excess packets are dropped.
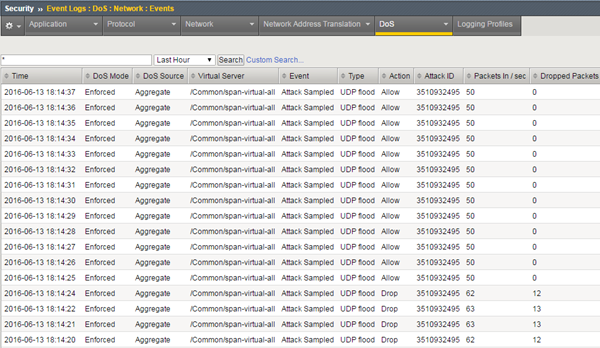
Sample DDoS event log
Displaying DoS Application Events logs
Viewing DoS transaction outcomes
Sample DoS Transaction Outcomes report
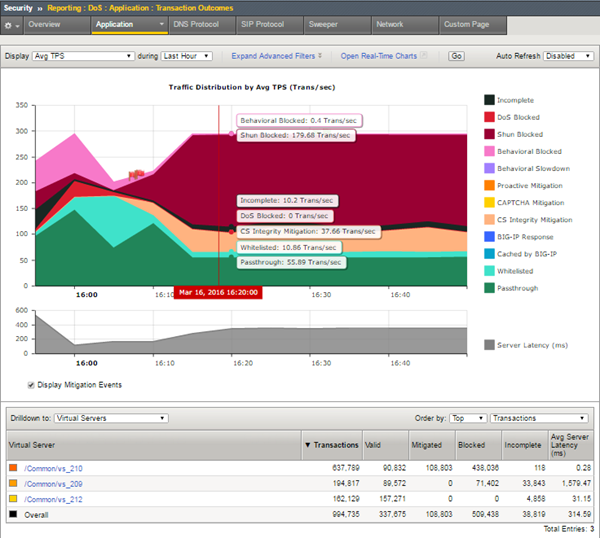
This figure shows a sample Transaction Outcomes report for a system on which there have been DoS attacks. The chart shows how the traffic has been handled by the system. It shows aggregated data that is updated every few minutes.
Sample DoS Transaction Outcomes report
You can adjust which elements are listed in the table below the chart. This figure lists the virtual servers that traffic is attempting to access. By clicking one of the virtual servers (or other objects listed), you can drill down to see what is happening with that specific traffic. For example, here attacks are primarily taking place on vs_210, and much of the traffic is being blocked.
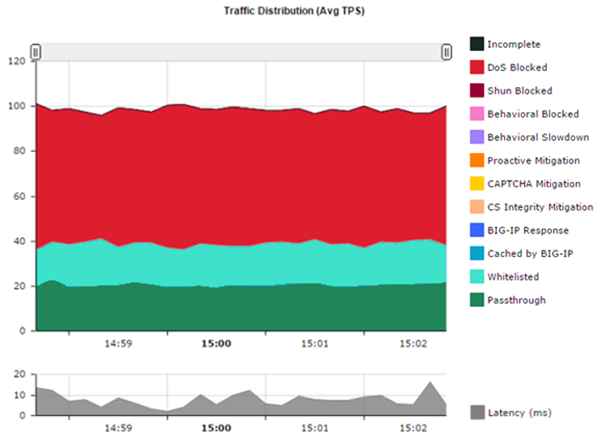
You can also open a real-time chart that is constantly updated by clicking the Open Real-Time Charts link. It is a popup screen that you can leave displayed on your computer. It shows the traffic distribution on the system.
Sample DoS real-time chart
You can go back to the DoS Statistics report and change the values for what is displayed using the Display and during settings to see additional information. Viewing different statistical views is useful to understanding and tracking DoS attacks.
In the lower table on the screen, Latency (ms) indicates how long it takes (in milliseconds) from the time a request reaches the system, for it to proceed to the web application server, and return a response. Note that dropped or blocked requests that do not reach the server, do not register latency because there is no full request-response cycle.


