Applies To:
Show Versions
Enterprise Manager
- 3.1.1
Overview: Health and performance monitoring statistics
When statistics data collection is enabled, Enterprise Manager stores the following information in its statistics database for each managed device on which the Data Collection Agent is installed:
- Specifics about the managed devices, such as host name, IP address, and software version
- Details, such as object type and name, about any enabled network objects associated with a managed device
- Performance and health data for managed devices and associated network objects
You can use collected statistics to display standardized reports about the health and performance of managed devices in your network. This helps you identify any systems that are not performing at full capacity and assists you in determining when you should add new devices.
To start collecting statistics, you must enable the collect statistics data feature and install the Data Collection Agent.
Enabling statistics data collection
- On the Main tab, click .
- For the Collect Statistics Data setting, select Enabled.
- Click the Save Changes button.
Installing the Data Collection Agent
About statistics profiles
A statistics profile defines the specific performance monitoring statistics information that you want Enterprise Manager to collect, such as bytes and packets, connections, CPU utilization, memory, and disk usage. The statistics profile types correspond to the type of object that you want to monitor.
To collect performance monitoring statistics, assign one or both of these profile types, to the managed objects in your network.
- Standard statistics profiles
- A standard statistics profile contains all the required metrics that Enterprise Manager must collect for a specific network object type, to successfully create standard reports.
- Custom statistics profiles
- A custom statistics profile allows you to define your own metrics and optional threshold values for an object. By enabling or disabling data collection for certain metrics, you can prioritize the information you are collecting, ensuring that system resources are allocated appropriately.
Statistics data collected for the standard statistics profiles
When statistics collection is enabled, Enterprise Manager collects the following statistics data to create standard reports.
| Report name | Statistics data collected for this report |
|---|---|
| Certificate Inventory | None |
| Device Inventory | None |
| Capacity Planning |
|
| Flapping Node | None |
| Flapping Pool Member | None |
| GTM Object Activity |
|
| LTM Node Inventory | None |
| SSL TPS Usage |
|
| LTM Object Activity |
|
| LTM Unused Object |
|
Creating a custom statistics profile
Assigning a statistics profile to a specific device or network object
Specifying a default statistics profile for newly discovered devices
- On the Main tab, click .
- From the Profile Name list, select the profile that you want to use as the default for any newly discovered devices.
- Click Save Changes.
About network object statistics
With Enterprise Manager, you can easily monitor the health and activity of managed objects in your network through collected statistics. You can view activity in a summary and detailed graph format. This information ensures that your network is performing efficiently and helps you to troubleshoot potential issues. Viewing statistics provides you with an overview and details about the health and activity of the objects in your network. You can customize the information displayed in the graphics on this screen by using rule classes. This flexibility provides you the at-a-glance view, while highlighting the statistics you are most interested in.
Displaying network object statistics and customizing view
Rule class descriptions
The statistics data displayed is defined by the associated rule class.
| Rule Class | Description |
|---|---|
| All Active | All statistics currently configured in the associated statistic profile |
| All Errors | All statistics related to error conditions |
| Commonly Used | A subset of commonly used statistics available in the associated statistic profile |
| Common Errors | A subset of commonly occurring errors available in the associated statistic profile |
| Device Health | A subset of device statistics related to the physical health of the device |
| Device Stats | A subset of device statistics related to the traffic management of the device |
| HTTP Stats | A subset of statistics related to HTTP traffic |
| Out of Range | A collection of statistics where the value is currently exceeding a user-set threshold |
| Red Line | A collection of resource-utilization statistics that have a user-set threshold |
| SSL Stats | A subset of statistics related to SSL traffic |
| TCP Stats | A subset of statistics related to TCP traffic |
| UDP Stats | A subset of statistics related to UDP traffic |
Modifying the number of records per screen to display
About statistics storage
Enterprise Manager stores statistical data until the system reaches the storage capacity, which is by default, 1 GB stored locally. When this capacity is met, the oldest data in the system is replaced with new data, up to the storage limit. This default amount is intentionally low because when you enable statistics collection it affects the overall performance of the system. Therefore, it is important to plan for your database storage needs by understanding your system's capacity and personalize your storage requirements so you can maximize the value of the statistics features. Once you have estimated the availability of storage on your system, you can change the default database storage capacity setting. Increasing the default setting is essential to monitoring statistics data over time.
To help you plan for statistics storage, you can view the system's hard drive allocation by file type to remove any unnecessary files and calculate statistics data storage.
Viewing hard drive storage allocation
- In the navigation pane, click .
- Review the storage allocation to identify any outdated or unnecessary file storage.
Calculating and modifying statistics storage allocation
This number is calculated based on the current rate of data collection and the amount of disk space you specified for the storage space allocation. To retain more or less historical data, you can change the storage allocation space. To help you determine how much disk space you want to allocate to statistics storage, you can recalculate the estimated number of storage days by modifying the storage space. When you have determined that you are satisfied with the storage space value, you can then opt to save the changes.
About statistics database backup and restoration
You can backup and restore the statistics database from the command line, or you can create a task to backup the statistics database on a regular schedule.
Scheduling statistics database backups
About external storage for health and performance monitoring statistics
By default, Enterprise Manager stores health and performance monitoring statistics data in the database located on its hard drive. You have the option of configuring Enterprise Manager to store these statistics on a hard drive that is separate (external) from the Enterprise Manager system. Storing statistics on an external database clears space on Enterprise Manager for more storage of archives, images, configuration files, and so forth. A space dedicated only to health and performance monitoring statistic data can also provide you with more historical data storage.
To use an external database for health and performance monitoring statistics storage, you must create the external database and then configure Enterprise Manager to store data on that database.
If you previously collected data locally on the Enterprise Manager system, you have the option to back up and restore the data to the external database.
Task summary
Creating an external database for health and performance monitoring statistics
Storing statistics on an external database clears space on Enterprise Manager for more storage of archives, images, configuration files, and so forth. A space dedicated only to health and performance monitoring statistics can also provide you with more historical data.
You create an external database for statistics storage by issuing SQL commands on a system that is running Oracle MySQLversion 5.1 with patch 52 or later.
Backing up a local statistics database to an external statistics database
If you previously collected data locally on the Enterprise Manager system, you can back up and restore the local data to the external database that you created.
- On the Main tab, click .
- From the Collect Statistics Data list, select Disabled.
- Click the Save Changes button.
- On the system on which the local database is located, create a back up of the data by running the following command: mysqldump -u <user> -p -R f5em_extern> dump.sql, where <user> is the user name assigned to the database.
- On the system on which you created the external database, restore the data by running the following command: mysql -u <user> -p -D remotedb < dump.sql, where <user> is the user name assigned to the database.
- On the Main tab, click .
- From the Collect Statistics Data list, select Enabled.
- Click the Save Changes button.
Configuring Enterprise Manager to store statistics to an external database
After you have created the external database on the remote system, you can configure Enterprise Manager to store data there.
Configuring Enterprise Manager to store health and performance monitoring statistics on an external database frees system resources, and provides you with space to store statistics that is limited only by the system's hard drive on which you configure the external database.
If you have two Enterprise Manager systems configured as a high availability system, configure the external database the same way on each system.
Removing local statistics data storage
- On the Main tab, click .
- Click the Delete Local Statistics Data button.
- Click Confirm.
Backing up and restoring an external statistics database
Enterprise Manager cannot run scheduled backups and restoration for statistics stored on an external database. When statistics are stored on a remote system, the administrator of must perform backup and restoration tasks independently of Enterprise Manager.
Backing up an external statistics database
Restoring the external statistics database
About reports
You can use Enterprise Manager reports to retrieve and view information about the devices and BIG-IP Local Traffic Manager (LTM) and BIG-IP Global Traffic Manager (GTM) objects in your network. To create a report, you define parameters, the devices from which to collect the data, and the object types you want to include. You can collect data and view the report immediately, or you can schedule the report to run in the future either once, or at regular intervals. Depending on the report type, completed reports are presented in Adobe portable document format (PDF) or comma-separated value (CSV) text, which you can export to a spreadsheet, such as Microsoft Excel. The Capacity Planning report also supports an interactive HTML format.
Standard reports
This table outlines the standard reports that you can create using Enterprise Manager.
| Report name | Description | Use this report to | Format |
|---|---|---|---|
| Capacity Planning | Performance capacity details about CPU usage, memory usage, and throughput | To help you identify devices that are running near the edge of capacity and to make any required changes | PDF and HTML |
| Certificate Inventory | Information about the SSL certificates for the devices that Enterprise Manager has discovered in your network | Easily manage multiple SSL certificates and identify those that have expired, or are about to expire | CSV |
| Device Inventory | Comprehensive details about the devices that Enterprise Manager has discovered in your network | Centrally manage all of the details of the managed devices in your network | CSV |
| Flapping LTM Node | A list of Local Traffic Manager (LTM) nodes that repeatedly restart, going from an up state to a down state and back again (referred to as flapping) | Identify and troubleshoot potential issues with the connectivity to nodes in your network | |
| Flapping LTM Pool Member | A list of pool members that repeatedly restart, going from an up state to a down state and back again. | Identify and troubleshoot potential issues with the connectively to pool members in your network | |
| GTM Object Activity | Global Traffic Manager (GTM) object activity details | Monitor the activity and performance of GTM objects in your network, troubleshoot potential issues, and reallocate resources as needed | |
| LTM Node Inventory | The names of nodes that Enterprise Manager has discovered in your network | Manage the status and state of all of the nodes in your network | |
| LTM Object Activity | Local Traffic Manager (LTM) object activity details | Monitor the activity and performance of LTM objects in your network, troubleshoot potential issues, and reallocate resources as needed | |
| SSL TPS Usage | SSL certificate transactions per second (TPS) for each device that Enterprise Manager has discovered in your network | Monitor SSL certificate activity trends for your devices, and to plan for platform upgrades and future transition to 2K bit SSL certificate keys | |
| Unused LTM Objects | All Local Traffic Manager (LTM) objects that have had no activity within a configured date parameter | Monitor the activity of LTM objects in your network, troubleshoot potential issues, and reallocate resources as needed |
Creating reports
Report options
The report options vary depending on the type of report that you are creating.
| Capacity Planning report setting | Default value | Action |
|---|---|---|
| Aggregation Interval | No default value | Specify the interval over which the data is averaged, to find the maximum capacity reached during the data collection period. |
| Filter | N/A | To restrict the number of devices displayed, type a full or partial name or IP address in the field, and click the Filter button. |
| Device Name | No default value | Select the check box next to the devices from which you want to collect data. You must select at least one device. |
| Memory headroom (%) | 85 | Specify the maximum memory threshold to use for calculating the projected date that the capacity limit is reached. |
| CPU headroom (%) | 85 | Specify the maximum CPU threshold to use for calculating the projected date that the capacity limit is reached. |
| Throughput headroom (bits/sec) | 1000000 | Specify the maximum throughput threshold to use for calculating the projected date that the capacity limit is reached. |
| Flapping LTM Node report setting | Default value | Action |
|---|---|---|
| Interval (minutes) | 30 | Specify the period of time within which to check for flapping nodes. |
| Threshold (count) | 2 | Specify the minimum number of times during the interval that a node must flap before it is included in the report. |
| Filter | N/A | To restrict the number of devices displayed, type a full or partial name or IP address in the field, and click the Filter button. |
| Device Name | No default value | Select the check box next to the devices from which you want to collect data. You must select at least one device. |
| Flapping LTM Pool Member report setting | Default value | Action |
|---|---|---|
| Interval (minutes) | 30 | Specify the period of time within which to check for flapping pool members. |
| Threshold (count) | 2 | Specify the minimum number of times during the interval that a pool member must flap before it is included in the report. |
| Filter | N/A | To restrict the number of devices displayed, type a full or partial name or IP address in the field, and click the Filter button. |
| Device Name | No default value | Select the check box next to the devices from which you want to collect data. You must select at least one device. |
| GTM Object Activity report setting | Default value | Action |
|---|---|---|
| Max number of objects | 10 | Specify the maximum number of objects that you want displayed in the report. |
| Most or Least Active | Most Active | From the list, select an option to display the most active or the least active objects. |
| Filter | N/A | To restrict the number of devices displayed, type a full or partial name or IP address in the field, and click the Filter button. |
| Device Name | No default value | Select the check box next to the devices from which you want to collect data. You must select at least one device. |
| LTM Node Inventory report setting | Default value | Action |
|---|---|---|
| Filter | N/A | To restrict the number of devices displayed, type a full or partial name or IP address in the field, and click the Filter button. |
| Device Name | No default value | Select the check box next to the devices from which you want to collect data. You must select at least one device. |
| LTM Object Activity report setting | Default value | Action |
|---|---|---|
| Max number of objects | 10 | Specify the maximum number of objects that you want displayed in the report. |
| Most or Least Active | Most Active | From the list, select an option to display the most active or the least active objects. |
| Show Object | All object types | Clear the check box next to the object type for which you do not want to collect data. |
| Filter | N/A | To restrict the number of devices displayed, type a full or partial name or IP address in the field, and click the Filter button. |
| Device Name | No default value | Select the check box next to the devices from which you want to collect data. You must select at least one device. |
| SSL TPS Usage report setting | Default value | Action |
|---|---|---|
| Filter | N/A | To restrict the number of devices displayed, type a full or partial name or IP address in the field, and click the Filter button. |
| Device Name | No default value | Select the check box next to the devices from which you want to collect data. You must select at least one device. |
| Unused LTM Objects report setting | Default value | Action |
|---|---|---|
| Show Object | All object types | Clear the check box next to the object types for which you do not want to collect data. |
| Filter | N/A | To restrict the number of devices displayed, type a full or partial name or IP address in the field, and click the Filter button. |
| Device Name | No default value | Select the check box next to the device from which you want to collect data. You must select at least one device. |
Scheduling reports
Viewing the interactive HTML version of the Capacity Planning report
After Enterprise Manager has gathered the specified data for a Capacity Planning report, it lists the report in the Completed Reports area. When the report is displayed in this area, you can view the interactive HTML version. When you view the HTML version of this report, you can modify the settings to instantly display updated capacity projection end dates. Alternatively, you can save the report as a static PDF file, as you do all other Enterprise Manager reports.
Report components
The components of each report vary depending on the report type.
Capacity Planning report components
- Device name
- Device IP address
- Metric (CPU, memory, throughput)
- Peak value
- Projected run out date range
Certificate Inventory report components
- Device name
- Certificate name
- Certificate type
- Key type
- Version
- Serial number
- Certificate expiration date
- File name
- Bit length
- Management mode
- Common name
- Certificate organization
- Certificate division
- Certificate country
- Certificate state
- Certificate locality
- Issuer organization
- Issuer division
- Issuer country
- Issuer state
- Issuer locality
Device Inventory report components
- Device name
- Device IP address
- System ID
- Configuration utility address
- Management port address
- Management interface address
- Management netmask address
- Management gateway address
- Enterprise Manager server IP address
- Enterprise Manager IP address
- Clock skew data
- Time zone
- Uptime (hours:minutes)
- Platform identification
- Serial number
- Failover state
- Failover mode
- Failover forced active
- Peer state
- Configuration synchronization status
- Last configuration date
- Last configuration synchronization date
- Last refresh date
- User authentication URL
- Shell access status
- Shell access filter
- Device location
- Device contact information
- Active boot (slot) location
- Service contract end date
- Software product
- Software version
- Software build number
- Base registration key
Flapping LTM Node report components
- Node IP address
- Device name
- Flap start date and time
- Flap end date and time
- Final state of node
- Flap number
Flapping LTM Pool Member report components
- Pool IP address
- Device name
- Flap start date and time
- Flap end date and time
- Final state of pool
- Flap number
GTM Object Activity report components
- Virtual server name
- Device name
- Bits per second
LTM Node Inventory report components
- Node IP address
- Monitor status
- Session state
- Ratio
- Connection limit
LTM Object Activity report components
- Number
- Virtual server name
- Device name
- Connections per second
- Bits per second
SSL TPS Usage report components
- Version (product name, version, and build number)
- Platform
- Serial number
- SSL per core
- Max TPS (maximum number of recorded SSL certificate transactions per second)
- Licensed TPS
Unused LTM Objects report components
- Object type
- Object name
About custom health and activity statistics queries and reports
With Enterprise Manager you can collect statistics and view details about the health and activity of the managed devices in your network. You also have the option use this collected data to create your own queries and customized graphs and reports using the details provided in the following sections in conjunction with any MySQL Connector, (available at http://dev.mysql.com/downloads/connector).
Overview of statistics types
Enterprise Manager stores in its health and performance monitoring database three types of statistics: counter statistics, gauge statistics, and threshold state statistics.
Counter statistics increment periodically to indicate a rate of change. To report the rate of change for a statistic during a specific period of time, the system performs a query for the counter statistics values and the timestamps for the beginning and end of the specified time period. Once the system receives the query response, it calculates and reports the rate of change.
Gauge statistics are absolute values for certain components, such as temperature, fan speed, and current connections. The system does not have to perform a calculation to report the absolute value of a gauge statistic.
A threshold state statistic is the current state of a specific statistic value as it relates to its threshold. That is, the threshold state indicates if the statistic value is above, below, or within a specified threshold.
Counter statistic query sample
The following SQL query example retrieves the counter statistic values for the server_pkts_in field for a node on the host device, bigip-central.
To calculate the rate of change for this example, the system compares the previous value (perfmon_node_stat p) and the current value (perfmon_node_stat c) in the perfmon_node_stat table. With this data, the system calculates the rate of change for the counter statistic using the calculation (V1-V0) / (T1-T0), where V1 is the value of the server_pkts_in field at time c.t, and V0 is the value of the server_pkts_in field at time p.t. (The insert_order field indicates the previous timestamp and value for that particular node.)
Gauge statistic query sample
The following example shows a gauge statistic SQL query that retrieves all values over the past hour for the chassis temperature on the host device, bigip-central.
Threshold state statistic query sample
The following SQL query retrieves the current threshold state values for the perfmon_vip_stat.client_pkts_in field for all virtual servers associated with managed devices.
About the health and performance monitoring database structure
The Enterprise Manager health and performance monitoring database consists of fact tables and dimension tables. The following diagram is an overview of the basic structure of the statistics database.
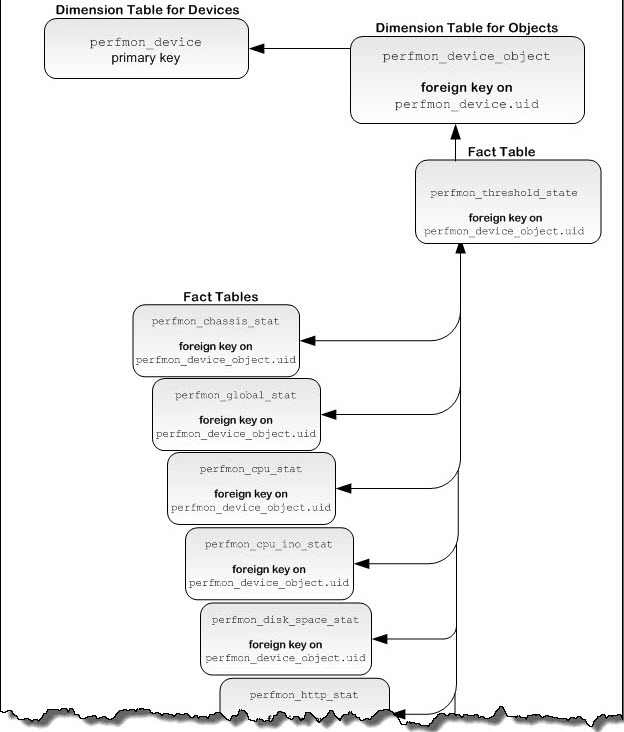
About dimension tables
Dimension tables contain object-specific details about the statistics for each managed device.
Device identification (perfmon_device)
The perfmon_device database table contains details about each managed device.
| Field | Type | Null Value Allowed? | Description |
|---|---|---|---|
| uid | int unsigned | NO | Primary key |
| system_id | varchar(128) | NO | Device identification |
| host_name | varchar(128) | NO | Host name for the device |
| address | varchar(64) | NO | IP address of the device |
| boot_location | varchar(16) | NO | Current boot location |
| product_name | varchar(128) | NO | Name of installed software |
| product_version | varchar(64) | NO | Version of installed software |
| product_build_number | varchar(32) | NO | Build number of installed software |
| ssl_total_tps | int unsigned | YES | Licensed SSL transactions per minute |
| ssl_per_core | varchar(16) | YES | Indicates if the SSL per core feature is licensed |
| appliance_sn | varchar(64) | YES | Serial number of the device |
| platform | varchar(16) | YES | Platform identification number |
| cpu_count | int | YES | Number of CPU cores on the device |
Device object identification (perfmon_device_object)
The perfmon_device_object database table contains identification details about the network objects associated with each managed device.
| Field | Type | Null Value Allowed? | Description |
|---|---|---|---|
| uid | int unsigned | NO | Primary key |
| perfmon_device_uid | int unsigned | NO | Foreign key on perfmon_device.uid |
| name | varchar(256) | NO | Uniquely identifies this object |
| perform_object_type | enum | NO | Type of object in the statistics table ( global,chassis,cpu,cpu_info,disk_space,udp,tcp,http,clientssl,vip,pool,pool_member,node) |
About fact tables
Fact tables contain fields that are specific to the collected statistics type.
The partition_number field is not documented in the following fact tables. Do not reference the partition_number field in any custom code that you write, because that field is subject to change.
Chassis statistics (perfmon_chassis_stat)
The perfmon_chassis_stat database table contains the temperature statistics of the chassis for each managed device.
| Field | Type | Null Value Allowed? | Description | Query Type (if applicable) |
|---|---|---|---|---|
| perfmon_device_object_uid | int unsigned | NO | Used to identify the device and object as the foreign key on perfmon_device_object.uid | N/A |
| insert_order | int unsigned | NO | Used to calculate delta values for counter statistics | N/A |
| t | timestamp | NO | Time of data sample | N/A |
| temperature | int unsigned | YES | Temperature of chassis | gauge |
CPU statistics (perfmon_cpu_stat)
The perfmon_cpu_stat database table contains the temperature and fan speed statistics for each managed device.
| Field | Type | Null Value Allowed? | Description | Query Type (if applicable) |
|---|---|---|---|---|
| perfmon_device_object_uid | int unsigned | NO | Used to identify the device and object as the foreign key on perfmon_device_object.uid | N/A |
| insert_order | int unsigned | NO | Used to calculate delta values for counter statistics | N/A |
| t | timestamp | NO | Time of data sample | N/A |
| fan_speed | smallint unsigned | YES | Speed of CPU fan | gauge |
| temperature | int unsigned | YES | Temperature of CPU fan | gauge |
CPU usage statistics (perfmon_cpu_info_stat)
The perfmon_cpu_info_stat database table contains statistics about the CPU usage for each managed device.
| Field | Type | Null Value Allowed? | Description | Query Type (if applicable) |
|---|---|---|---|---|
| perfmon_device_object_uid | int unsigned | NO | Used to identify the device and object as the foreign key on perfmon_device_object.uid | N/A |
| insert_order | int unsigned | NO | Used to calculate delta values for counter statistics | N/A |
| t | timestamp | NO | Time of data sample | N/A |
| cpu_usage_ratio | smallint unsigned | YES | Ratio of CPU usage to available CPU capacity | gauge |
Disk space statistics (perfmon_disk_space_stat)
The perfmon_disk_space_stat database table contains details about the disk space for each managed device.
| Field | Type | Null Value Allowed? | Description | Query Type (if applicable) |
|---|---|---|---|---|
| perfmon_device_object_uid | int unsigned | NO | Used to identify the device and object as the foreign key on perfmon_device_object.uid | N/A |
| insert_order | int unsigned | NO | Used to calculate delta values for counter statistics. | N/A |
| t | timestamp | NO | Time of data sample | N/A |
| block_size | int unsigned | YES | Size of blocks on disk | gauge |
| tot_blocks | int unsigned | YES | Number of blocks on disk | gauge |
| free_blocks | int unsigned | YES | Number of unused blocks on disk | gauge |
| block_ratio | smallint unsigned | YES | Ratio of free blocks to available blocks | gauge |
| tot_nodes | int unsigned | YES | Number of disk nodes | gauge |
| free_nodes | int unsigned | YES | Number of free disk nodes | gauge |
GTM pool member statistics (perfmon_gtm_pool_member_stat)
The perfmon_gtm_pool_member_stat database table contains performance for each managed Global Traffic Manager (GTM) pool member.
| Field | Type | Null Value Allowed? | Description | Query Type (if applicable) |
|---|---|---|---|---|
| perfmon_device_object_uid | int unsigned | NO | Used to identify the device and object as the foreign key on perfmon_device_object.uid | N/A |
| insert_order | int unsigned | NO | Used to calculate delta values for counter statistics | N/A |
| t | timestamp | NO | Time of data sample | N/A |
| preferred | int unsigned | YES | Rate of requests per second successfully processed by the configured preferred load balancing method | counter |
| alternate | int unsigned | YES | Rate of requests per second successfully processed by the configured alternate load balancing method | counter |
| drop | int unsigned | YES | Rate of requests per second that were not successfully processed, and were returned to the requesting DNS server | counter |
| fallback | int unsigned | YES | Rate of requests per second that were successfully processed by the configured fall-back load balancing method | counter |
GTM pool statistics (perfmon_gtm_pool_stat)
The perfmon_gtm_pool_stat database table contains performance statistics for each managed Global Traffic Manager (GTM) pool.
| Field | Type | Null Value Allowed? | Description | Query Type (if applicable) |
|---|---|---|---|---|
| perfmon_device_object_uid | int unsigned | NO | Used to identify the device and object as the foreign key on perfmon_device_object.uid | N/A |
| insert_order | int unsigned | NO | Used to calculate delta values for counter statistics | N/A |
| t | timestamp | NO | Time of data sample | N/A |
| preferred | int unsigned | YES | Rate of requests per second successfully processed by the configured preferred load balancing method | counter |
| dropped | int unsigned | YES | Rate of requests per second that were not successfully processed, and were returned to the requesting DNS server | counter |
| fallback | int unsigned | YES | Rate of requests per second that were successfully processed by the configured fall-back load balancing method | counter |
GTM virtual server statistics (perfmon_gtm_vs_stat)
The perfmon_gtm_vs_stat database table contains performance and capacity statistics for each managed Global Traffic Manager (GTM) virtual server.
| Field | Type | Null Value Allowed? | Description | Query type (if applicable) |
|---|---|---|---|---|
| perfmon_device_object_uid | int unsigned | NO | Used to identify the device and object as the foreign key on perfmon_device_object.uid | N/A |
| insert_order | int unsigned | NO | Used to calculate delta values for counter statistics | N/A |
| t | timestamp | NO | Time of data sample | N/A |
| cpu | int unsigned | YES | Current amount of CPU used by this GTM virtual server | gauge |
| mem | int unsigned | YES | Current amount of memory used by this GTM server | gauge |
| bits_in | int unsigned | YES | Current amount of throughput received, measured in bits per second | gauge |
| bits_out | int unsigned | YES | Current amount of throughput sent, measured in bits per second | gauge |
| conn | bigint unsigned | YES | Current number of connections, measured per second | gauge |
GTM wide IP statistics (perfmon_gtm_wideip_stat)
This perfmon_gtm_wideip_stat database table contains performance statistics for each managed Global Traffic Manager (GTM) wide IP.
| Field | Type | Null value allowed? | Description | Query type (if applicable) |
|---|---|---|---|---|
| perfmon_device_object_uid | int unsigned | NO | Used to identify the device and object as the foreign key on perfmon_device_object.uid | N/A |
| insert_order | int unsigned | NO | Used to calculate delta values for counter statistics | N/A |
| t | timestamp | NO | Time of data sample | N/A |
| preferred | int unsigned | YES | Rate of requests per second successfully processed by the configured preferred load balancing method | counter |
| alt | int unsigned | YES | Rate of requests per second successfully processed by the configured alternate load balancing method | counter |
| dropped | int unsigned | YES | Rate of requests per second that were not successfully processed, and were returned to the requesting DNS server | counter |
| fallback | int unsigned | YES | Rate of requests per second that were successfully processed by the configured fall-back load balancing method | counter |
HTTP traffic statistics (perfmon_http_stat)
The perfmon_http_stat database table contains HTTP-related traffic statistics for each managed device.
| Field | Type | Null Value Allowed? | Description | Query Type (if applicable) |
|---|---|---|---|---|
| perfmon_device_object_uid | int unsigned | NO | Used to identify the device and object as the foreign key on perfmon_device_object.uid | N/A |
| insert_order | int unsigned | NO | Used to calculate delta values for counter statistics | N/A |
| t | timestamp | NO | Time of data sample | N/A |
| http_cookie_persist_inserts | bigint unsigned | YES | Rate of successful attempts to insert HTTP headers for cookie persistence (set-cookie header insertions) | counter |
| http_resp_2xx_cnt | bigint unsigned | YES | Rate of server-side responses in range of 200 to 206 (successful responses) | counter |
| http_resp_3xx_cnt | bigint unsigned | YES | Rate of server-side responses in range of 300 to 307 (redirection responses) | counter |
| http_resp_4xx_cnt | bigint unsigned | YES | Rate of server-side responses in range of 400 to 417 (client errors) | counter |
| http_resp_5xx_cnt | bigint unsigned | YES | Rate of server-side responses in range of 500 to 505 (server errors) | counter |
| http_number_reqs | bigint unsigned | YES | Rate of HTTP requests | counter |
| http_get_reqs | bigint unsigned | YES | Rate of HTTP GET requests | counter |
| http_post_reqs | bigint unsigned | YES | Rate of HTTP POST requests | counter |
| http_v9_reqs | bigint unsigned | YES | Rate of version 9 requests | counter |
| http_v10_reqs | bigint unsigned | YES | Rate of version 10 requests | counter |
| http_max_keepalive_req | bigint unsigned | YES | Maximum number of requests made in a connection | gauge |
| http_resp_bucket_1k | bigint unsigned | YES | Rate of responses under 1K | counter |
| http_resp_bucket_4k | bigint unsigned | YES | Rate of responses between 1K and 4K | counter |
| http_resp_bucket_16k | bigint unsigned | YES | Rate of responses between 4K and 16K | counter |
| http_resp_bucket_32k | bigint unsigned | YES | Rate of responses between 16K and 32K | counter |
| http_resp_bucket_64k | bigint unsigned | YES | This field is deprecated; use larger buckets | counter |
| http_idle_conn_splices | bigint unsigned | YES | Rate of response bytes before compression is applied | counter |
| http_idle_conns | bigint unsigned | YES | Rate of idle HTTP connections at the time of query | counter |
| http_precompress_bytes | bigint unsigned | YES | Rate of response bytes before compression is applied | counter |
| http_postcompress_bytes | bigint unsigned | YES | Rate of response bytes after compression is applied | counter |
| http_null_compress_bytes | bigint unsigned | YES | Rate of bytes subjected to NULL compression for license enforcement | counter |
| http_html_precompress_bytes | bigint unsigned | YES | Rate of bytes for HTML MIME types before compression is applied | counter |
| http_html_postcompress_bytes | bigint unsigned | YES | Rate of bytes for HTML MIME types after compression is applied | counter |
| http_css_precompress_bytes | bigint unsigned | YES | Rate of bytes for CSS MIME types before compression is applied | counter |
| http_css_postcompress_bytes | bigint unsigned | YES | Rate of bytes for CSS MIME types after compression is applied | counter |
| http_js_precompress_bytes | bigint unsigned | YES | Rate of bytes for JS MIME types before compression is applied | counter |
| http_js_postcompress_bytes | bigint unsigned | YES | Rate of bytes for JS MIME types after compression is applied | counter |
| http_xml_precompress_bytes | bigint unsigned | YES | Rate of bytes for XML MIME types before compression is applied | counter |
| http_xml_postcompress_bytes | bigint unsigned | YES | Rate of bytes for XML MIME types after compression is applied | counter |
| http_sgml_precompress_bytes | bigint unsigned | YES | Rate of bytes for SGML MIME types before compression is applied | counter |
| http_sgml_postcompress_bytes | bigint unsigned | YES | Rate of bytes for SGML MIME types after compression is applied | counter |
| http_plain_precompress_bytes | bigint unsigned | YES | Rate of bytes for plain MIME types before compression is applied | counter |
| http_plain_postcompress_bytes | bigint unsigned | YES | Rate of bytes for plain MIME types after compression is applied | counter |
| http_octet_precompress_bytes | bigint unsigned | YES | Rate of bytes for octet MIME types before compression is applied | counter |
| http_octet_postcompress_bytes | bigint unsigned | YES | Rate of bytes for octet MIME types after compression is applied | counter |
| http_image_precompress_bytes | bigint unsigned | YES | Rate of bytes for image MIME types before compression is applied | counter |
| http_image_postcompress_bytes | bigint unsigned | YES | Rate of bytes for image MIME types after compression is applied | counter |
| http_video_precompress_bytes | bigint unsigned | YES | Rate of bytes for video MIME types before compression is applied | counter |
| http_video_postcompress_bytes | bigint unsigned | YES | Rate of bytes for video MIME types after compression is applied | counter |
| http_audio_precompress_bytes | bigint unsigned | YES | Rate of bytes for audio MIME types before compression is applied | counter |
| http_audio_postcompress_bytes | bigint unsigned | YES | Rate of bytes for audio MIME types after compression is applied | counter |
| http_other_precompress_bytes | bigint unsigned | YES | Rate of bytes for other MIME types before compression is applied | counter |
| http_other_postcompress_bytes | bigint unsigned | YES | Rate of bytes for other MIME types after compression is applied | counter |
| http_ramcache_hits | bigint unsigned | YES | Rate of RAM cache hits | counter |
| http_ramcache_misses | bigint unsigned | YES | Rate of RAM cache misses | counter |
| http_ramcache_misses_all | bigint unsigned | YES | Rate of RAM cache misses, including data that could not be cached | counter |
| http_ramcache_hit_bytes | bigint unsigned | YES | Rate of RAM cache hits, reported in bytes | counter |
| http_ramcache_miss_bytes | bigint unsigned | YES | Rate of RAM cache misses, excluding data that could not be cached, reported in bytes | counter |
| http_ramcache_miss_bytes_all | bigint unsigned | YES | Rate of all RAM cache misses, reported in bytes | counter |
| http_ramcache_size | bigint unsigned | YES | Maximum available RAM cache available, reported in megabytes | gauge |
| http_ramcache_count | bigint unsigned | YES | Rate of items stored in RAM cache | counter |
| http_ramcache_evictions | bigint unsigned | YES | Rate of items removed from RAM cache to free memory for new items | counter |
Memory usage and connection statistics (perfmon_global_stat)
The perfmon_global_stat database table contains aggregated server-side and client-side statistics about memory usage and connections for each managed device.
| Field | Type | Null Value Allowed? | Description | Query Type (if applicable) |
|---|---|---|---|---|
| perfmon_device_object_uid | int unsigned | NO | Used to identify the device and object as the foreign key on perfmon_device_object.uid | N/A |
| insert_order | int unsigned | NO | Used to calculate delta values for counter statistics | N/A |
| t | timestamp | NO | Time of data sample | N/A |
| client_tot_byte_in | bigint unsigned | YES | Rate of client-side bytes received | counter |
| client_tot_bytes_out | bigint unsigned | YES | Rate of client-side bytes sent | counter |
| client_pkts_in | bigint unsigned | YES | Rate of client-side packets received | counter |
| client_pkts_out | bigint unsigned | YES | Rate of client-side packets sent | counter |
| client_maxconns | bigint unsigned | YES | Maximum number of client-side connections reported since statistics collection was set or reset for the device | gauge |
| client_tot_conns | bigint unsigned | YES | Rate of client-side connections per second | counter |
| client_cur_conns | bigint unsigned | YES | Current number of client-side connections | gauge |
| server_tot_bytes_in | bigint unsigned | YES | Rate of server-side bytes received | counter |
| server_tot_bytes_out | bigint unsigned | YES | Rate of server-side bytes sent | counter |
| server_pkts_in | bigint unsigned | YES | Rate of server-side packets received | counter |
| server_pkts_out | bigint unsigned | YES | Rate of server-side packets sent | counter |
| server_maxconns | bigint unsigned | YES | Maximum number of concurrent server-side connections reported since statistics collection was set or reset for the device | gauge |
| server_cur_conns | bigint unsigned | YES | Current number of active server-side connections | gauge |
| server_tot_conns | bigint unsigned | YES | Rate of server-side connections | counter |
| mem | bigint unsigned | YES | Available memory | gauge |
| mem_used | bigint unsigned | YES | Memory in use | gauge |
| mem_ratio | smallint unsigned | YES | Ratio of available memory to memory in use | gauge |
| dropped | bigint unsigned | YES | Rate of dropped packets | counter |
| err_in | bigint unsigned | YES | Rate of errors received | counter |
| err_out | bigint unsigned | YES | Rate of errors sent | counter |
LTM node statistics (perfmon_node_stat)
The perfmon_node_stat database table contains statistics for traffic and connections to Local Traffic Manager (LTM) node objects for each managed device.
| Field | Type | Null value allowed? | Description | Query type (if applicable) |
|---|---|---|---|---|
| perfmon_device_object_uid | int unsigned | NO | Used to identify the device and object as the foreign key on perfmon_device_object.uid | N/A |
| insert_order | int unsigned | NO | Used to calculate delta values for counter statistics | N/A |
| t | timestamp | NO | Time of data sample | N/A |
| server_tot_bytes_in | bigint unsigned | YES | Total number of server-side bytes received by the specified node address since statistics collection was set or reset for the device | counter |
| server_tot_bytes_out | bigint unsigned | YES | Rate of server-side bytes sent by the specified node address | counter |
| server_pkts_in | bigint unsigned | YES | Rate of server-side packets received by the specified node address | counter |
| server_pkts_out | bigint unsigned | YES | Rate of server-side packets sent by the specified node address | counter |
| server_maxconns | bigint unsigned | YES | Maximum number of concurrent server-side connections to the specified node address since statistics collection was set or reset for the device | gauge |
| server_tot_conns | bigint unsigned | YES | Rate of server-side connections to the specified node address | counter |
| server_cur_conns | bigint unsigned | YES | Current number of active server-side connections to the specified node address | gauge |
LTM pool member statistics (perfmon_pool_member_stat)
The perfmon_pool_member_stat database table contains traffic and connection statistics for Local Traffic Manager (LTM) pool members for each managed device.
| Field | Type | Null Value Allowed? | Description | Query Type (if applicable) |
|---|---|---|---|---|
| perfmon_device_object_uid | int unsigned | NO | Used to identify the device and object as the foreign key on perfmon_device_object.uid | N/A |
| insert_order | int unsigned | NO | Used to calculate delta values for counter statistics | N/A |
| t | timestamp | NO | Time of data sample | N/A |
| server_tot_bytes_in | bigint unsigned | YES | Rate of server-side bytes received by the specified pool | counter |
| server_tot_bytes_out | bigint unsigned | YES | Rater of server-side bytes sent by the specified pool | counter |
| server_pkts_in | bigint unsigned | YES | Rate of server-side packets received from the specified pool | counter |
| server_pkts_out | bigint unsigned | YES | Rate of server-side packets sent from the specified pool | counter |
| server_maxconns | bigint unsigned | YES | Maximum number of concurrent server-side connections to the specified pool reported since statistics collection was set or reset for the device | gauge |
| server_tot_conns | bigint unsigned | YES | Rate of server-side connections to the specified pool | counter |
| server_cur_conns | bigint unsigned | YES | Current number of server-side connections to the specified pool | gauge |
LTM pool statistics (perfmon_pool_stat)
The perfmon_pool_stat database table contains statistics for traffic and connections to Local Traffic Manager (LTM) pools for each managed device.
| Field | Type | Null value allowed? | Description | Query type (if applicable) |
|---|---|---|---|---|
| perfmon_device_object_uid | int unsigned | NO | Used to identify the device and object as the foreign key on perfmon_device_object.uid | N/A |
| insert_order | int unsigned | NO | Used to calculate delta values for counter statistics | N/A |
| t | timestamp | NO | Time of data sample | N/A |
| server_tot_bytes_in | bigint unsigned | YES | Rate of server-side bytes received by the specified pool | counter |
| server_tot_bytes_out | bigint unsigned | YES | Rate of server-side bytes sent by the specified pool | counter |
| server_pkts_in | bigint unsigned | YES | Rate of server-side packets received from the specified pool | counter |
| server_pkts_out | bigint unsigned | YES | Rate of server-side packets sent from the specified pool | counter |
| server_maxconns | bigint unsigned | YES | Maximum number of server-side connections to the specified pool reported since statistics collection was set or reset for the device | gauge |
| server_tot_conns | bigint unsigned | YES | Rate of server-side connections to the specified pool reported | counter |
| server_cur_conns | bigint unsigned | YES | Current number of active server-side connections to the specified pool | gauge |
TCP connection statistics (perfmon_tcp_stat)
The perfmon_tcp_stat database table contains TCP connection statistics for each managed device.
| Field | Type | Null Value Allowed? | Description | Query Type (if applicable) |
|---|---|---|---|---|
| perfmon_device_object_uid | int unsigned | NO | Used to identify the device and object as the foreign key on perfmon_device_object.uid | N/A |
| insert_order | int unsigned | NO | Used to calculate delta values for counter statistics | N/A |
| t | timestamp | NO | Time of data sample | N/A |
| open | int unsigned | YES | Rate of current open TCP connections | counter |
| closewait | int unsigned | YES | Rate of current TCP connections in CLOSE-WAIT/LAST-ACK state | counter |
| finwait | int unsigned | YES | Rate of current connections in FIN-WAIT/CLOSING state | counter |
| timewait | int unsigned | YES | Rate of current connections in TIME-WAIT state | counter |
| accept | bigint unsigned | YES | Rate of TCP connections accepted | counter |
| acceptfails | bigint unsigned | YES | Rate of TCP connections not accepted | counter |
| conn | bigint unsigned | YES | Rate of TCP connections established | counter |
| connfail | bigint unsigned | YES | Rate of TCP connection failures | counter |
| expires | bigint unsigned | YES | Rate of TCP connections that expired due to idle timeout | counter |
| abandons | bigint unsigned | YES | Rate of TCP connections abandoned due to retries and Keep-Alive attempts | counter |
| rxrst | bigint unsigned | YES | Rate of received RST packets | counter |
| rxbadsum | bigint unsigned | YES | Rate of bad checksum packets | counter |
| rxbadseg | bigint unsigned | YES | Rate of malformed segments | counter |
| rxcookie | bigint unsigned | YES | Rate of received SYN-cookies | counter |
| rxbadcookie | bigint unsigned | YES | Rate of bad SYN-cookies | counter |
| syncacheover | bigint unsigned | YES | Rate of SYN-cache overflow | counter |
| txrexmits | bigint unsigned | YES | Rate of retransmitted segments | counter |
Threshold state (perfmon_threshold_state)
The perfmon_threshold_state database table contains the current threshold state of each managed device.
| Field | Type | Null Value Allowed? | Description | Query Type (if applicable) |
|---|---|---|---|---|
| perfmon_device_object_uid | int unsigned | NO | Used to identify the device and object as the foreign key on perfmon_device_object.uid | N/A |
| stat_column_name | varchar(256) | NO | Identifies the individual statistics to which this threshold applies | threshold |
| collection interval | int unsigned | NO | Interval at which this statistic is collected | threshold |
| status | enum | NO | Status of the statistic collection (enabled,disabled, profile_change) | threshold |
| min_threshold | bigint unsigned | YES | Minimum value of threshold | threshold |
| threshold_state | enum | NO | State of the threshold range ( BELOW_MIN_THRESHOLD,ABOVE_MAX_THRESHOLD,WITHIN_THRESHOLD) | threshold |
| threshold_exceeded_since | timestamp | YES | Current database has exceeded threshold since this time | threshold |
| last_alert_fired | timestamp | YES | Time that the last alert was triggered for this out-of-threshold event | threshold |
UDP connection statistics (perfmon_udp_stat)
The perfmon_udp_stat database table contains UDP connection statistics for each managed device.
| Field | Type | Null Value Allowed? | Description | Query Type (if applicable) |
|---|---|---|---|---|
| perfmon_device_object_uid | int unsigned | NO | Used to identify the device and object as the foreign key on perfmon_device_object.uid | N/A |
| insert_order | int unsigned | NO | Used to calculate delta values for counter statistics | N/A |
| t | timestamp | NO | Time of data sample | N/A |
| open | int unsigned | YES | Rate of current open UDP connections | counter |
| accept | bigint unsigned | YES | Rte of accepted UDP connections | counter |
| acceptfails | bigint unsigned | YES | Rate of UDP connections that failed because they were not accepted | counter |
| conn | bigint unsigned | YES | Rate of established UDP connections | counter |
| connfail | bigint unsigned | YES | Rate of failed UDP connections | counter |
| expires | bigint unsigned | YES | Rate of expired connections due to idle timeout | counter |
| rdxgram | bigint unsigned | YES | Rate of datagrams received | counter |
| rxbaddgram | bigint unsigned | YES | Rate of malformed datagrams | counter |
| rxunreach | bigint unsigned | YES | Rate of received ICMP messages | counter |
| rxnosum | bigint unsigned | YES | Rate of UDP connections with no checksum | counter |
| txdgram | bigint unsigned | YES | Rate of transmitted datagram packets | counter |
LTM virtual server statistics (perfmon_vip_stat)
The perfmon_vip_stat database table contains statistics about the connection statistics of Local Traffic Manager (LTM) virtual servers configured for each managed device.
| Field | Type | Null Value Allowed? | Description | Query Type (if applicable) |
|---|---|---|---|---|
| perfmon_device_object_uid | int unsigned | NO | Used to identify the device and object as the foreign key on perfmon_device_object.uid | N/A |
| insert_order | int unsigned | NO | Used to calculate delta values for counter statistics | N/A |
| t | timestamp | NO | Time of data sample | N/A |
| client_tot_byte_in | bigint unsigned | YES | Rate of client-side bytes received by the specified virtual server | counter |
| client_tot_bytes_out | bigint unsigned | YES | Rate of client-side bytes sent from the specified virtual server | counter |
| client_pkts_in | bigint unsigned | YES | Rate of client-side packets received by the specified virtual server | counter |
| client_pkts_out | bigint unsigned | YES | Rate of client-side packets sent from the specified virtual server | counter |
| client_maxconns | bigint unsigned | YES | Maximum client-side connections to the specified virtual server | gauge |
| client_tot_conns | bigint unsigned | YES | Rate of client-side connections to the specified virtual server | counter |
| client_cur_conns | bigint unsigned | YES | Current number of client-side connections to the specified virtual server | gauge |


