Updated Date: 07/07/2026
Collecting and Viewing TCP Statistics
You can set up the BIG-IP® system to gather information about TCP flows to better understand what is happening on your networks. The system can collect TCP statistics locally, remotely, or both. You can view these statistics in graphical charts, and use the information for troubleshooting and improving network performance.
The statistic reports for both TCP and FastL4 show details about RTT (round trip time), goodput, connections, and packets. For TCP, you can also view statistics for delay analysis. You can save the reports or email them to others.
Before you can create a TCP profile, you must have provisioned the Application Visibility and Reporting (AVR) module.
A TCP Analytics profile directs the system to store TCP statistics about specific entities for use in diagnosing network problems. The Application Visibility and Reporting (AVR) module includes a default TCP Analytics profile called tcp-analytics. You can edit the values in the default profile, or create a new one, as described here.
-
On the Main tab, click Local Traffic > Profiles > Analytics > TCP Analytics.
Tip: If Analytics is not listed, you need to provision Application Visibility and Reporting (AVR) first.
The TCP Analytics screen opens.
-
Click Create.
The New TCP Analytics Profile screen opens, inheriting values from the system-supplied TCP Analytics profile.
-
For Profile Name, type a name for the profile.
-
From the Parent Profile list, select the profile from which you want to inherit settings.
The default profile is often used as the parent profile.
The new profile inherits the values from the parent profile. If the parent is changed, the inherited values in the new profile also change.
-
To make the fields editable, click Custom in the upper right corner.
Tip: If you don’t need to change any of the values, just use the default profile instead.
-
For the Statistics Logging Type setting, verify that Internal is selected. If it is not, select it.
Selecting Internal causes the system to store statistics locally, and you can view the charts on the system by starting at the Main tab, and clicking Statistics > Analytics.
-
For Statistics Collection, leave the default, Client side, selected.
This option specifies where the system gets the statistics from.
-
In the Associated Virtual Servers area, specify the virtual servers that use this TCP Analytics profile to capture TCP statistics:
-
For the Virtual Servers setting, click Add.
-
From the Select Virtual Server popup screen that displays, select the virtual servers to include, and then click Done.
Note: Only virtual servers previously configured to use TCP protocol or FastL4 (Type Performance Layer 4) display in the list (because the data being collected applies to TCP or FastL4 traffic). Also, you can assign only one TCP Analytics or HTTP Analytics profile to a virtual server; therefore, the list displays only virtual servers that have not been assigned either of these profiles.
The system attaches the profile to the virtual servers you added.
-
-
In the Statistics Gathering Configuration area, for Collected Entities, select the entities for which you want the system to collect information.
Note: The more entities you enable, the greater the impact on system performance.
|
Entity |
Description |
|---|---|
|
Virtual Server |
Saves statistics about the virtual server. Note that this is always selected to start with. |
|
Remote Host IP Address |
Saves the IP addresses with which traffic was exchanged. |
|
Remote Host Subnet |
Saves the addresses of the subnets with which traffic was exchanged. |
|
Next Hop Ethernet Address |
Saves the addresses to which traffic is being routed. |
|
Continent |
Saves the name of the continent with which traffic was exchanged. |
|
Country |
Saves the name of the country with which traffic was exchanged. |
|
Region |
Saves the name of the region with which traffic was exchanged. |
|
City |
Saves the name of the city with which traffic was exchanged. |
|
Postcode |
Saves the name of the postal code with which traffic was exchanged. |
- Click Finished.
The system creates the TCP Analytics profile. If the BIG-IP system is exchanging traffic with clients, TCP statistics are collected for the virtual servers and collected entities specified in this profile.
Note: To view RTT statistics for Layer 4 traffic managed using a FastL4 profile, you also need to enable RTT from Client and RTT from Server (as appropriate) in the FastL4 profile.
If later you decide you want to store TCP analytics remotely, you can use the external Statistics Logging Type and specify a remote publisher to specify where to send the statistics.
Before you can view TCP statistics, you must have created a TCP Analytics profile that is logging statistics internally on the BIG-IP system. The TCP Analytics profile also needs to be associated with one or more virtual servers.
You can view TCP statistics in the Analytics charts.
-
On the Main tab, click Statistics > Analytics > TCP.
The RTT statistics screen opens.
-
For Time Period, you can adjust the time frame for which to display the data.
-
To look at the statistics from a different point of view, for View By, select the category of data to display in the chart.
You can also click an item in the Details list to drill down and display more specific statistics.
The screen displays data in the categories for which you are saving statistics in the TCP Analytics profile.
-
Click any item on the menu bar to see different TCP Analytics charts.
|
Click This |
To View These Statistics |
|---|---|
|
RTT |
Round trip times from the BIG-IP system to the remote host and back. |
|
Goodput |
Throughput at the application level used to review overall network performance. It shows total throughput aggregated for all connections on the configured entities. |
|
Delay State |
The aggregate time spent in each delay state by all connections. This is only available for connections with a TCP profile, not FastL4. |
|
Connections |
New and closed connections. It also shows mean connection length, measured from when Analytics starts collecting data (which may be from a mid-connection iRule) to when it stops. |
|
Packets |
Packets sent, packets received, and packets lost. |
The system displays the different charts, and you can adjust the time period and view by settings on all the charts.
-
To save the charts to a PDF or to email the chart, click Export and specify the option to use.
To use email, the BIG-IP system requires an SMTP server which you can configure at System > Configuration > Device > SMTP.
The TCP statistics are available to use for evaluating network performance. You can save the reports to track the differences in performance over time.
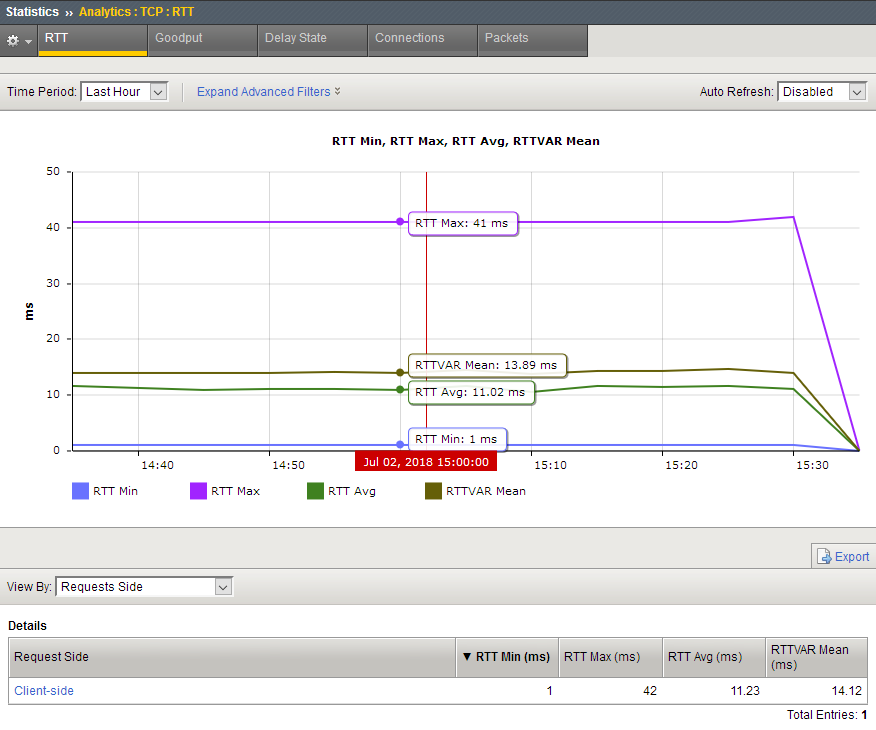
This figure is a sample TCP statistics chart showing round trip times (RTT), or how long it takes for outgoing TCP packets on the client side to be answered by the server. When you hover over the chart, it shows the RTT minimum, RTT maximum, RTT average (mean), and the RTTVAR mean values. You can use these statistics to help gauge application performance.
Note: To view RTT statistics for Layer 4 traffic managed using a FastL4 profile, you need to enable RTT from Client and RTT from Server (as appropriate) in the FastL4 profile.
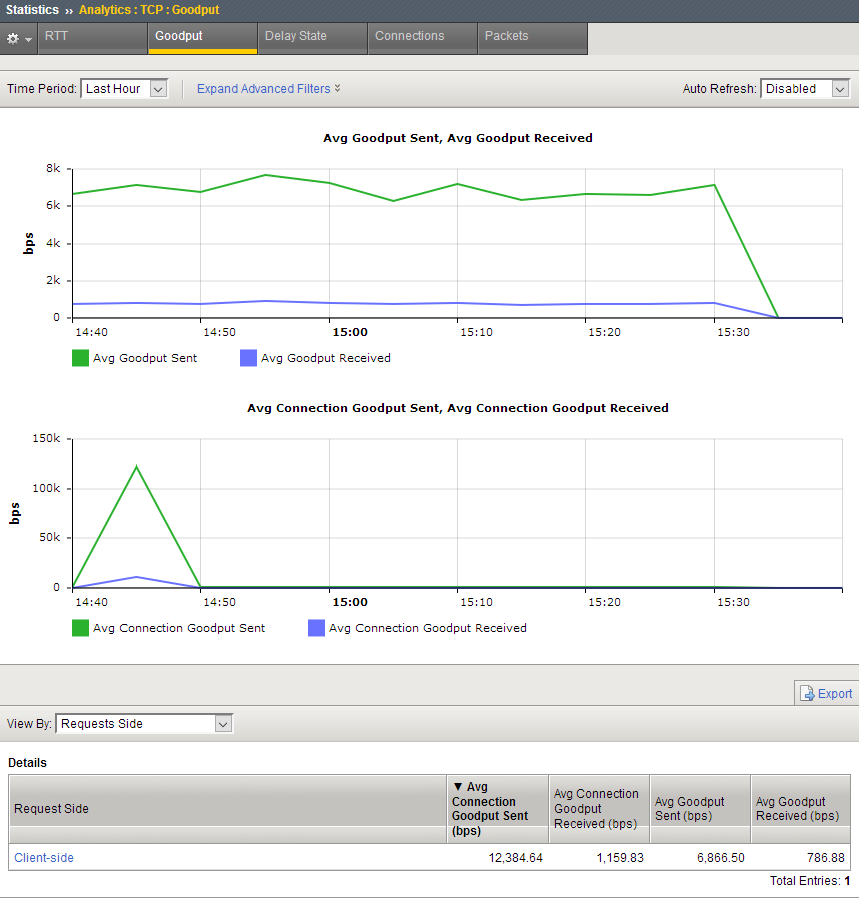
This figure is a sample TCP statistics report showing goodput sent and received values from the client side. Goodput shows throughput at the application level over a period of time. You can use these statistics to understand network performance.
This sample TCP statistics report shows the causes of delay states. Here the primary delay state cause is application latency either on the client, or server side.
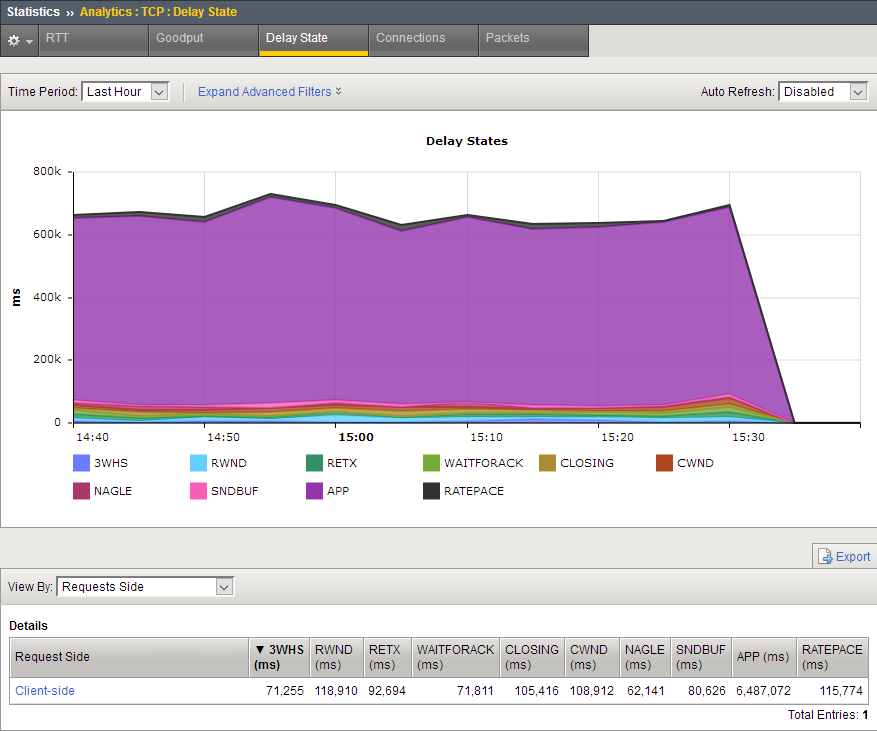
The delay states, described in the following table, are color coded in the chart. You can hover over the part of the chart you are interested in to display the delay states and their values. These states apply to outgoing data. Analytics picks the first listed state that matches the current situation.
| State | Description and What to Do |
|---|---|
| 3WHS | 3-way handshake that starts a TCP connection. Analytics will accrue time in this state only if it can estimate the round-trip-time of the SYN or SYN-ACK that it sent. |
| RETX | Retransmission. TCP is resending data and/or waiting for acknowledgment of those retransmissions. This may indicate lossy links in the data path, or overly aggressive congestion control (for example, a profile with Slow Start disabled or improperly set Packet Loss Ignore settings). Activating rate-pace in the TCP profile may also help. |
| CLOSING | The BIG-IP® system has received acknowledgment of all data, sent the FIN, and is awaiting acknowledgement of the FIN. If the FIN goes out with the last chunk of data, you might not see this state at all. If there is a major issue on the client side, the issue may be that the servers are configured for keepalive (to not send FIN with their last data). |
| WAITFORACK | The BIG-IP system has sent all available data and is awaiting an ACK. If this state is prevalent, it could be a short connection, or possibly either the upper layers or the server are forcing TCP to frequently pause to accept new data. |
| APP | The BIG-IP system has successfully delivered all available data. There is a delay either at the client, the server, or in the layers above TCP on the BIG-IP system. |
| RWND | Receive-window limited. The remote host’s flow-control is forcing the BIG-IP system to idle. |
| SNDBUF | The local send buffer settings limit the data in flight below the observed bandwidth/delay product. Correctable by increasing the Send Buffer size in the TCP profile. |
| CWND | Congestion-window limited. The TCP congestion window is holding available data. This is usually a legitimate response to the bandwidth-delay product and congestion on the packet path. In some cases, it might be a poor response to non-congestion packet loss (fixable using the Packet Loss Ignore profile options) or inaccurate data in the congestion metrics cache (addressable by disabling Congestion Metrics Cache, the ROUTE::clear iRule, or the tmsh command delete net cmetrics dest-addr <addr>). |
| NAGLE | TCP is holding sub-MSS size packets due to Nagle’s algorithm. If the NAGLE state shows up frequently, disable Nagle’s algorithm in the TCP profile. |
| RATEPACE | TCP is delaying transmission of packets due to rate pacing. This has no impact on achievable throughput, and no action is required. |
This sample TCP connection report shows the average connection length in milliseconds, and the number of connections opened and closed during the last hour. If new connections are outpacing closed ones, that means the system may be unsustainably loaded.
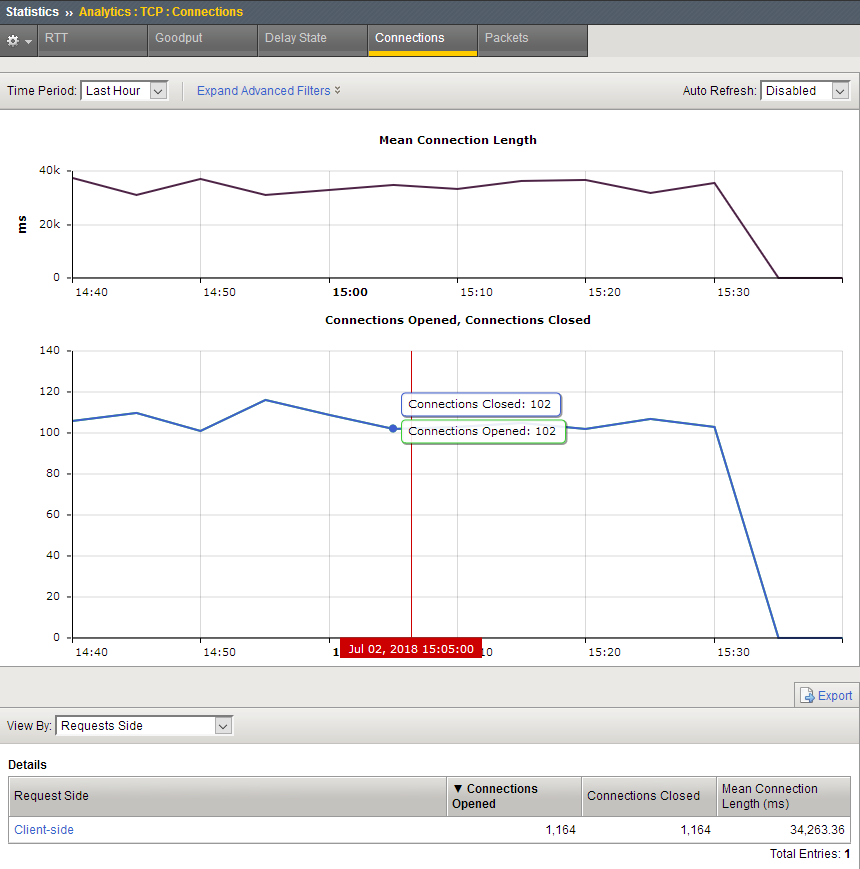
You can change the information that is displayed in the chart and the Details table by changing the View By setting. For example, you can view by Countries + Regions to see where the connections are originating.
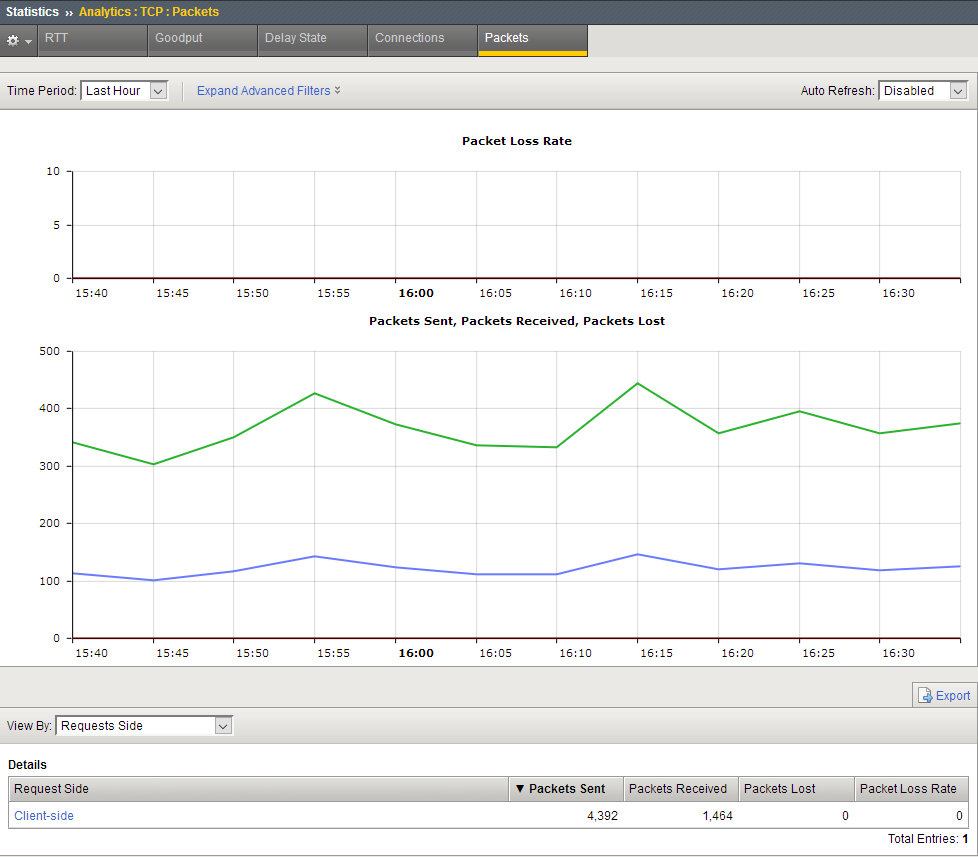
This sample TCP packets report shows the number of packets lost, sent, and received during the last hour. Packet loss is typically caused by network congestion, and can impact application performance. In this example there are is no packet loss.
You can drill down into the statistics. For example, on systems with multiple virtual servers, applications, or subnet addresses, you can investigate specific entities that might be having trouble. If users are having difficulties with an application, from the View By list, select Applications. In the Detail list, click the application to zoom in on the statistics for that application only.
You can create a TCP Analytics profile that uses an iRule to collect the statistics. In the profile, for Statistics Collection, do not select either Client Side or Server Side. Let the iRule handle it.
For example:
    # start collection for one subnet only.
      when CLIENT_ACCEPTED {
          if [IP::addr [IP::client_addr]/8 equals 10.0.0.0] {
            TCP::analytics enable
         }
      }
      when HTTP_REQUEST {
        # must check subnet again to avoid starting for all
        # connections
          if [IP::addr [IP::client_addr]/8 equals 10.0.0.0] {
           # make stats queryable by URI
             TCP::analytics key "[HTTP::uri]"
         }
      }
For more information about iRules®, refer to devcentral.f5.com.