Updated Date: 07/07/2026
Monitoring Application Services
You can monitor your applications for health issues and active alerts to mitigate potential impact on the application services. Evaluating application service data provides insights, based on its service type. If you identify an issue with your services you can edit your application service.
For more information about editing application configuration, see Use BIG-IQ to Manage Applications, or Use BIG-IQ to Manage AS3 templates.
For more information about minimum requirements for statistics visibility, see Configuring Statistics Collection.
Local traffic data provides analytics into the latency of the end-to-end transactions between the client and server. Transaction data is collected based on your configuration of the TCP or HTTP application services. Using transaction data, you can identify:
-
Trends in traffic throughput, including general latency
-
Issues affecting the application’s servers
-
Issues affecting virtual servers
-
Client-reported latency
Device data provides analytics into the resource usage and traffic to your BIG-IP environment. Using this data, you can identify:
- Device resource usage and status (CPU, memory, etc.)
- Traffic throughput over time
Web application security data and alerts provide indications of the application service’s protection and the malicious traffic detected by your protection profiles. Using HTTP traffic data detected by security policies you can identify:
-
General trends in potential security threats
-
False positives generated by a policy that is actively blocking traffic
-
Attacks that reached your application servers when a policy is in monitoring (transparent) protection
Note: Security data is not supported by legacy applications. Security data for legacy applications do not appear in the HTTP application screens.
DNS services report the query responses per second (RPS) and the outcomes of DNS traffic. Using data from traffic within your DNS domain you can identify:
-
Trends in DNS traffic
-
Results of DNS load balancing decisions
Alerts provide the status application services contained in an application can indicate current, or potential, performance issues that require mitigation. The following outline the types of events and alerts provided to your application services
Application health is a reflection of the status of one or more of its application services. Application health is displays the status of application service with the most critical health. Once you select an application, you can view which application service(s) is affected.
Application service health is displayed based on the most critical status detected. There are two factors used to indicate changes in health:
-
The status of the virtual server, pool or pool member connected to the application service. The health status of a virtual server is reflected by its communication with the server pool to your managed application. For more information about these alerts, see Virtual server status events and Wide IP status events.
Note: The health of all application objects are relayed to the host virtual server. For AS3 applications, pool member alerts still appear under virtual server health, but report details of affected pool members.
-
A performance metric threshold is crossed and sustained over time. These are based on the metric conditions configured to your application service’s alert rules.
Performance alerts are triggered by threshold violations, reported by HTTP, TCP and DNS application services. Active alerts reflect an ongoing application service performance issue. You can edit these thresholds, based on your system monitoring requirements.
A critical, or warning, alert that is active, indicates there has been a sustained threshold violation for over five minutes. A subsequent alert is triggered once another threshold is crossed (either an increase or decrease in severity, or cleared). To ensure that conditions are improving, an alert for declining severity (critical to warning) or a cleared alert, is triggered only when the value is sustained for five minutes at ten percent below the threshold value. For example, if a threshold value is configured for greater than 60 percent, a declining severity must be sustained at 54 percent or less to trigger an alert.
Security alerts are provided to applications and virtual servers with Web Application Security protection. These alerts vary based on the protection mode (blocking vs transparent). Security alerts differ from other alerts, as they are based on set thresholds, and they do not directly impact application health.
You can use the application health status settings to identify a specific application service that has surpassed a performance threshold.
-
Open the application summary screen (Applications > APPLICATIONS).
-
Locate the HEALTH area at the top left of the summary bar.
-
Click Critical and Moderate to filter the application list by applications with the selected health statuses.
Note: In the applications list, the Active Alerts field indicates the current number of alerts for an application.
-
Click the application’s name.
The application services are displayed.
-
Identify the application services with moderate or critical health, and click the name to view the summary dashboard for the selected application service.
You can use the ANALYTICS portion of the application service dashboard to evaluate charts that contain traffic data specific to the selected application service.
You can use the application service alerts to identify when a performance issue began, and its current status.
Note: You can view pool and pool member statuses by selecting alerts with Reported Object Type labeled as Virtual Server. This includes AS3 configured applications.
-
Open the application properties screen by selecting the application’s name from the Applications screen ( click Applications > APPLICATIONS > <Application Name> > <Application Service>).
-
To view the application service’s most severe, active alerts, view the Active Alerts area at the far right of the summary bar.
-
Click See All to view the application’s Active Alert screen.
This displays a log of all alerts that have crossed a defined threshold.
-
Click the row for the most recent health alert, and view the alert details on the lower part of the screen.
- The Description field displays the affected performance indicator.
- The Value field displays the value when the alert was triggered
- The Log Level filed indicate the alert’s severity. Note: In addition to the high-level fields, you can also view details about the objects associated with the alert notification in the Dimensions column on the right side of the panel. In this area, you can see details like the host BIG-IP device, or affected pool members.
-
Return to the single application screen by clicking the back arrow next to Active Alerts screen title.
From the application service’s screen, you can use the alert information to analyze and isolate if the issue is related to one or more pool members.
Virtual Server events and indicate the status of the virtual server and its pool. You can see these events and alerts in the charts of the application properties screen ( Applications > APPLICATIONS > <Application Name> > <Application HTTP Service>) and in the Local Traffic dashboards ( Monitoring > DASHBOARDS > Local Traffic). You can also view alerts in the Active Alerts and Alert History screens (Applications > ALERT MANAGEMENT).
|
Alert |
Description |
Default Thresholds |
Impact |
|---|---|---|---|
|
|
The virtual server is offline as a result of status or configuration changes. The system then updates the virtual server status with one of the following messages:
Note: The virtual server monitor is configured on the BIG-IP system.
|
Critical: Offline |
Prolonged issues that impact application pool member performance require either virtual server mitigation, or pool member configuration mitigation. |
|
|
The pool response to the virtual server. Pool status is based on the pool member response. |
Critical: All pool members in a pool are unresponsive Moderate: At least one, but not all, members in a pool are unresponsive Cleared: All pool members are back online, or the virtual server was deleted. |
Wide IP events and indicate the status of your DNS pools of virtual servers, and the overall health of your DNS application services. You can see these events and alerts in the charts of the application properties screen ( Applications > APPLICATIONS > <Application Name> > <DNS Application Service>) and in the DNS dashboards ( Monitoring > DASHBOARDS > DNS > GSLB). You can also view alerts in the Active Alerts and Alert History screens (Applications > ALERT MANAGEMENT).
|
Alert |
Description |
Default Thresholds |
Impact |
|---|---|---|---|
|
|
The Wide IP is either offline, or all pool members (or virtual servers) assigned to the wide IP’s pool are disabled. |
Critical: All pool members in a pool are unresponsive Cleared: At least one pool member is back online, or the wide IP was deleted. |
Prolonged issues may impact that impact DNS load balancing, and requires evaluation of the wide IP’s configuration. |
HTTP application service alerts notify regarding changes in metrics that can affect the overall performance of traffic or security management for your managed application. When one or more of these thresholds are crossed, the health of your HTTP application service will change. You can view alerts from the single application service’s screen (Applications > APPLICATIONS > <Application Name> > <HTTP application service>), or the alerts screens (Applications > ALERT MANAGEMENT > Active Alerts or Alert History).
The following chart outlines the metric conditions for monitoring HTTP application services.
*Indicates that this data was collected from TCP traffic information, and indicates network latency and transmission times. Mitigation may require changes to your TCP profile.
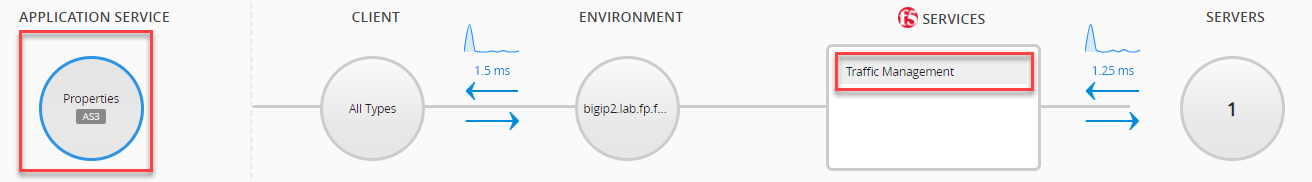
**The Additional Data column refers to the ANALYTICS portion of the single application service’s screen. The charts sited are located when either APPLICATION SERVICE or Traffic Management services are selected, unless stated otherwise (see image for reference).
|
Alert |
Description |
Impact |
Default Thresholds |
Additional Data** |
|---|---|---|---|---|
|
|
The average time from when the server receives the request from the BIG-IP system until the server sends the response. This metric is a reflection of the server’s activities, as it deducts network latency and transmission time. |
Increased server response latency can negatively impact the user’s experience in accessing the application’s contents. |
No default |
Select the Application Response Time chart from the menu to the bottom left. Use the dimensions to the right of the chart to identify if the issue is found on specific virtual servers or pool members. |
|
|
The average round trip time (RTT) for network communication between the BIG-IP system and the application server. |
Increased latency over time can indicate a variety of issues including: server defects, bandwidth outage, or BIG-IP device issues. |
Critical > 50msWarning > 20ms Cleared < 20ms |
Select the Server Side RTT or Client Side RTT chart from the menu to the bottom left. Use the dimensions to the right of the chart to identify if the issue is found on specific BIG-IP devices or virtual servers. |
|
|
The average round trip time (RTT) for network communication between the BIG-IP system and the client application request. |
No default | ||
|
|
The percent of transactions, out of all transactions, that did not complete the request and response exchange. |
A higher percentage of unresolved transactions can indicate a number of issues that negatively impact a user’s connection. Increased incomplete transactions can result from a query timeout, or an unknown cancellation. |
Critical > 5%Warning > 1% Cleared < 1% |
Select the Transactions chart from the menu to the bottom left. Use the dimensions to the right of the chart to identify if the issue is found on specific BIG-IP devices or virtual servers. |
|
|
The average rate of transactions that returned a request error response code (4XX) out of all the overall transactions. |
Increased 4XX errors indicate issues with client-side access, with broken links as the most common error. |
No default |
Select the Response Codes chart from the menu to the bottom left. Use the dimensions to the right chart to filter specific response codes and URLs. |
|
|
The average rate of transactions that returned a server error response code (5XX) out of all the overall transactions. |
Increased 5XX errors indicate issues with the application server. |
Critical > 0.05%Warning > 0.01% Cleared < 0.01% |
Select the Response Codes chart from the menu to the bottom left. Use the dimensions to the right chart to filter specific response codes and pool members. |
|
|
The number of server transactions per second (TPS) is higher than the expected average. |
The rate of application activity is higher than expected and may limit the application server’s resources. This may also indicate an attack. |
No default |
Select SERVER services to view top pool member charts. Select the TPS chart and use the dimensions to the right of the chart to filter specific virtual servers and pool members. |
|
|
The number of server transactions per second (TPS) is lower than the expected average. |
The rate of application activity is lower than expected. This may indicate that your application servers resources are limited. |
No default | |
|
|
The average volume (in Mbps) of traffic sent from BIG-IP to the client. |
Sudden increases in traffic volume can lead to a variety of issues that can affect the application’s performance. When throughput exceeds a certain value you can inspect for: server defects, bandwidth outage, DoS attack signatures or BIG-IP device resource limitations. |
No default |
Select CLIENT services to view client side transaction charts. Select the Client Side Throughput and use the dimensions to the right of the chart to filter specific BIG-IP devices or virtual servers. |
|
|
The average volume (in Mbps) of traffic sent from the client to BIG-IP. |
No default | ||
|
|
The average volume (in Mbps) of traffic sent from BIG-IP to the server. |
No default |
Select SERVER services to view top pool member charts. Select the Server Side Throughput and use the dimensions to the right of the chart to filter specific virtual servers and pool members. | |
|
|
The average volume (in Mbps) of traffic sent from the server to BIG-IP. |
No default | ||
|
|
The volume (in Mbps) of useful, uncorrupted packets received by the client from BIG-IP is lower than expected. |
Lowered goodput indicates suboptimal flow control and congestion avoidance over the transport layer. A lower ratio of goodput to maximum throughput can indicate a number of issues with the network including, an increase in TCP slow start or congestion control, packet loss and network interference. |
No default |
Select CLIENT services to view client side transaction charts. Select the Client Side Goodput chart, and use the dimensions to the right of the chart to filter specific virtual servers and BIG-IP devices. |
|
|
The volume (in Mbps) of useful, uncorrupted packets sent from the client to BIG-IP is lower than expected. |
No default | ||
|
|
The volume (in Mbps) of useful, uncorrupted packets received by the server from BIG-IP is lower than expected. |
No default |
Select SERVER services to view top pool member charts. Select the Server Side Goodput chart, and use the dimensions to the right of the chart to filter specific virtual servers and pool members. | |
|
|
The volume (in Mbps) of useful, uncorrupted packets sent from the server to BIG-IP is lower than expected. |
No default |
TCP application service alerts notify you when there are changes in metrics that can affect the overall performance of traffic over the network. There are no default alert thresholds for TCP application services, so you must configure your threshold values to receive alerts. If configured, you can view alerts from the application service’s screen (Applications > APPLICATIONS > <Application Name> > <TCP application service>), or the general alerts screens (Applications > ALERT MANAGEMENT > Active Alerts or Alert History).
**The Additional Data column refers to the ANALYTICS portion of the single application service’s screen. The charts sited are located when either APPLICATION SERVICE or Traffic Management services are selected, unless stated otherwise (see image for reference).
|
Alert |
Description |
Impact |
Additional Data** |
|---|---|---|---|
|
|
The communication time (in ms) from a SYN to an ACK message between the server and BIG-IP. |
Increased latency over time can indicate a variety of issues including: server defects, bandwidth outage, or BIG-IP device issues. |
Select the Server Side RTT or Client Side RTT in your application service’s ANALYTICS area. Use the dimensions to the right of the chart to identify if the issue is found on specific BIG-IP devices or virtual servers. |
|
|
The communication time (in ms) from a SYN to an ACK message between the client and BIG-IP. | ||
|
|
The average volume (in Mbps) of traffic sent from BIG-IP to the client. |
High throughput can be due to increased application usage, or a DoS attack on the application server. Based on your network resources, higher throughput can lead to increased throughput latency. |
Select the Throughput Bytes (average/sec) chart to view when the throughput increase occurred, and if the increase affected a specific part of the transaction. Use the dimensions to the right of the chart to identify if the issue is found on specific BIG-IP devices or virtual servers. |
|
|
The average volume (in Mbps) of traffic sent from the client to BIG-IP. | ||
|
|
The average volume (in Mbps) of traffic sent from BIG-IP to the server. | ||
|
|
The average volume (in Mbps) of traffic sent from the server to BIG-IP. | ||
|
|
The volume (in Mbps) of useful, uncorrupted packets received by the client from BIG-IP is lower than expected. |
A lower ratio of goodput to maximum throughput can indicate a number of issues with the network including, an increase in incomplete transactions, packet loss and network interference. |
Select CLIENT services to view client side transaction charts. Select the Client Side Goodput chart, and use the dimensions to the right of the chart to filter specific virtual servers and BIG-IP devices. |
|
|
The volume (in Mbps) of useful, uncorrupted packets sent from the client to BIG-IP is lower than expected. | ||
|
|
The volume (in Mbps) of useful, uncorrupted packets received by the server from BIG-IP is lower than expected. |
Select SERVER services to view top pool member charts. Select the Server Side Goodput chart, and use the dimensions to the right of the chart to filter specific virtual servers and pool members. | |
|
|
The volume (in Mbps) of useful, uncorrupted packets sent from the server to BIG-IP is lower than expected. |
Security alerts in the TRENDS AND IMPACTS area of the L7 Security dashboard (Monitoring > DASHBOARDS > L7 Security) notify you of the number of objects reporting Web Application Security policy (Web Exploits) or DoS profile (L7 DDoS Attacks) events over the past day (trend charts report the past week). These alerts indicate that a protected object (application or virtual server) recently experienced an increased rate in performance issues. To view data the corresponds with these traffic events go to Monitoring > DASHBOARDS > DDoS > HTTP Analysis To view the status of your deployed applications, go to Applications > APPLICATIONS.
Note: Security alerts are not available to legacy applications.
|
Alert |
Description |
Impact |
Default Thresholds |
Action (if applicable) |
|---|---|---|---|---|
|
BAD TRAFFIC TRENDS |
The number of objects with a significant increase in traffic with any violation rating. |
Increase in transactions with any violation rating. |
Web Exploits: The average number of transactions with a violation rating exceeded 10% in the past 24 hours and increased by a ratio of 0.1% out of all traffic over the past week. L7 DDoS Attacks: The average volume of active, simultaneous attacks increased in the past 24 hours. |
Investigate transactions and fine tune your security policy/profile for new threats. |
|
POTENTIALLY HARMFUL ATTACKS |
The number of objects with a transparent protection mode (Monitoring), that have an increase in bad traffic. |
Increase in transactions with high violation rating. |
Web Exploits: The rate of transactions with violation rating of 4 or 5 exceeded 0.1% in the past 24 hours. L7 DDoS Attacks: The volume of simultaneous active attacks increased in the past 24 hours. |
Change security policy or profile to Blocking mode. |
|
FALSE POSITIVE ATTACKS |
The number of objects with a blocking protection mode that have an increase in blocked traffic with a low violation rating. |
Increase in blocked transactions. |
Web Exploits: The rate of blocked transactions with a violation rating of 1 or 2 exceeded 0.01% over the past 24 hours. |
Investigate blocked transactions and fine-tune your Web Application Security policy to allow valid transactions. |
|
BLOCKED ATTACKS |
The number of objects with a blocking protection mode that blocked any bad traffic over the past 24 hours. |
N/A |
N/A |
N/A |
DNS application service alerts notify you when there are changes in metrics that can affect the overall performance of traffic over the network. When one or more of these thresholds are crossed, the health of your DNS application service will change. You can view alerts from the application service screen (Applications > APPLICATIONS > <Application Name> > <DNS application service>), or the general alerts screens (Applications > ALERT MANAGEMENT > Active Alerts or Alert History).
|
Alert |
Description |
Indication |
Default Thresholds |
Additional Data |
|---|---|---|---|---|
|
|
The ratio of dropped requests, out of the total number of requests. |
The request packet to a server pool member (virtual server) is dropped. This may be a configured, alternate load balancing method, or the pool member is unavailable. |
Critical > 50%Warning > 35% Cleared < 35% |
Select the DNS RPS in your application service’s ANALYTICS area, to view the dropped requests over time. Use the dimensions to the right of the chart to identify if the issue is found on specific BIG-IP devices or DNS sync groups. |
|
|
The ratio of alternate load balancing decisions applied to requests, out of the total number of requests. |
Requests packets are sent to an alternate IP address (for the requested host) due to a client side timeout. |
Critical > 65%Warning > 90% Cleared < 65% |
Select the DNS Load Balancing Decisions in your application service’s ANALYTICS area, to view trends in load balancing methods over time. Use the dimensions to the right of the chart to identify if the issue is found on specific BIG-IP devices or DNS sync groups. |
|
|
The ratio of fallback load balancing decisions applied to requests, out of the total number of requests. |
One or more servers is experiencing an outage, and request packets are directed to a failover server. |
Critical > 50%Warning > 25% Cleared < 35% |
The health of your application service is determined by the status of your virtual servers and/or metric thresholds that monitor your application service’s traffic processing capabilities. Metric thresholds are assigned to your application service based on the alert rules configured to your application template. There are a default set of alert rules per application service. You can modify these default rules or add a new alert rule set for a single application service.
Tip: You can view and edit a single application service’s health rules by clicking the health icon located at the far left of the single application service’s summary bar.
When you configure an application service to the BIG-IQ, the application and its services are monitored by a default health alert rule set. You can create a new health alert rule set to customize the alert notifications for a specific application service.
-
Go to the Alert Management screen Applications > ALERT MANAGEMENT > Alert Rules.
-
At the top left of the screen, click the Add button.
The New Alert Rule screen opens.
-
Type aName and an optional Description.
-
Select the Rule Type (Device Health or Device Access-health).
-
In the Metric Conditions area, enable and disable metrics as needed by selecting or clearing the box to the right of the Metric column.
Note: BIG-IP devices earlier than version 13.1.0.5 do not collect data that supports metric alerts. Applications that are managed by earlier versions of a BIG-IP device do not receive metric alerts.
-
Use the Actions area to enable alert notifications by SNMP and Email.
-
Use the Devices area at the bottom of the screen to view the available devices for the new alert rule set, and move a device from the Available list to the Selected list.
You can filter the device lists by selecting from the Filter list.
-
Click Save at the bottom of the screen, or click Save & Close to save and return to the Alert Rules screen.
The health and metric rules trigger new alerts according to the saved modifications. This clears active alerts for the associated application, which triggers the Alert Rule Changes alert.
You can monitor your applications service’s status based on the status of its connected objects and traffic performance metrics. The rules for triggering an alert from your application service can be adjusted based on your monitoring needs. For more information about the performance metrics per application service, see
-
Go to the Alert Management screen Applications > ALERT MANAGEMENT > Alert Rules.
-
Click the alert rule name.
This opens the alert rule’s properties screen.
-
View the Metric Conditions area at the center of the screen, which displays the current metrics and thresholds for the default application alerts rule.
By default, all the metrics are enabled.
Note: BIG-IP devices earlier than version 13.1.0.5 do not collect data that supports metric alerts. Applications that are managed by earlier versions of a BIG-IP device do not receive metric alerts.
-
To disable, or enable metrics, click the check box to the right of the metric column.
-
To adjust the Warning and Critical threshold values for enabled metrics, specify a different value for the metric in the appropriate fields.
-
In the Events area, you can enable or disable status alerts for application objects.
-
Use the Actions area to enable alert notifications by SNMP and Email.
-
Click Save at the bottom of the screen, or click Save & Close to save and return to the Alert Rules screen.
The metric rules trigger new alerts according to the saved modifications. This clears active alerts associated with this rule set, and triggers an Alert Rule Changes alert.
HTTP network traffic provides insights into the health, status and request-types to your applications. When monitoring HTTP traffic over time you can evaluate local, such as latency and end-to-end times, and Web Application Security data, such as volume of illegal transactions. In addition, you can use this data to profile the users who request to access your application.
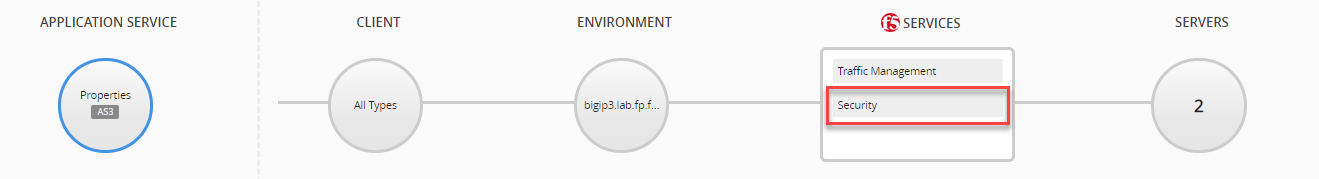
If you have Web Application security provisioned to the BIG-IP device managing your application, select Security from the F5 Services list in the center of the screen. The remaining information in the charts and dimensions, pertains to traffic management services.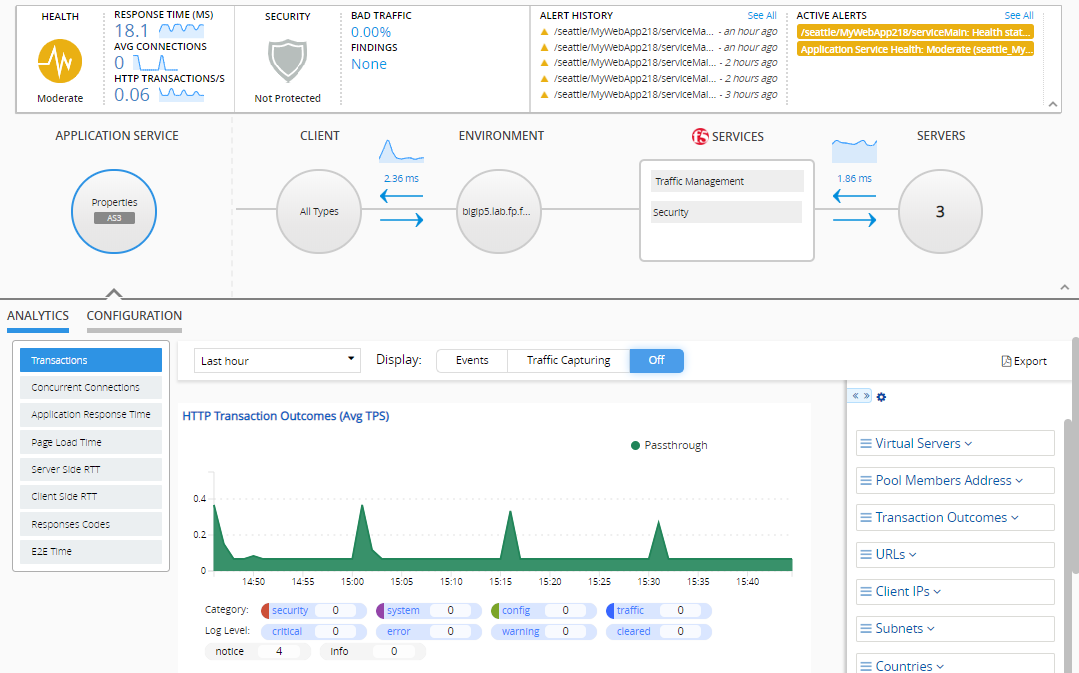
Tip: To evaluate data for all your HTTP applications, go to Monitoring > DASHBOARDS > Local Traffic > HTTP. For Web Application Security, go to Monitoring > DASHBOARDS > Web Application Security.
An HTTP application service’s performance issues might be caused by changes in a pool member’s status. Issues with a pool member can lead to increases in application response time, server-side round trip time (RTT), incomplete transactions, and server errors. An application that sustains these increases can result in a critical or moderate health status. You can use application alerts to isolate managed objects, such as pool members, or virtual servers that reported issues. You can use your findings to adjust your application’s managed objects (LTM pool members) in order to improve performance.
You identify an application with changes in pool member status by using the application health status screen (Applications > APPLICATONS). Once an application and application service (either HTTP or TCP) is identified, you can further evaluate which pool member(s) is affecting performance.
You can isolate pool members that are causing performance issues to mitigate the performance impact by evaluating your HTTP application services.
Tip: You can apply this procedure to identify server status for TCP traffic as well. However, you will have fewer options to view pool data, or change configuration directly from the application service dashboard.
-
Open the application properties screen by selecting the application’s name from the Applications screen ( click Applications > APPLICATIONS > <Application Name> > <Application Service>).
-
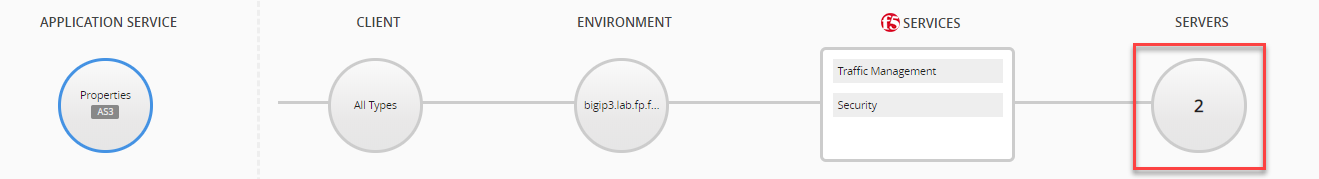
Near the middle of the screen in the SERVERS area, click the numbered icon below to display pool member information in the ANALYTICS area.
-
To view pool member traffic data, select from menu to the left of the screen in the ANALYTICS area (Server Latency, Application Response Time, or Server Side RTT).
-
In the time settings above the chart, ensure that the Events button is set to ON.
-
You can click the Category buttons below the chart such that only the System button is active.
Note: The buttons below the chart have a gray background when disabled, and a blue background, when enabled.
This action filters out all other alert and event categories displayed in the charts.
-
Click an event icon in the chart to display the events and alerts that correspond with the traffic data.
This displays the event table below the chart, which includes details about the events and alerts that occurred at that time.
Tip: You can further filter so that only pool member and virtual server events appear, use the Search events field, and type “server-readiness”.
-
Isolate the affected pool member address from the Title column in the event table, or click the event row to view event details in the Description area.
-
You can analyze additional data for the isolated pool member by expanding the Dimension pane to the right of the chart and selecting the pool member address from the Pool Members Address list.
To manage LTM objects to mitigate a performance issue that you isolated using analytics, you use essentially the same screens that you used to find the problem. But instead of using the ANALYTICS option in the details area, you use the CONFIGURATION option.
Resolving this issue requires the following:
- Create a replacement for the object triggering the issue.
- Delete or remove the object from service.
In these tasks, we provide an example of a problem pool member. But you can use the same strategy for other Traffic Management object types in your application.
When you isolate a pool member that is affecting traffic performance, you can create a replacement for the member that is triggering the performance issues.
-
Select the application that needs attention from the all applications screen (Applications > APPLICATIONS > Application Name).
-
Find the pool member that needs attention: At the right, center of the screen, click the number in the Servers circle.
This displays the pool member information in the CONFIGURATION area.
-
Create a new pool member.
-
At the left click CONFIGURATION.
-
Under Servers, click Create (a Create Servers popup screen opens).
-
Type the IP Address and Port for the new pool member.
-
Click Create. (This creates the pool member and closes the popup screen.)
-
The next thing you probably want to do is take this pool member out of service so that your application traffic can return to normal.
Before you start, you probably want to create a replacement pool member to handle the traffic of the problem member.
When you isolate a pool member that is affecting traffic performance, you have a couple of ways to remedy the issue. Depending on what kind of issues the pool member is experiencing, you might want to delete it immediately, disable it, or force it offline.
-
Select the application that needs attention from the all applications screen (Applications > APPLICATIONS > Application Name).
-
Find the pool member that needs attention: At the right, center of the screen, click the number in the Servers circle.
This displays the pool member information in the CONFIGURATION area.
-
Select the pool member that needs attention:
-
Click CONFIGURATION.
-
Select the check box for the pool member.
-
-
Determine what you want to do with this pool member based on the nature of the performance issue, and take the most appropriate action.
|
What do you want the member to do? |
Select this option |
|---|---|
|
Cease all traffic immediately |
Select Delete.BIG-IQ removes the pool member from the pool, but does not delete the associated node. This option is most appropriate when an issue requires a quick response. Current connections will be interrupted. |
|
Stop processing new connections but continue to process persistent or active connections. |
Select Disable.BIG-IQ continues to process persistent and active connections for this member. New connections are accepted only if they belong to an existing persistence session. This option is appropriate when you can afford the time for traffic to dissipate before the member stops processing traffic. |
|
Stop processing new connections but continue to process active connections. |
Select Force Offline.BIG-IQ continues to process active connections for this member. New connections are accepted only if they belong to an existing persistence session. This option is appropriate when you can afford the time for traffic to dissipate before the member stops processing traffic. |
The next thing you probably want to do is repeat the troubleshooting steps you used to isolate this pool member as the problem source and confirm that the issue is resolved.
This table lists and defines the charts found under the ANALYTICS tab in the application service dashboard (Applications > APPLICATIONS > <Application Name> > <Application HTTP Service>). Select the option marked in the image to view charts at the bottom of the screen. These charts display the trends of the application pool members. Each chart displays an aspect of pool member performance, as function of the selected time period.
|
ANALYTICS Menu Options |
Chart Title |
Description |
|---|---|---|
|
Server Latency |
Top 5 Pool Members by Server Latency |
The average number of milliseconds (ms) it took for the BIG-IP system to receive a response message from a pool member once a request was sent. This includes application response time and server RTT.Metric Unit: ms Legend: Top 5 pool member IP addresses |
|
Application Response Time |
Top 5 Pool Members by Application Response Time |
The average time it takes for the pool member to send a response message once the pool member receives the request from the BIG-IP system. Metric Unit: ms Legend: Top 5 pool member IP addresses |
|
Server Side RTT |
Top 5 Pool Members by Server Side Round-Trip Time |
The time it takes for the BIG-IP system to send a request and receive a response from the pool member, not including the application response time. This is a system performance indicator.Metric Unit: ms Legend: Pool member addresses |
|
TPS |
Top 5 Pool Members by TPS |
The average number of request transactions per second (TPS) received by a pool member. Metric Unit: TPS Legend: Pool member addresses |
This table lists and defines the charts found under the ANALYTICS tab in the application service dashboard (Applications > APPLICATIONS > <Application Name> > <Application HTTP Service>). Select the option marked in the image to view charts at the bottom of the screen. These charts display the trends of application traffic processed by the BIG-IP system. Each chart displays an aspect of application traffic as a function of the selected time period.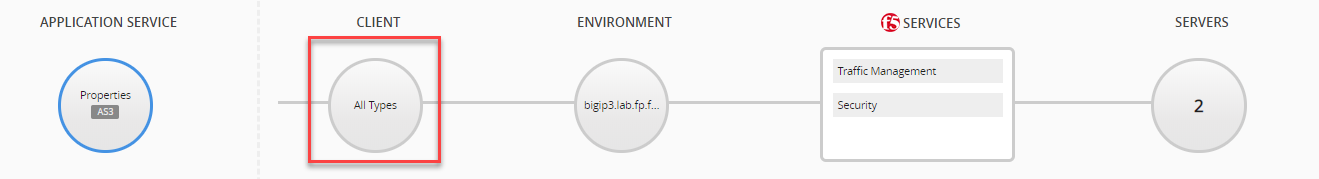
|
ANALYTICS Menu Options |
Chart Title |
Description |
|---|---|---|
|
Transactions |
HTTP Transaction Outcomes |
The average outcome assigned by the BIG-IP system to the request and response between the client, BIG-IP system and server.Metric Unit: Average Transactions per Second Legend: Passthrough: HTTP transactions that completed the request and response exchange using the BIG-IP system. Incomplete: HTTP transactions that did not complete the entire request and response exchange. Cached by BIG-IP: Requests stored by the BIG-IP system to reduce the traffic load on back-end servers. BIG-IP Response: HTTP requests that received a response directly from the BIG-IP. |
|
Page Load Time |
Page Load Time |
The average time it takes for a client request to receive a full response from the server and BIG-IP system.Metric Unit: ms Legend: Avg: The average page load time observed. Max: The highest page load time observed. |
|
Client Side RTT |
Client Side Round-Trip Time |
The time it takes for a client to send a request and receive a response over the BIG-IP system. This includes the time it takes for client’s request to reach the BIG-IP system and the time it takes for the client to receive a response from the BIG-IP system. Metric Unit: ms Legend: Min:The lowest server RTT observed. Avg: The average server RTT observed. Max: The highest server RTT observed. |
|
E2E Time |
End-to-End-Time |
The time required for an application request and response transaction, not including system latency and transmission times.Metric Unit: ms Legend: Client RTT: The average time it takes for a client to send a request and receive a response over the BIG-IP system. Server RTT: The average time it takes for a client to send a request and receive a response over the BIG-IP system. Application Response Time: The average time it takes for a server to send a response, after receiving a request. |
The dimensions and metrics listed are gathered to monitor traffic data pertaining to the HTTP layer. The information provided is found in the dimensions pane tables with the screens that display HTTP data. It is important note that all metric data is displayed as a unit over the time period selected for the screen.
The following defines the dimensions found in the dimensions pane that report HTTP traffic analytics.
- BIG-IP Host Names
- The name of each BIG-IP system that processed the monitored transactions.
- Applications
- The name of each application reporting HTTP traffic data.
- Application Services
- The name of each HTTP application service reporting transaction data.
- Virtual Servers
- The name of each virtual server that processes monitored transactions.
- Pool Member Addresses
- The IP addresses of the servers assigned to a pool configured to a managed BIG-IP.
- Transaction Outcomes
- The outcome assigned to each HTTP request as they are processed by the BIG-IP system.
- URLs
- The URL that initiated the HTTP request that was processed by the BIG-IP system.
- Client IPs
- The client IP address that initiated the HTTP request that was processed by the BIG-IP system.
- Subnets
- The subnet of the client IP address that initiated the HTTP request that was processed by the BIG-IP system.
- Countries
- The country listed in the HTTP request that was processed by the BIG-IP system.
- Response Codes
- The result code listed HTTP response received by the BIG-IP system.
- Response Code Families
- The class of the HTTP response result received by the BIG-IP system.
- Methods
- The HTTP method included in the HTTP request received by the BIG-IP system.
- Browsers
- The type of browser included in the HTTP request that was received by the BIG-IP system.
- OSs
- The operating system included in the HTTP request received by the BIG-IP system.
- User Agents
- The browser and operating system information included in the HTTP request received by the BIG-IP system.
HTTP metrics reflect the quantity, volume and speed of the HTTP traffic processed by your managed BIG-IP systems. Metric sets categorize the metric data according to an aspect of the traffic’s progress throughout the transaction process. The table below defines the metric set and the kind of metric data collected.
|
Metric Set |
Metric Set Definition |
Metric |
Metric Definition |
|---|---|---|---|
|
Transactions |
Each initiated request between the client and BIG-IP system, regardless of the outcome. |
Avg/s |
Average number of transactions per second that were processed by the BIG-IP system. |
|
Total |
Total number of transactions processed by the BIG-IP system. | ||
|
Request Volume |
The volume (in bytes) of a request that is processed by the BIG-IP system. |
Avg Size |
The average number of bytes sent per transaction request. |
|
Throughput |
The average rate of bytes per second sent in transaction requests. | ||
|
Volume |
The total number of bytes sent in all transaction requests. | ||
|
Response Volume |
The volume (in bytes) of a response that is processed by the BIG-IP system. |
Avg Size |
The average number of bytes sent per transaction response. |
|
Throughput |
The average rate of bytes per second sent in transaction responses. | ||
|
Volume |
The total number of bytes sent in all transaction responses. | ||
|
Server Latency |
Server latency is the time (in ms) from when the BIG-IP system sends the first request byte to the web application server, until the BIG-IP system receives the first response byte. |
Avg |
The average server latency observed by the system. |
|
Trans Count |
Total number of transactions processed by the BIG-IP system. | ||
|
Max |
The highest server latency observed by the system. | ||
|
Page Load Time |
Page load time is the time (in ms) from when the client sends the first byte of a request until the last byte of the response is received by the client. Page load time is how long (in milliseconds) it takes from the time an end user makes a request for a web page, until the web page from the application server finishes loading on the client-side browser. |
Trans Count |
The number of client responses from the system that include page load time information. |
|
Max |
The longest page load time observed by the system. | ||
|
Avg |
The average page load time observed by the system. | ||
|
Application Response Time |
The time (in ms) from when the server receives the first request byte from the BIG-IP system until the server sends the first byte of the response. |
Avg |
The average application response time observed by the system. |
|
Min |
The shortest application response time observed by the system. | ||
|
StdDev |
The the standard deviation (in ms) of all application response times observed by the system. | ||
|
Trans Count |
The number of application response times observed by the system. | ||
|
Max |
The longest application response time observed by the system. | ||
|
E2E time |
The time (in ms) from when the client sends the first packet of a request until the client receives the last packet of the response. |
Max |
The longest client end to end time observed by the system. |
|
Min |
The shortest client client end to end time observed by the system. | ||
|
StdDev |
The standard deviation (in ms) for all observed client end to end time. | ||
|
Trans Count |
The number of client responses that include client end to end time information. | ||
|
Avg |
The average client end to end time for all observed transactions. | ||
|
Client Side RTT |
Client side round trip time (RTT) is the sum of time (in ms) observed from when the first byte from a client request is received by the BIG-IP system and when the first byte of a response is sent from the BIG-IP system to the client. Or, Client TTFB not including request duration. |
StdDev |
The standard deviation (in ms) for all observed client side RTTs. |
|
Min |
The shortest client side RTT for all observed transactions. | ||
|
Max |
The longest client side RTT for all observed transactions. | ||
|
Avg |
The average client side RTT for all observed transactions. | ||
|
Server Side RTT |
Server side round trip time (RTT) is the sum of the times (in ms) observed from when the server receives the first request byte from the BIG-IP system and from when the BIG-IP receives the first byte of the response from the server. Or the time observed from when the BIG-IP system sends the first request byte, until it receives the first response byte, not including application response time. |
Trans Count |
The number of server responses to the system that include RTT information. |
|
StdDev |
The standard deviation (in ms) for all observed server side RTTs. | ||
|
Avg |
The average server side RTT for all observed transactions. | ||
|
Max |
The longest server side RTT observed by the system. | ||
|
Min |
The shortest server side RTT observed by the system. | ||
|
Request Duration |
The time it takes (in ms) the BIG-IP system to send the first byte until the last byte of a request to the server. |
Max |
The longest request duration observed by the system |
|
Trans Count |
The number of requests observed by the system. | ||
|
StdDev |
The standard deviation (in ms) of request duration for all observed requests. | ||
|
Avg |
The average request duration for all observed requests. | ||
|
Min |
The shortest request duration observed by the system. | ||
|
Responses Duration |
The time it takes (in ms) the BIG-IP system to send the first byte until the last byte of a response to the client. |
Trans Count |
The number of responses observed by the system. |
|
Avg |
The average response duration for all observed responses. | ||
|
Max |
The longest response duration observed by the system. | ||
|
Min |
The shortest response duration observed by the system. | ||
|
StdDev |
The standard deviation (in ms) of response duration for all observed responses. |
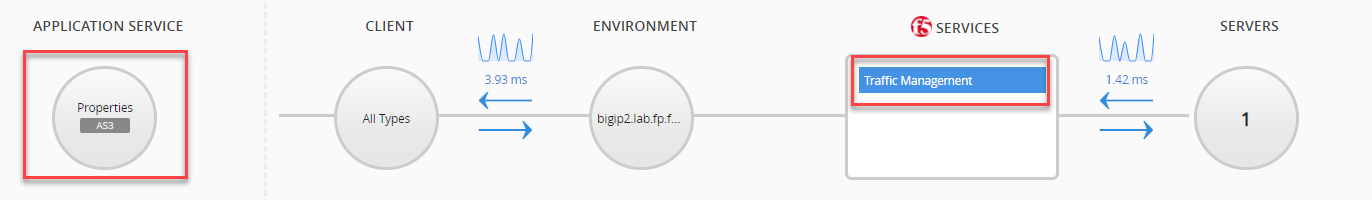
The charts that reflect Web Application Security data allow you to analyze current trends in traffic to applications with Web Application Security. The parameters found in the charts described display the detected layer 7 security threats, out of all HTTP traffic. The configuration of application service the in view is indicated in the Properties icon, as indicated in the image of an AS3 application service.
- Illegal Transactions Rate (TPS)
- The average number of illegal transactions per second that were identified by the Web Application Security profile. These transactions were detected based on the violation rating and your Web Application Security policy’s action settings. Increases in illegal traffic over time can indicate an increase in attacks to your applications, or it can indicate an overly-strict protection policy. The current protection mode is indicated by Blocked or transparent transactions. You can use the Violation Rating dimension to filter violations above a certain threat level. This will allow you to identify specific violations types that were detected.
Tip: A single illegal transaction can include multiple violations. Therefore, comparing the number of illegal transactions vs the number of violations may not accurately reflect your system’s status. It is recommended to primarily evaluate the number of illegal transactions.
- Transactions Rate by Violation Rating (TPS)
- The average number of transactions per second by the detected threat level assigned by your Web Application Security policy. The threat level of the traffic is shown in ascending order; from Legal to Malicious.
- Top 6 Violations (Violations/s)
- The six types of violations most commonly detected (per second). Violation information can be useful in adjusting your Web Application Security policy for optimized protection against the most common attacks.
The metrics and dimensions listed are provide data regarding the transaction volume and traffic violations detected by your Web Application Security policy. The information provided is found in the dimensions pane tables with the screens that display Web Application Security data. You use this information to filter the on-screen data by specific dimension objects. For example, if you would like to view data that pertains to specific virtual servers, you can select specific virtual servers to filter only their data results. It is important note that all metric data is displayed as a unit over the time period selected for the screen.
The following defines the dimensions that provide traffic analytics for objects protected by a Web Application Security profile.
Note: Some dimensions may not have listed objects, as information may not be available. For example, if your policy is in Transparent mode, or there are no reported attacks, there will be no data listed under the Actions dimension.
- BIG-IP Host Names
- The name of each BIG-IP system that processed the monitored transactions.
- BIG-IP Blade Numbers
- The individual blades (by number) for all monitored BIG-IP devices.
- Applications
- The name of each application reporting HTTP traffic data.
- Application Services
- The name of each HTTP application service reporting transaction data.
- Virtual Servers
- The name of each virtual server that processes monitored transactions.
- ASM Policy Names
- The names of the Web Application Security (ASM) policies that protect the virtual servers currently processing application traffic.
- Actions
- The enforcement applied to a detected attack signature. These actions include:
-
Learn
-
Alarm
-
Block
- Violation Ratings
- The rating assigned to traffic by the Web Application Security policy. The assigned ratings include:
-
Legal, normal traffic that does not contain any threat indicators.
-
Legal (Staging), traffic that is tentatively detected as legal during the policy builder process. The relevant settings in the security policy are in staging.
-
Likely F.P., traffic may present a security threat, but is likely a false positive.
-
Illegal, traffic that contains known violations, or abnormalities, that pose a threat to the application’s performance.
-
Malicious, traffic that contains known threat actors.
- Network Protocols
- The network protocol (HTTP, HTTPS) in the transaction.
- Client IPs
- The client IP address that initiated the HTTP request that was processed by the BIG-IP system.
- Attack Types
- The general category of application-layer attack, as identified by the Web Application Security policy.
- Violations
- The types of traffic violations, as detected by your Web Application Security policy.
- Virus Names
- The names of known viruses detected.
- Client Device IDs
- The unique identifier of the client’s device, derived from a JavaScript injection from BIG-IP to the client device.
- IP Reputation
- The IP categories configured for IP Intelligence. This dimension is relevant to users who have configured an ASM policy with IP Intelligence.
- Countries
- The country listed in the HTTP request that was processed by the BIG-IP system.
- User Name
- The client login name, based on information submitted from a login page. This information is available when Web Application Service is paired with Access service.
- Session ID
- The unique identifier of an HTTP session between the client and the application. This information is stored along with other client data, such as device ID.
- URLs
- The URL that initiated the HTTP request that was processed by the BIG-IP system.
- Response Code Families
- The class of the HTTP response result received by the BIG-IP system.
- Methods
- The HTTP method included in the HTTP request received by the BIG-IP system.
HTTP metrics reflect the quantity, volume and speed of the HTTP traffic processed by your managed BIG-IP systems. Metric sets categorize the metric data according to an aspect of the traffic’s progress throughout the transaction process. The table below defines the metric set and the kind of metric data collected.
|
Metric Set |
Metric Set Definition |
Metric |
Metric Definition |
|---|---|---|---|
|
Transactions |
Each initiated request between the client and BIG-IP system, regardless of the outcome.Note: Depending on your configuration of Web Application Security, not all legal transactions are included in the transaction totals. |
Avg/s |
Average number of transactions per second that were processed by the BIG-IP system. |
|
Total |
Total number of transactions processed by the BIG-IP system. | ||
|
Violations |
The number of violations detected by the Web Application Security policy. |
Avg/s |
The average number of violations detected per second. |
|
Total |
The total number of violations detected over the selected period of time |
You can use the Analytics area of the Application screen to collect additional data about application traffic data. This prompts the system to collect additional metrics about your application’s performance, which enhances your troubleshooting capabilities.
Tip: You can enable Enhanced Analytics on multiple applications at once to the enhanced data objects in the HTTP dashboard (click Monitoring > DASHBOARDS > Local Traffic > HTTP).
-
Open the application properties screen by selecting the application’s name from the Applications screen ( click Applications > APPLICATIONS > <Application Name> > <Application Service>).
-
Click the Enhanced Analytics button to Enhanced Analytics Settings popup screen.
Note: By default, all HTTP metrics (check boxes) are enabled (selected). Selecting only one, or a focused number of metrics, improves the quality of the data collected.
-
Ensure that the Collect HTTP metrics for <Application Name> check box is selected.
-
Leave selected only the check boxes you want, to view specific data within the chart dimensions of the Analytics area.
-
To view details about your application’s security, select Collect Security metrics for all devices hosting <Application Name>.
-
Click Start.
The detail screen for this application displays a banner across the top of the screen, Enhanced Analytics On, with a Stop button. If you return to the Applications screen, the health icon in the applications list is highlighted to indicate which application is running Enhanced Analytics.
-
To disable Enhanced Analytics, click the Stop button in the Enhanced Analytics On banner.
Tip: You can also click Enhanced Analytics, and click Stop in the Enhanced Analytics Settings popup window.
Important: Once you have completed troubleshooting, disable Enhanced Analytics to reduce disk usage allocated for statistics data collection.
When Enhanced Analytics mode is off, dimension statistics persist in the dimension object list, when viewing a time period from when Enhanced Analytics was enabled.
This table lists and describes HTTP options in the Enhanced Analytics Settings popup screen displays additional metric data for the corresponding dimensions, when enabled. The added data is displayed in the HTTP traffic charts. When disabled, these dimensions display aggregated data. When disabled, the dimensions in the table below display data as N/A.
|
Enhanced Metric Setting |
Affected Dimension(s) |
Description |
Suggested Use |
|---|---|---|---|
|
IP Address |
Client IPs |
The IP addresses from which your application receives requests. |
General application performance testing |
|
Geolocation |
Countries |
The countries from which your application receives requests. |
General application performance testing, identifying user personas, security validation. |
|
Operating System & Browser |
OSs Browsers |
The operating systems and browsers from which your application receives requests. |
General application performance testing, testing performance of URLs with high resource requirements. |
|
HTTP Method |
Methods |
The HTTP request methods to your application’s resources. |
General application performance testing, identifying user personas. |
|
Subnet |
Subnets |
The client subnets from which your application receives requests. |
General application performance testing. |
|
URL |
URLs |
The URLs from which your application receives requests. |
General application performance testing, testing performance of URLs with high resource requirements. |
When you are troubleshooting the security status of an application, additional data can help you isolate details that characterize potential, or ongoing, vulnerabilities. On the Application screen, the Enhanced Analytics option provides you with the ability to collect more information about the Web Application Security policy for your application’s BIG-IP host device. When this feature is enabled, the enhanced data displays additional dimension objects and data for the security dimensions found in the Analytics area.
In addition to displaying enhanced traffic data, you can select additional HTTP traffic data to view details about the application’s traffic during the time of an attack (for example, Client IPs, Geolocations, or URLs).
The Enhanced Analytics option does not impact your BIG-IQ system performance. By default,you can enable up to 20 applications simultaneously in Enhanced Analytics mode.
Note: System administrators can adjust the maximum number of applications by modifying the maxNumberOfApps parameter value in the /var/config/rest/config/restjavad.properties.json file.
This table lists and describes the security dimensions that can display additional metric data, when Collect Security metrics for all devices hosting <Application Name> is selected in the Enhanced Analytics Settings popup screen. When Enhanced Analytics is enabled, the added data is displayed in the Web Application Security charts. When disabled, these dimensions display aggregated data in the dimension object list.
| Affected Dimension(s) | Description | Value displayed when disabled |
|---|---|---|
| Network Protocols | The network protocols of the requests to your application. | N/A |
| Client IPs | The client IP addresses sending requests to your application. | Aggregated |
| Client Device IDs | The client IDs generated for requests to your application. | Aggregated |
| IPs Reputation | The client IP reputation categories for requests to your application. | N/A |
| Countries | The countries from which your application receives requests. | N/A |
| Users Name | The user name input for your application. | N/A |
| Session IDs | The assigned session IDs for requests to your application. | N/A |
| URLs | The URLs from which your application receives requests. | N/A |
| Methods | The HTTP request methods to your application’s resources. | N/A |
| Mobile App Types | The mobile application type from which a user sent a request. | N/A |
| Mobile App Versions | The mobile application version from which a user sent a request. | N/A |
| Violations | The types of violations from requests to your application | N/A |
| Virus Names | The names of viruses from requests application | N/A |
Network performance of client-to-application communication relies on the efficiency of latency times and packet volume sent over the TCP protocol. When examining TCP data over time, consider these metrics to evaluate the user experience with the application server.
The image displays the dashboard of an AS3 TCP application service. Using this dashboard, you monitor and mitigate issues with your TCP application service.
Note: TCP analytics is available to all application service types (Legacy and SC) with a TCP analytics profile.
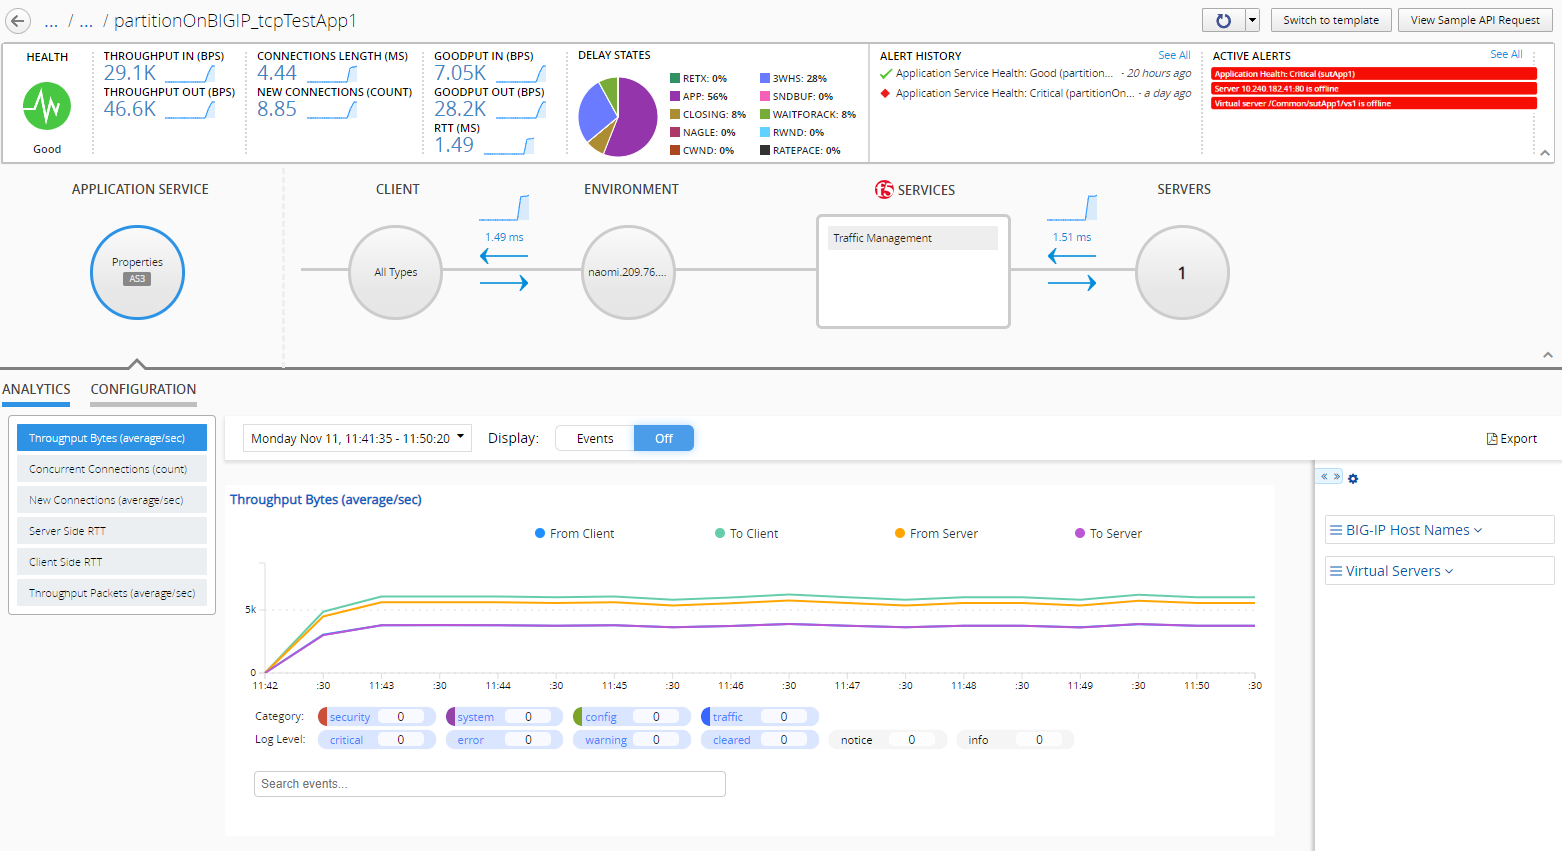
Tip: To evaluate the data for all your TCP applications, go to Monitoring > DASHBOARDS > Local Traffic > TCP.
You can analyze the data of a TCP application service to establish traffic status, or to troubleshoot performance issues.
-
Go to Applications > APPLICATIONS.
A list of all configured applications are displayed.
-
Select the application name that has the TCP application service you would like to monitor.
-
Select the name of the TCP application service.
The TCP application service dashboard is displayed.
-
Use the icons located at the center of the screen to evaluate traffic data in the charts at the bottom of the screen.
To make quick edits to your application service’s configuration, select the CONFIGURATION tab at the center of the screen.
You can evaluate data about your client-side connections using TCP analytics. When viewing TCP connection data, you can analyze detected client IP addresses, or traffic volume data from the client-side. There are two ways to view data: evaluate a specific application service; or evaluate TCP traffic to all your applications. Use the process that best suits your system’s needs.
Tip: For more information about the charts, dimensions and metrics referenced in this task, see TCP charts and TCP dimensions and metrics.
-
To view an application service’s client-side data:
-
Go to Applications > APPLICATIONS
-
Select the application name that hosts your TCP application service.
-
Select the name of the TCP application service.
The application service’s dashboard is displayed. Ensure the ANALYTICS tab at the center of the screen is selected
-
Click the icon All Types under CLIENT.
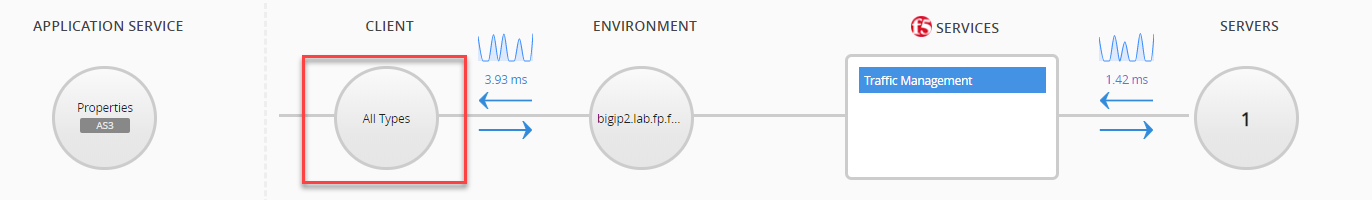
-
Using the menu to the left of the chart, select Client Side Connections.
The chart displays the client-side connection status over the selected time period.
-
To view the client IPs requesting access to your application, expand the dimension Remote Host IP Address, located in the dimension pane to the right of the chart.
You can select a specific IP to filter data displayed in the charts and other dimensions.
-
To view general traffic data, from the client-side, select any of the charts located in the menu to the left.
-
-
To view client-side data for all TCP application services:
-
Go to Monitoring > DASHBOARDS > Local Traffic > TCP.
-
From the dimensions pane, to the right of the charts, expand Requests Side and select Client-Side.
This action will filter all charts and dimensions on the screen to only display client-side request data.
-
To view the client IPs requesting access to your applications, expand the dimension Remote Host IP Address.
The list displays all client IP addresses detected in traffic over the selected time period. You can select one or more IP addresses to further filter the chart and remaining dimension data.
-
The charts that reflect TCP data allow you to analyze current traffic data, and troubleshoot any issues that may occur over time. The parameters found in the charts described can indicate the wait time over the course of the client-server communication channel. To view charts for a TCP application service, go to Applications > APPLICATIONS > <Application_Name> > <TCP_Application_Service>.
Note: You can view TCP data for all your traffic (to all managed applications) by going to Monitoring > DASHBOARDS > Local Traffic > TCP.
Tip: The image shows which selections display the charts detailed below. These charts display a combination of both request and server side data. Click CLIENT or SERVERS to view that part of the transaction with the BIG-IP system. Click Environment to display the status of the BIG-IP device.
- Round Trip Time (RTT)
- A measure of time it takes to send a packet and receive an ACK message from the target host. Increased RTT over time indicates limited network bandwidth.
- Goodput
- The number of useful bytes, delivered by the network, to a destination over time. Low goodput in ratio to overall throughput indicates network issues, such as increased retransmits.
- Delay States
- A traffic condition in which the TCP protocol limits packet flow to avoid network congestion. During periods of congestion, the TCP protocol applies a mitigation algorithm to manage traffic flow according to the root cause of congestion. For more information about the traffic conditions that prompts a delay state, see TCP Dimensions and Metrics.
- Connections
- The average number of new and closed TCP connections. Monitoring your TCP connections can indicate the level of activity across your network.
- Packets
- The volume of transmitted data over the network, including payload, and other required data based on the packet format. The outcome of these packets over time can indicate a number of network issues including: congestion, server performance/capacity limits, or an attack.
The following list defines the metrics gathered to monitor TCP network connections and the dimension aspects from which data is observed. The information provided is found in the dimensions pane tables with the screens that display TCP data. You use this information to filter the on-screen data by specific dimension objects. For example, if you would like to view data that pertains to specific virtual servers. It is important note that all metric data is displayed as a unit over the time period selected for the screen.
The following defines the dimensions found in the dimensions pane that report TCP traffic analytics.
- BIG-IP Service Clusters
- The name of the logical grouping of multiple BIG-IP devices that have the same configuration. This dimension only displays transaction details if you have configured a service cluster.
- BIG-IP Host Names
- The name of each BIG-IP system that processed the monitored transactions.
- BIG-IP Blade Names
- The number of the BIG-IP Blade in a cluster. For a standalone BIG-IP, the value is 0.
- Applications
- The name of each application service grouping that reports TCP traffic data.
- Application Services
- The name of each TCP application service reporting transaction data.
- Virtual Servers
- The name of each virtual server that processes the TCP transactions.
- Request Sides*
- The TCP connection either between the BIG-IP system and the client or the server (depending on the chart in view). The recorded metric is a measure of the communication protocol between the remote host and the BIG-IP virtual server.
- Continent
- The geographic domain, based on continent code, that initiated the TCP connection with the BIG-IP virtual server.
- Subnets
- The subnet of the client IP address that initiated the TCP request that was processed by the BIG-IP system.
- Countries and Regions
- Either the location of the country or region domain, based on the country code, that initiated the TCP connection with the BIG-IP virtual server.
- City and Post Codes
- The location, based on IP location lookup, that initiated the TCP connection with the BIG-IP virtual server.
- Remote Host IP Addresses
- The IP addresses of either the client or servers that have initiated a TCP connection with your BIG-IP system.
- Subscriber Type
- The defined subscriber type based on a Policy Enforcement Manager (PEM) profile. If you do not have PEM subscriber data configured to your BIG-IP system, this dimension will not display detailed data.
- Subscriber Name
- The defined subscriber name based on a Policy Enforcement Manager (PEM) profile. If you do not have PEM subscriber data configured to your BIG-IP system, this dimension will not display detailed data.
- Radio Types
- The defined radio type based on a Policy Enforcement Manager (PEM) profile. If you do not have PEM radio data configured to your BIG-IP system, this dimension will not display detailed data.
- Towers
- The defined tower based on a Policy Enforcement Manager (PEM) profile. If you do not have PEM tower data configured to your BIG-IP system, this dimension will not display detailed data.
- User Provided Keys
- The defined user provided keys based on a Policy Enforcement Manager (PEM) profile. If you do not have PEM user provided keys configured to your BIG-IP system, this dimension will not display detailed data.
TCP metrics reflect the connection volume, connection duration, responses, and contents of the TCP connections to your managed BIG-IP systems. Metric sets categorize the metric data according to an aspect of the TCP connection. The table below defines the metric set and the kind of metric data collected.
| Metric Set | Metric Set Description | Metric | Metric Description |
|---|---|---|---|
| Delay States | The time (in ms) spent in each delay state by all TCP connections. | 3WHS | Delay in outgoing data delivery due to 3-way handshake that starts a TCP connection. This state is accrued only if round-trip-time of the SYN or SYN-ACK could be estimated. |
| RWND | Delay in outgoing data delivery due to limited receive-window, and the remote host’s flow-control forces the BIG-IP system into an idle state. | ||
| RETX | Delay in outgoing data delivery due to retransmission. TCP re-sends data and/or waiting for acknowledgment of those re-transmissions. This may indicate lossy links in the data path, or overly aggressive congestion control (for example, a profile with Slow Start disabled or improperly set Packet Loss Ignore settings). Activating rate-pace in the TCP profile may also help. | ||
| Wait for ACK | Delay in outgoing data delivery due to wait for ACK. The BIG-IP system has sent all available data and is awaiting an ACK from the remote host. If this state is prevalent, it could be a short connection, or the upper layers or the server are forcing TCP to frequently pause to accept new data | ||
| Closing | Delay in ACK of the FIN request. The BIG-IP system has received acknowledgment of all data, sent the FIN, and is awaiting acknowledgment of the FIN. | ||
| CWND | Delay in outgoing data delivery due to limited congestion window. The TCP congestion window is holding available data. This is usually a legitimate response to the bandwidth-delay product and congestion on the packet path. In some cases, it might be a poor response to non-congestion packet loss (fixable using the Packet Loss Ignore profile options) or inaccurate data in the congestion metrics cache | ||
| Nagle | Delay in outgoing data delivery due to Nagle’s algorithm holding sub-MSS size packets. If the Nagle state shows up frequently, disable Nagle’s algorithm in the TCP profile | ||
| Send Buffer | Delay in outgoing data delivery due to a full send buffer. Correctable by increasing the Send Buffer size in the TCP profile | ||
| App | Delay in outgoing data delivery to application layer. The BIG-IP system has successfully delivered all available data. There is a delay in either of the remote hosts, or in the layers above TCP on the BIG-IP system | ||
| Rate Pace | Delay in outgoing data delivery due to rate pacing. This has no impact on throughput, and no action is required | ||
| Packets Lost | Packets lost over the TCP connection between BIG-IP and the remote hosts. | Avg/s | The average number of packets per second lost between BIG-IP and the remote host. |
| Total | The number of packets lost between BIG-IP and the remote hosts. | ||
| Packets Received | Packets received over the TCP connection between BIG-IP and the remote hosts. | Avg/s | The average number of packets per second received by BIG-IP from the remote host. |
| Total | The number of packets received by BIG-IP from the remote hosts. | ||
| Packets Sent | The overall packets sent by BIG-IP to the remote hosts. | Avg/s | The average number of packets per second sent by BIG-IP to the remote hosts. |
| Total | The number of packets sent by BIG-IP to the remote host. | ||
| Goodput Received | The number of application-level bytes, or Goodput, received by BIG-IP from the remote hosts. | Avg/s | Average Goodput in bytes per second, received by BIG-IP from the remote hosts |
| Total | Total Goodput in bytes, received by BIG-IP from the remote hosts | ||
| Max | Highest value of Goodput observed, in bytes per second, for a single connection received by BIG-IP from a remote host | ||
| Min | Lowest value of Goodput observed, in bytes per second, for a single connection received by BIG-IP from the remote hosts | ||
| Goodput Sent | The number of application-level bytes, or Goodput, sent by BIG-IP to the remote hosts. | Avg/s | Average Goodput in bytes per second, sent from BIG-IPs to the remote hosts |
| Total | Total Goodput in bytes, sent from BIG-IP to the remote hosts | ||
| Max | Highest value of Goodput observed, in bytes per second, for a single connection sent from BIG-IP to remote hosts | ||
| Min | Lowest value of Goodput observed, in bytes per second, for a single connection sent from BIG-IP to remote hosts | ||
| Round Trip Time | The communication time (in ms) from a SYN to an ACK message between BIG-IP and the remote hosts | Avg | The average round trip time between BIG-IP and the remote hosts |
| Max | The highest observed round trip time between BIG-IP and the remote hosts | ||
| Min | The lowest observed round trip time between BIG-IP and the remote hosts. | ||
| Count | The number of times a round trip time was measured (number of data samples). | ||
| Connections Opened | Number of new TCP connections opened between BIG-IP and the remote hosts | Avg/s | The average number per second of TCP connections that were opened between BIG-IP and the remote hosts. |
| Total | The number of TCP connections that were opened between BIG-IP and the remote hosts | ||
| Connections Duration | Approximate time (in ms) TCP connections from the moment they are established until they are closed | Duration | The average duration of a TCP connection with BIG-IP from the moment they were established with the remote hosts, and until they were closed. |
| Connections Closed | The number of TCP connections between BIG-IP and remote hosts that were closed | Avg/s | The average number per second of TCP connections that were closed opened between BIG-IP and the remote hosts |
| Total | The number of TCP connections that were closed opened between BIG-IP and the remote hosts |
DNS load balances global resources to control and distribute application traffic according to your policies. Monitoring DNS application service data allows you to evaluate how your DNS configuration manages traffic. You can use the charts to evaluate the DNS application service to your application’s GSLB domain.
To view DNS traffic data, go to Applications > APPLICATIONS > <Application Name> > <DNS Application Service>. From the DNS application service’s dashboard, select the FQDN (domain name) option at the center of the screen. Ensure you are on the ANALYTICS tab, to view data. For more information about editing your DNS service properties or GSLB configuration, see Managing DNS and DNS GSLB objects using BIG-IQ.
This table describes the menu options and charts found in the DNS application service dashboard (Applications > APPLICATIONS > <Application Name> > <DNS Application Service>). Select the option marked in the image to view charts at the bottom of the screen. These charts display the trends of DNS traffic within your application’s domain.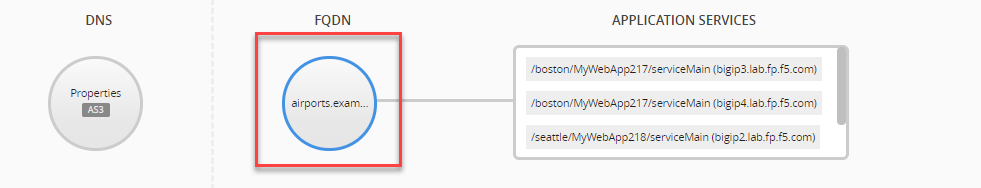
|
ANALYTICS Menu Option |
Chart Title |
Description |
|---|---|---|
|
DNS RPS |
Requests (average/sec) |
The number of DNS name resolution requests per second the BIG-IP system handles based on the rate-limited license installed on the system.Metric Unit: Average DNS requests per second Legend: Requests: The average number of DNS requests per second.Resolved: The average number of resolved DNS requests per second. Persisted: The average number of persistent DNS requests. When DNS persistence is enabled it ensures that when a local DNS makes repetitive requests on behalf of a client, the BIG-IP system reconnects the client to the same resource as previous requests Dropped: The average number of dropped DNS requests per second. |
|
DNS Load Balancing Decisions |
Load Balancing Decisions (average/sec) |
The average number of DNS requests per second, based on the most common load balancing methods applied to DNS traffic. Metric Unit: Average DNS requests per second Legend: Top load balancing methods |
The following list defines the metrics gathered to monitor DNS load balancing services and the dimension aspects from which data is observed. The information provided is found in the dimensions pane tables with the screens that display DNS GSLB data. You use this information to filter the on-screen data by specific dimension objects. For example, if you would like to view data that pertains to specific virtual servers. It is important note that all metric data is displayed as a unit over the time period selected for the screen.
The following defines the dimensions found in the dimensions pane that report DNS service data.
- BIG-IP Host Names
- The name of each BIG-IP system that processed the monitored transactions.
- Wide IP Names
- The unique names assigned to your wide IPs.
- Sync Groups
- The names of configured BIG-IP DNS synchronization groups. These are a collection of multiple BIG-IP DNS systems (running the same version) that synchronize and communicate BIG-IP DNS configuration settings and metrics information.
TCP metrics reflect the connection volume, connection duration, responses, and contents of the TCP connections to your managed BIG-IP systems. Metric sets categorize the metric data according to an aspect of the TCP connection. The table below defines the metric set and the kind of metric data collected.
| Metric Set | Metric Set Description | Metric | Metric Description |
|---|---|---|---|
| Load Balancing Decisions | The pool-level load balancing method applied to DNS name resolution requests | Preferred | The first load balancing method BIG-IP DNS uses to return the IPaddress of a virtual server in response to a DNS name resolution request. The preferred method can be either static or dynamic. |
| Alternate | The load balancing method for DNS requests when the preferred method fails. The alternate method can be only static. | ||
| Fallback | The load balancing method for DNS requests when the alternate fails to return a valid resource in response to a DNS name resolution request. The fallback method can be either static or dynamic. | ||
| CNAME Resolution | The DNS name resolution requests with a CNAME query against a CNAME wide IP. The request was applied to topology load balancing at the wide IP level to make a pool selection. | ||
| Return to DNS | BIG-IP DNS immediately distributes DNS name resolution requests to an LDNS for resolution. | ||
| Return from DNS | DNS name resolution requests that are immediately returned to the LDNS for resolution. | ||
| Requests | The status of requests to your DNS server. | Requests | The overall average number of DNS requests over the selected period of time. |
| Persisted | The average number of DNS requests that maintained a persistent connection over the selected period of time. | ||
| Dropped | The average number of dropped DNS requests over the selected period of time. | ||
| Resolved | The average number of resolved DNS requests over the selected period of time. |
You can monitor the BIG-IP devices that host your application services for performance and resource issues. Although device heath does not directly impact an application’s health status, a device’s ability to manage traffic may eventually impact application performance (e.g. when a DoS attack increases traffic processed by the BIG-IP device). When, By monitoring devices of applications with low health, you can evaluate whether these device issues will require mitigation or prevention measures.
-
Go to Applications > APPLICATIONS
-
Select the application name that hosts the application service with lowered health.
Only TCP and HTTP application services provide device information. For DNS application services, you can use Wide IP alerts to evaluate device management of DNS traffic.
-
Select the name of the application service.
The application service’s dashboard is displayed. Ensure the ANALYTICS tab at the center of the screen is selected
-
Click the icon under ENVIRONMENT, as shown in the image.
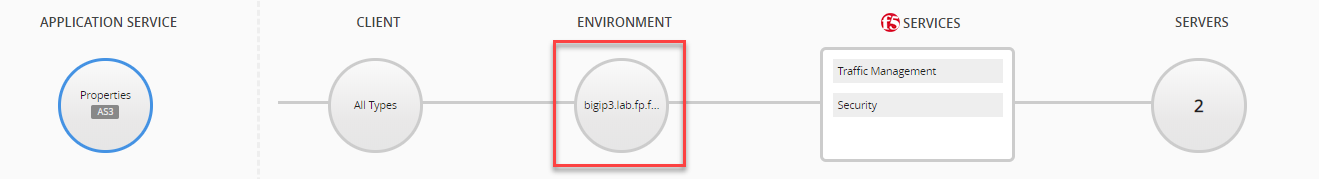
The charts display average data for all devices that manage the application.
-
Using the menu to the left of the chart, select the type of data you would like to evaluate.
To filter chart data, based on a specific BIG-IP blade, CPU core, or interface name, expand the dimensions pane to the right of the chart. You can then expand the dimension widget and select a specific object by which to filter data.
This table describes the menu options and charts found in the application service dashboard (Applications > APPLICATIONS > <Application Name> > <Application Service>). Select the option marked in the image to view charts at the bottom of the screen. These charts display the trends of the host BIG-IP device, or service scaling group. Each chart displays an aspect of the devices as a function of the selected time period.
|
ANALYTICS Menu Option |
Description |
|---|---|
|
CPU Usage |
The percentage of CPU usage based on overall and specific activities of the BIG-IP system devices.Metric Unit: Percent Legend: User: The average percentage of CPU usage for the all the BIG-IP user space programs over a given time period. System: The average percentage of CPU usage for all the running BIG-IP systems over a given time period I/O Wait: The percentage of time (during the selected time period) that a given CPU is idle for an I/O wait operation. This occurs when at least one outstanding I/O disk operation is requested by a task scheduled on system CPU. Stolen: The percentage of time a virtual CPU waits for real CPU when the hypervisor is servicing another virtual machine. |
|
Top Cores |
The six, most active CPU cores for all monitored BIG-IP devices. Metric Unit: Percent Legend: CPU core |
|
Memory |
The percentage of RAM used by system processes of the monitored BIG-IP devices. Metric Unit: Percent Legend: TMM: The average percentage of RAM used by device TMM processes. Total: The average percentage of RAM used by all devices Other: The average percentage of used RAM from non-TMM processes. |
|
Throughput |
The average rate of traffic (in bytes) processed by the BIG-IP device interfaces.Metric Unit: Average/s Legend: In: The average rate of incoming traffic to the BIG-IP devices. Out: The average rate of outgoing traffic from the BIG-IP devices. |
|
Connections |
The average number of connections that are open at the same time, on either the client-side or the server-side.Metric Unit: Count Legend: Client Side: The average number of concurrent connections at the client side. Server Side: The average number of concurrent connections at the server side. |
|
HTTP |
The transaction includes all HTTP request and response messages passed between the client, BIG-IP system, and server.Metric Unit: Average/s Legend: Transactions: Average number of HTTP transactions per second that were processed by the BIG-IP devices. |
|
Dropped |
The average rate of packets per second (pps) that were dropped by the BIG-IP device interfaces or discarded by the TMM over the course of the transaction.Metric Unit: Average/s Legend: In: The average rate of packets per second that were dropped by the BIG-IP interface. Out: The average rate of packets per second that were accepted by the BIG-IP interface, but discarded by the TMM. |
|
Errors |
The average rate packets per second (pps) that were corrupted or arrived incomplete over the course of the transaction across the network,Metric Unit: Average/s Legend: In: The average packets per second received as throughput error. Out: The average packets per second transmitted out at throughput error. |
The following list defines metrics sets and their corresponding metrics for the application statistics displayed in the dimensions pane table in the Device Health screen of the GUI. Each table row is read from left to right, where each metric set is defined as it would relate to each listed dimension, and each metric corresponds to its metric set.
|
Dimension |
Metric Set |
Metric Set Definition |
Metric |
Metric Definition |
|---|---|---|---|---|
|
BIG-IP Host Names BIG-IP Blades Process Name Process ID BIG-IP Modules |
CPU |
The percent CPU usage based on overall and specific activities of the BIG-IP system devices. |
System |
The average (percent) CPU usage for all the running BIG-IP systems over a given time period. |
|
User | ||||
|
I/O Wait |
The percentage of time (during the selected time period) that a given CPU is idle for an I/O wait operation. This occurs when at least one outstanding I/O disk operation is requested by a task scheduled on system CPU. | |||
|
Stolen |
The percentage of time a virtual CPU waits for real CPU when the hypervisor is servicing another virtual machine. | |||
|
Usage |
The percent CPU usage for the various processes used bu the BIG-IP system. | |||
|
BIG-IP Host Names BIG-IP Blades |
Memory Usage |
The percent RAM used by system processes of the BIG-IP system devices. |
Other |
The average percentage of used RAM from other device processes. |
|
TMM |
The average percentage RAM used by device TMM processes. | |||
|
Total |
The average percentage of RAM used by the system’s devices. | |||
|
BIG-IP Host Names BIG-IP Blades BIG-IP CPU Cores |
Disk Merges |
The average rate of merges per second (merge/s) at which an application completes a read or write to a hard disk. This indicated the speed of successful disk merges. |
Avg/s Read |
The average rate per second that an application completes a read merge from the hard disk. |
|
Avg/s Write |
The average rate per second that an application completes a read merge from the hard disk. | |||
|
BIG-IP Host Names BIG-IP Blades |
Disk Operations |
The average rate of operations per second (Ops) at which an application completes a read or write to a hard disk. This operation indicates the speed at which an application saves or extracts data from a hard disk. |
Avg/s Read |
The average rate per second that an application completes a write merge from the hard disk. |
|
Avg/s Write |
The average rate per second that an application completes a write operation to the hard disk. | |||
|
BIG-IP Host Names BIG-IP Blades |
Disk Throughput |
The average rate of bytes per second (Bps) that the application reads or writes from hard disk data. This indicates the speed of the application for the client. |
Avg/s Read |
The average rate per second of bytes that application reads from the hard disk. |
|
Avg/s Write |
The average rate per second of bytes that application writes to the hard disk. | |||
|
BIG-IP Host Names Interface Names |
Throughput Drops |
The average rate of packets per second (pps) that were dropped by the BIG-IP interface or discarded by the TMM over the course of the transaction. |
Avg/s Out |
The average rate of packets per second that were accepted by the BIG-IP interface, but discarded by the TMM. |
|
Avg/s In |
The average rate of packets per second that were dropped by the BIG-IP interface. | |||
|
Total Out |
The total number of packets that were accepted by the BIG-IP interface, but discarded by the TMM. | |||
|
Total In |
The total number of packets that were dropped by the BIG-IP interface. | |||
|
BIG-IP Host Names Interface Names |
Throughput Error |
The average rate packets per second (pps) that were corrupted or arrived incomplete over the course of the transaction across the network. |
Total In |
The total number of packets received as throughput error. |
|
Total Out |
The total number of packets transmitted out as throughput error. | |||
|
Avg/s In |
The average packets per second received as throughput error. | |||
|
Avg/s Out |
The average packets per second transmitted out at through |
The following list defines metrics sets and their corresponding metrics for the application statistics displayed in the dimensions pane table in the Device Traffic screen of the GUI. Each table row is read from left to right, where each metric set is defined as it would relate to each listed dimension, and each metric corresponds to its metric set.
|
Dimension |
Metric Set |
Metric Set Definition |
Metric |
Metric Definition |
|---|---|---|---|---|
|
BIG-IP Host Names BIG-IP Blade Numbers |
New Connections |
The new connections opened with the BIG-IP system either from a client side or server side. |
Avg/s Server |
The average rate of new responses opened per second at the server side. |
|
Avg/s Client |
The average rate of new requests opened per second at the client side. | |||
|
Total Client |
The total number of new requests opened at the client side. | |||
|
Total Server |
The total number of new responses opened at server side. | |||
|
BIG-IP Host Names BIG-IP Blade Numbers |
Concurrent Connections |
The average number of connections that are open at the same time on the client-side and on the server-side. |
Clients |
The average number of concurrent connections at the client side. |
|
Servers |
The average number of concurrent connections at the server side . | |||
|
BIG-IP Host Names BIG-IP Blade Numbers |
Bytes Avg/s |
The average bytes per second that were transmitted through the BIG-IP system. |
C→ |
The average number of bytes per second that were received into the system from the client. |
|
→S |
The average number of bytes per second that were received by the server from the system. | |||
|
←S |
The average number of bytes per second that were transmitted out of the server to the system. | |||
|
C← |
The average number of bytes per second that were transmitted out of the system to the client. | |||
|
BIG-IP Host Names BIG-IP Blade Numbers |
Bytes Total |
The total number of bytes that were transmitted through the BIG-IP system. This represents the total traffic in bytes that were handled by the BIG-IP system. |
C→ |
The total number of bytes received into the system from the client. |
|
→S |
The total number of bytes transmitted out from the system to the server. | |||
|
←S |
The total number of bytes received into the system from the server | |||
|
C← |
The total number of bytes the system transmitted out to the client. | |||
|
BIG-IP Host Names BIG-IP Blade Numbers |
Packets Avg/s |
The average packets per second that were transmitted through the BIG-IP system. This represents BIG-IP system traffic in average packets per second . |
C → |
The average number of packets per second that were received into the system from the client. |
|
→S |
The average number of packets per second that were received into the server from the system. | |||
|
←S |
The average number of packets per second that were transmitted out of the server to the system. | |||
|
C← |
The average number of packets per second that were transmitted out of the system to the client. | |||
|
BIG-IP Host Names BIG-IP Blade Numbers |
Packets Total |
The total number of packets that were transmitted through the BIG-IP system. This represents the total traffic in packets that were handled by the BIG-IP system. |
C→ |
The total number of packets received into the system from the client. |
|
→S |
The total number of packets transmitted out from the system to the server. | |||
|
←S |
The total number of packets received into the system from the server | |||
|
C← |
The total number of packets the system transmitted out to the client. | |||
|
BIG-IP Host Names BIG-IP Blade Numbers |
Transactions |
The transaction includes all request and response messages passed between the client, BIG-IP system, and server. |
Avg/s |
Average number of transactions per second that were processed by the system. |
|
Total |
Total number of transactions processed by the system. | |||
|
Interface Names |
Throughput Bytes |
The bytes transmitted through the interface to the system. |
Total In |
The total number of interface bytes received into the system. |
|
Avg/s In |
The average number of interface bytes per second received into the system. | |||
|
Avg/s Out |
The average number of interface bytes per second transmitted out from the system. | |||
|
Total Out |
The total number of interface bytes transmitted out from the system. | |||
|
Interface Names |
Throughput Packets |
The packets transmitted though the interface to the system. |
Avg/s Out |
The average number of interface packets transmitted out from the system per second. |
|
Total Out |
The total number of interface packets transmitted out from the system. | |||
|
Avg/s In |
The average number of interface packets received into the system per second. | |||
|
Total In |
The total number of interface packets received into the system. | |||
|
Interface Names |
Throughput Multicast |
The multicast packets transmitted through the interface to the system. |
Total In |
The total number of interface multicast packets received into the system. |
|
Total Out |
The total number of interface multicast packets transmitted out from the system. | |||
|
Avg/s In |
The total number of interface multicast packets received into the system. | |||
|
Avg/s Out |
The average number of interface multicast packets transmitted out from the system per second. |
The device health alert notifies you of changes in device resource and throughput metric thresholds for your BIG-IP devices. To view your device health thresholds, go to the Alert Rules screen and select the default device rules (Applications > ALERT MANAGEMENT > Alert Rules.
|
Alert |
Description |
Indication |
Default Thresholds |
Action (if applicable) |
|---|---|---|---|---|
|
|
There has been a change in one or more of the of BIG-IP device health rule metrics. |
One or more of the device resources and/or throughput measurements crossed a defined threshold, which may impact your BIG-IP device’s performance. |
For SSG devices: Customized rules per service scaling group. |
For SSG devices: A critical health status of your BIG-IP device might trigger a scale-out event. Investigate the active alerts for device metrics. For stand-alone BIG-IP devices: Investigate BIG-IP devices with critical or moderate health to adjust or add resources. |