Manual Chapter :
How do events and event controls work?
Applies To:
Show Versions
BIG-IQ Centralized Management
8.2.0,
8.1.0,
8.0.0
How do events and event controls work?
Events overview
Once you enable Events in the time controls, you can find these
events in the charts that display Device, Local Traffic and Web Application Security
data (
Monitoring
DASHBOARDS
), and in the charts that display specific application and BIG-IP device
data (
Applications
APPLICATIONS
or
Applications
ENVIRONMENTS
Service Scaling Groups
).
Events displayed in statistics charts provide you with insights about
changes in application traffic or device resource data that might require attention or
mitigation. An event includes any non-statistical measure that is reported by your
BIG-IP device. Events usually indicate how the system was disrupted as a result of
traffic changes, changes in system objects, or attacks. You can use events to identify
if and when a specific occurrence affected an object's performance.
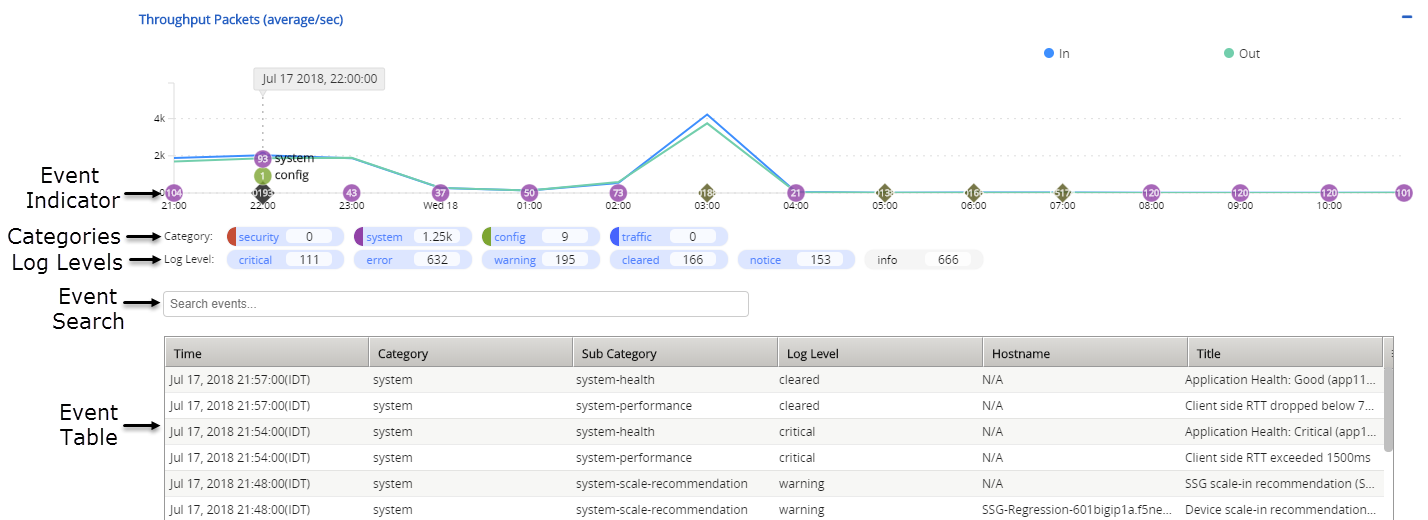
Event Controls
This figure shows a close up of the event controls on a typical
overview screen. To view a screen similar to this, click
Monitoring
DASHBOARDS
Device
Health
. The event controls allow you to: identify when a specific change in data
occurred, filter events according to type (Category) or severity (Log Level), and view
details of specific events.
Overview of event details
The table defines key elements
.
User interface control
What does this control do?
Event Indicator
This control displays, below the chart area, the events
table, which lists all events that occurred at a specific time. Click an
event indicator to display the event table.
The indicator number displays the number of detected
events at that time. This number adjusts to reflect changes to the time
focus.
Events are color-coded according to their Category color.
When more than one event category event occurs at a time, the indicator
shape changes. You can view the event category breakdown by hovering the
cursor over the indicator, as shown in the figure.
Categories
Use this control to filter the events displayed in the
chart by category. Each category indicates the type of the reported event.
Categories provide an organization structure that can
indicate the nature or origin of each event. Each category is color-coded,
and the number indicates the quantity of events from that category that are
displayed in the chart. De-selecting a category (marked in gray) directly
impacts the corresponding quantities in the log-levels and the events
displayed in the chart.
Log Levels
Use this control to filter by log level the events that
are displayed in the chart. Each log level indicates the severity of the
reported event.
Log levels indicate the severity of each event. Log
levels are listed in descending order of severity, where
cleared
indicates that the
triggered event has now returned to a normal status. De-selecting a log
level (marked in gray) directly impacts the corresponding quantities in the
categories and the events displayed in the chart.
By default, notice and info log levels are not
selected.
Event Search
Use this field to enter key words that filter
the events displayed in the events table.
Event Table
Use the event table to review details of the
events selected from the chart area. Click the table rows to view additional
event details.