Applies To:
-
BIG-IQ Centralized Management
8.2.0, 8.1.0, 8.0.0
Navigating a statistics overview screen
This figure shows a typical statistics overview screen. The three parts of the statistics overview screens work together so you can fine-tune the statistics display. To view a screen similar to this, click Monitoring > DASHBOARDS > Device > Health. You must configure statistics collection in order to view data.
Note: The Overview screen for DNS has a few extra controls. For details, see What is different about the DNS Overview screen?.
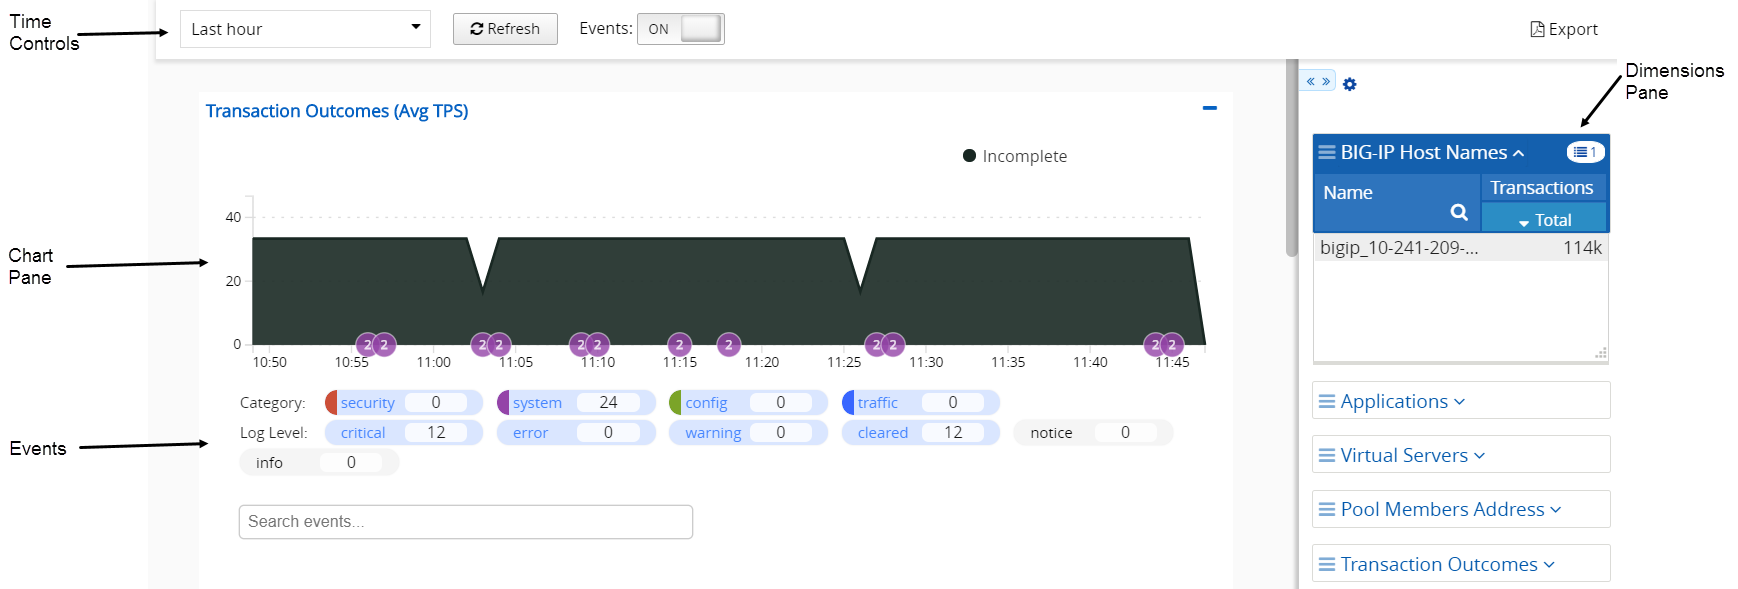
The table defines key elements of this screen.
| User interface area | What does this part of the screen do? |
|---|---|
| Time Controls | Adjusts the time window for which statistics are displayed. For details on how these controls work, see How do the time controls work?. |
| Events and Traffic Capturing | Controls the display of additional data pertaining to traffic patterns detected over time. The Traffic Capturing control is limited to screens that display HTTP traffic information. For details on how these controls work, seeHow do events and traffic capturing controls work? |
| Chart Pane | Displays a series of charts that plot the collected statistics. For details on how to manipulate these charts, see How does the chart pane work?. |
| Dimensions Pane | Determines the objects for which you display statistics. For details on how the controls on this pane work, see How does the dimensions pane work?. |