Updated Date: 07/07/2026
How do the time controls work?
This figure shows a close up of the time controls on a typical overview screen. To view a screen similar to this, click Monitoring > DASHBOARDS > Device > Health.The time controls work together to give you control of the specific time period for which you wan to see statistics.
Key elements are defined in the table:
|
User interface control |
User interface display |
What does this control do? |
|---|---|---|
|
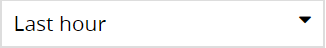
Time Selector |
|
Use this control to specify the length of time for which you want to view statistics data. Time selection options become available as your system gathers data, over time. Data is displayed from the instant the last refresh occurred, back to time interval you specify. For example, if the last refresh occurred at 11:00, and the Time Selector is set to 30 minutes, the charts display data from 10:30 to 11:00. |
|
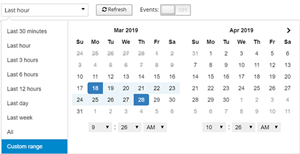
Custom Time Range |
|
Use this control to focus on a specific date and time to display data. Tip: Alternatively, you can click on the chart axis to specify the focus. Click on a point in the axis and drag in the direction that you want to view. As you drag, a highlighted window shows what you have selected for the time selector focus, and a small magnifying glass icon appears. When you have the time selector focus you want, click the magnifying glass. |
|
Refresh Interval |

|
Use this control to specify how frequently the data on this page is refreshed. Click the icon to trigger an immediate refresh of the data on the screen. |
|
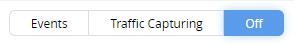
Events and Traffic Capturing |
|
Use this control to display additional traffic information over the charts. By selecting these, you can identify aspects of traffic that caused a change in data or performance:- Events display in the charts when specific changes or exceeded thresholds occurred.
Note: Traffic Capturing is limited to screens that display HTTP data. |
|
Export and Schedule Reports |
|
Use this control to export chart data to a printable source, or create a report schedule for a set of data. For more information about exporting and scheduling statistics reports refer to Scheduling statistics reports. |
|
Inspect Web Application Security Logs |

|
Use this control to navigate to one of the Web Application Security’s logs. The log displays objects based on filters selected from the Web Application Security screen (Monitoring > DASHBOARDS > Web Application Security.Note: This is limited to the Web Application Security screen. |