Updated Date: 07/07/2026
How does the chart pane work?
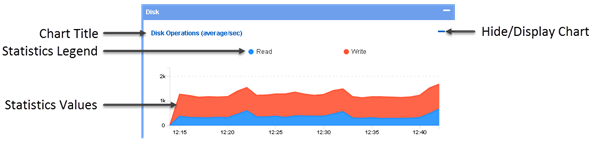
This figure shows a closer look at the elements that make up the chart pane on a typical Overview screen. To view a screen similar to this, click Monitoring > DASHBOARDS > Device > Health. You can re-order the charts by dragging and dropping them into place.
Key elements of this screen are defined in the table.
|
User interface control |
What does this control do? |
|---|---|
|
Chart Title |
Each chart displays a title that identifies the statistic that plots on that chart. Each title includes the units of measure that apply to these plots. |
|
Statistics Legend |
These colored dots identify the specific plots displayed on the chart. When you move your cursor over a chart, the value of each plot displays adjacent to these dots. If there is a multiplier applied to a value, it displays as well. For example, if you hover over one of the New Connections plots and the value |
|
Statistics Values |
These plots display the value of the statistics collected for the selected time period. Data is aggregated for the objects or devices that are currently selected. Initially, the selection is all of the managed objects or devices, but you can use the dimensions pane to change the selection. If you select one device, the charts shows statistics for just that device. If you select two devices, the charts plot aggregated statistics for those devices. If you then select just one device, and five virtual servers, the charts plot aggregated statistics for the five virtual servers and the single device. For more information on using the dimensions pane refer to How does the dimensions pane work? |
|
Hide/Display Chart |
Use this control to hide or display a chart. When you hide a chart, the chart title remains. If you create a comparison chart, an additional control appears that you can use to delete that chart. |