Updated Date: 07/07/2026
What is different about a DNS statistics overview screen?
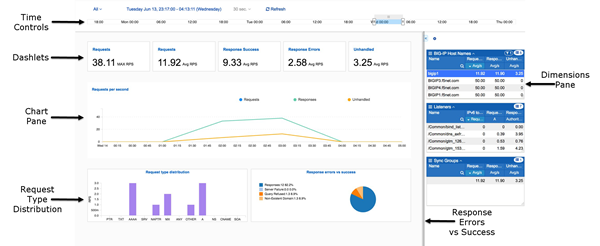
This figure shows a typical DNS statistics overview screen. To view a screen similar to this, click Monitoring > DASHBOARDS > DNS > Overview. Until you configure statistics collection, there won’t be any data. You can use the time controls to focus on a time period of interest, similar to other overview screens. However, there are unique elements on this screen that provide you with a quick overview summarizing the DNS traffic performance on your managed devices.
Key elements of this screen are defined in the table.
| User interface control | What does this part of the screen do? |
|---|---|
| Time Controls | Adjusts the time window for which statistics are displayed. For details on how these controls work, see How do the time controls work? |
| Dashlets | These small windows serve similarly to the gauges on a dashboard, providing a current performance readout for key performance statistics. |
| Chart Pane | Displays a series of charts that plot the collected statistics. For details on how to manipulate these charts, see How does the chart pane work? |
| Request Type Distribution | This chart graphs the types of request that are currently being processed by this DNS sync group. |
| Response Errors vs Success | This chart graphs the DNS sync group’s success rate in processing requests relative to the number of requests that result in errors. |
| Dimensions Pane | Determines the objects for which you display statistics. For details on how the controls on this pane work, see How does the dimensions pane work? |