Updated Date: 07/07/2026
Identify pool members causing traffic performance issues
You can isolate pool members that are causing performance issues to mitigate the performance impact by evaluating your HTTP application services.
Tip: You can apply this procedure to identify server status for TCP traffic as well. However, you will have fewer options to view pool data, or change configuration directly from the application service dashboard.
-
Open the application properties screen by selecting the application’s name from the Applications screen ( click Applications > APPLICATIONS > <Application Name> > <Application Service>).
-
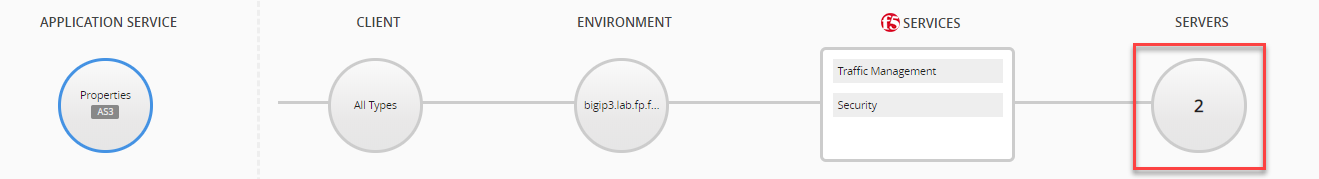
Near the middle of the screen in the SERVERS area, click the numbered icon below to display pool member information in the ANALYTICS area.
-
To view pool member traffic data, select from menu to the left of the screen in the ANALYTICS area (Server Latency, Application Response Time, or Server Side RTT).
-
In the time settings above the chart, ensure that the Events button is set to ON.
-
You can click the Category buttons below the chart such that only the System button is active.
Note: The buttons below the chart have a gray background when disabled, and a blue background, when enabled.
This action filters out all other alert and event categories displayed in the charts.
-
Click an event icon in the chart to display the events and alerts that correspond with the traffic data.
This displays the event table below the chart, which includes details about the events and alerts that occurred at that time.
Tip: You can further filter so that only pool member and virtual server events appear, use the Search events field, and type “server-readiness”.
-
Isolate the affected pool member address from the Title column in the event table, or click the event row to view event details in the Description area.
-
You can analyze additional data for the isolated pool member by expanding the Dimension pane to the right of the chart and selecting the pool member address from the Pool Members Address list.