Updated Date: 07/07/2026
HTTP Application service alerts
HTTP application service alerts notify regarding changes in metrics that can affect the overall performance of traffic or security management for your managed application. When one or more of these thresholds are crossed, the health of your HTTP application service will change. You can view alerts from the single application service’s screen (Applications > APPLICATIONS > <Application Name> > <HTTP application service>), or the alerts screens (Applications > ALERT MANAGEMENT > Active Alerts or Alert History).
The following chart outlines the metric conditions for monitoring HTTP application services.
*Indicates that this data was collected from TCP traffic information, and indicates network latency and transmission times. Mitigation may require changes to your TCP profile.
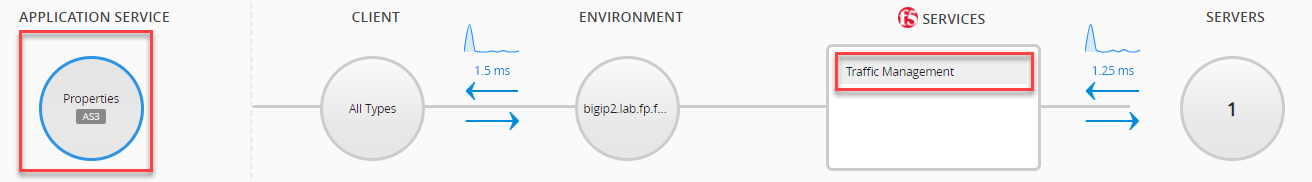
**The Additional Data column refers to the ANALYTICS portion of the single application service’s screen. The charts sited are located when either APPLICATION SERVICE or Traffic Management services are selected, unless stated otherwise (see image for reference).
|
Alert |
Description |
Impact |
Default Thresholds |
Additional Data** |
|---|---|---|---|---|
|
|
The average time from when the server receives the request from the BIG-IP system until the server sends the response. This metric is a reflection of the server’s activities, as it deducts network latency and transmission time. |
Increased server response latency can negatively impact the user’s experience in accessing the application’s contents. |
No default |
Select the Application Response Time chart from the menu to the bottom left. Use the dimensions to the right of the chart to identify if the issue is found on specific virtual servers or pool members. |
|
|
The average round trip time (RTT) for network communication between the BIG-IP system and the application server. |
Increased latency over time can indicate a variety of issues including: server defects, bandwidth outage, or BIG-IP device issues. |
Critical > 50msWarning > 20ms Cleared < 20ms |
Select the Server Side RTT or Client Side RTT chart from the menu to the bottom left. Use the dimensions to the right of the chart to identify if the issue is found on specific BIG-IP devices or virtual servers. |
|
|
The average round trip time (RTT) for network communication between the BIG-IP system and the client application request. |
No default | ||
|
|
The percent of transactions, out of all transactions, that did not complete the request and response exchange. |
A higher percentage of unresolved transactions can indicate a number of issues that negatively impact a user’s connection. Increased incomplete transactions can result from a query timeout, or an unknown cancellation. |
Critical > 5%Warning > 1% Cleared < 1% |
Select the Transactions chart from the menu to the bottom left. Use the dimensions to the right of the chart to identify if the issue is found on specific BIG-IP devices or virtual servers. |
|
|
The average rate of transactions that returned a request error response code (4XX) out of all the overall transactions. |
Increased 4XX errors indicate issues with client-side access, with broken links as the most common error. |
No default |
Select the Response Codes chart from the menu to the bottom left. Use the dimensions to the right chart to filter specific response codes and URLs. |
|
|
The average rate of transactions that returned a server error response code (5XX) out of all the overall transactions. |
Increased 5XX errors indicate issues with the application server. |
Critical > 0.05%Warning > 0.01% Cleared < 0.01% |
Select the Response Codes chart from the menu to the bottom left. Use the dimensions to the right chart to filter specific response codes and pool members. |
|
|
The number of server transactions per second (TPS) is higher than the expected average. |
The rate of application activity is higher than expected and may limit the application server’s resources. This may also indicate an attack. |
No default |
Select SERVER services to view top pool member charts. Select the TPS chart and use the dimensions to the right of the chart to filter specific virtual servers and pool members. |
|
|
The number of server transactions per second (TPS) is lower than the expected average. |
The rate of application activity is lower than expected. This may indicate that your application servers resources are limited. |
No default | |
|
|
The average volume (in Mbps) of traffic sent from BIG-IP to the client. |
Sudden increases in traffic volume can lead to a variety of issues that can affect the application’s performance. When throughput exceeds a certain value you can inspect for: server defects, bandwidth outage, DoS attack signatures or BIG-IP device resource limitations. |
No default |
Select CLIENT services to view client side transaction charts. Select the Client Side Throughput and use the dimensions to the right of the chart to filter specific BIG-IP devices or virtual servers. |
|
|
The average volume (in Mbps) of traffic sent from the client to BIG-IP. |
No default | ||
|
|
The average volume (in Mbps) of traffic sent from BIG-IP to the server. |
No default |
Select SERVER services to view top pool member charts. Select the Server Side Throughput and use the dimensions to the right of the chart to filter specific virtual servers and pool members. | |
|
|
The average volume (in Mbps) of traffic sent from the server to BIG-IP. |
No default | ||
|
|
The volume (in Mbps) of useful, uncorrupted packets received by the client from BIG-IP is lower than expected. |
Lowered goodput indicates suboptimal flow control and congestion avoidance over the transport layer. A lower ratio of goodput to maximum throughput can indicate a number of issues with the network including, an increase in TCP slow start or congestion control, packet loss and network interference. |
No default |
Select CLIENT services to view client side transaction charts. Select the Client Side Goodput chart, and use the dimensions to the right of the chart to filter specific virtual servers and BIG-IP devices. |
|
|
The volume (in Mbps) of useful, uncorrupted packets sent from the client to BIG-IP is lower than expected. |
No default | ||
|
|
The volume (in Mbps) of useful, uncorrupted packets received by the server from BIG-IP is lower than expected. |
No default |
Select SERVER services to view top pool member charts. Select the Server Side Goodput chart, and use the dimensions to the right of the chart to filter specific virtual servers and pool members. | |
|
|
The volume (in Mbps) of useful, uncorrupted packets sent from the server to BIG-IP is lower than expected. |
No default |