Updated Date: 07/07/2026
TCP application service alerts
TCP application service alerts notify you when there are changes in metrics that can affect the overall performance of traffic over the network. There are no default alert thresholds for TCP application services, so you must configure your threshold values to receive alerts. If configured, you can view alerts from the application service’s screen (Applications > APPLICATIONS > <Application Name> > <TCP application service>), or the general alerts screens (Applications > ALERT MANAGEMENT > Active Alerts or Alert History).
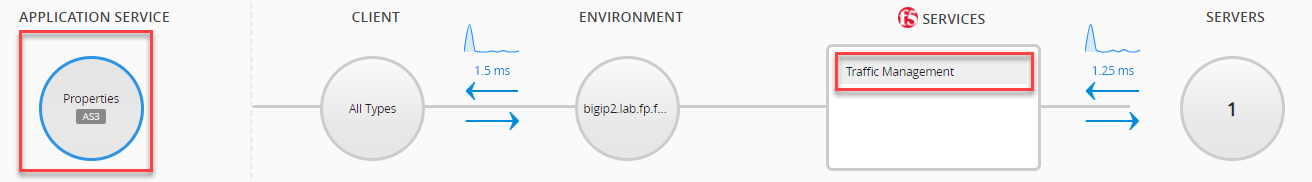
**The Additional Data column refers to the ANALYTICS portion of the single application service’s screen. The charts sited are located when either APPLICATION SERVICE or Traffic Management services are selected, unless stated otherwise (see image for reference).
|
Alert |
Description |
Impact |
Additional Data** |
|---|---|---|---|
|
|
The communication time (in ms) from a SYN to an ACK message between the server and BIG-IP. |
Increased latency over time can indicate a variety of issues including: server defects, bandwidth outage, or BIG-IP device issues. |
Select the Server Side RTT or Client Side RTT in your application service’s ANALYTICS area. Use the dimensions to the right of the chart to identify if the issue is found on specific BIG-IP devices or virtual servers. |
|
|
The communication time (in ms) from a SYN to an ACK message between the client and BIG-IP. | ||
|
|
The average volume (in Mbps) of traffic sent from BIG-IP to the client. |
High throughput can be due to increased application usage, or a DoS attack on the application server. Based on your network resources, higher throughput can lead to increased throughput latency. |
Select the Throughput Bytes (average/sec) chart to view when the throughput increase occurred, and if the increase affected a specific part of the transaction. Use the dimensions to the right of the chart to identify if the issue is found on specific BIG-IP devices or virtual servers. |
|
|
The average volume (in Mbps) of traffic sent from the client to BIG-IP. | ||
|
|
The average volume (in Mbps) of traffic sent from BIG-IP to the server. | ||
|
|
The average volume (in Mbps) of traffic sent from the server to BIG-IP. | ||
|
|
The volume (in Mbps) of useful, uncorrupted packets received by the client from BIG-IP is lower than expected. |
A lower ratio of goodput to maximum throughput can indicate a number of issues with the network including, an increase in incomplete transactions, packet loss and network interference. |
Select CLIENT services to view client side transaction charts. Select the Client Side Goodput chart, and use the dimensions to the right of the chart to filter specific virtual servers and BIG-IP devices. |
|
|
The volume (in Mbps) of useful, uncorrupted packets sent from the client to BIG-IP is lower than expected. | ||
|
|
The volume (in Mbps) of useful, uncorrupted packets received by the server from BIG-IP is lower than expected. |
Select SERVER services to view top pool member charts. Select the Server Side Goodput chart, and use the dimensions to the right of the chart to filter specific virtual servers and pool members. | |
|
|
The volume (in Mbps) of useful, uncorrupted packets sent from the server to BIG-IP is lower than expected. |