Updated Date: 06/30/2026
System Monitoring
You can monitor the configured system settings in the system controller and chassis partition webUI. Each webUI provides different settings.
You can view active system alarms and events in the system controller webUI and CLI.
The Alarms & Events screen is available in both the system controller and chassis partition webUIs. This screen lists the alert information for all performance and network indicators that have currently crossed a performance or health threshold. Use this screen to identify the specific object that is affected.
-
Log in to the VELOS system controller webUI or the chassis partition webUI using an account with admin access.
-
On the left, click System Monitoring > Alarm & Events.
-
Choose from one of these actions:
- To refresh the alarms or events list, click the Refresh icon on the right of the screen.
- To display events result by time preference, select a value from the Time filter. The default value is one hour. For example, select five minutes to display any event that occurred in the last five minutes.
- To display events by severity, select a value from the Severity list. The default value is Informational.
Option Description Emergency Emergency system panic messages Alert Serious errors that require administrator intervention Critical Critical errors, including hardware and file system failures Error Non-critical, but possibly important, error messages Warning Warning messages that should be logged and reviewed Notice Messages that contain useful information, but might be ignored Informational Messages that contain useful information, but might be ignored Debug Detailed messages used for troubleshooting
You can view information about active system alarm conditions from the system controller CLI.
-
Connect using SSH to the system controller floating management IP address.
-
Log in to the command line interface (CLI) of the system controller using an account with admin access.
When you log in to the system, you are in user (operational) mode.
-
View a list of active system alarm conditions.
show system alarms | tabThis example shows a power supply unit (PSU) redundancy fault:
syscon-1-active# show system alarms
ID     RESOURCE        SEVERITY  TEXT                           TIME CREATED
–––––––––––––––––––––––––––––––––––––––––––––––––––––––––––––––––––––––––––––––––––––––––––––––––––––––––––––––-
65796  psu-controller  WARNING   PSU redundancy fault detected  2021-07-01-11:11:11.992270499 UTC
65793  psu-2           ERROR     PSU fault detected             2021-07-01-11:11:11.999825828 UTC
A cluster on a VELOS system is group of blades or nodes working together as a logical unit. The Cluster Details screen on the chassis partition webUI provides detailed information about clusters that might be useful when a chassis partition is made up of more than one slot/blade.
You can view detailed information about clusters from the chassis partition webUI.
-
Log in to the VELOS chassis partition webUI using an account with admin access.
-
On the left, click System monitoring > Cluster Details.
-
On the top right, set the Auto Refresh interval for refreshing the data displayed or click the refresh icon to update the data immediately.
-
View the cluster detail information.
You can view detailed information about clusters from the chassis partition CLI.
-
Log in to the command line interface (CLI) of the chassis partition using an account with admin access.
When you log in to the system, you are in user (operational) mode.
-
Show all cluster details.
show clusterA summary similar to this excerpt displays:
default-1# show cluster
cluster state
cluster disk-usage-threshold state warning-limit 85
cluster disk-usage-threshold state error-limit 90
cluster disk-usage-threshold state critical-limit 97
cluster disk-usage-threshold state growth-rate-limit 10
cluster disk-usage-threshold state interval 60
cluster nodes node blade-1
 state enabled      true
 state assigned     true
 state node-running-state running
 state present      single
 state platform-id  B60100
 state slots        [ 1 ]
 state platform fpga-state FPGA_RDY
 state platform dma-agent-state DMA_AGENT_RDY
 state slot-number  1
 state node-info creation-time 2023-01-06T02:11:09Z
 state node-info cpu 28
 state node-info pods 250
 state node-info memory 131576224Ki
 state ready-info ready true
...
You can use File Utilities to import, export, download, or delete files asynchronously depending on which directory you select to work in. All file transfers are done using the HTTPS protocol.
You can import a file from an external server into the system controller or chassis partition from either the webUI or the CLI. HTTPS is the supported protocol. The remote host should be an HTTPS server with PUT/POST enabled and have a valid CA-signed certificate.
Note: If you want to import the contents of a tar file, you need to extract the contents first before you can import them onto the F5 system.
You can import files into these directories on a system controller :
- images/staging
- configs
You can import files into these directories on a chassis partition:
- configs
- images/import
- images/staging
- images/tenant
You can export a file from a system controller or chassis partition to an external server from either the webUI or the CLI. HTTPS is the supported protocol. The remote host should be an HTTPS server with PUT/POST enabled and have a valid CA-signed certificate.
You can export files in these directories from a system controller:
- configs
- log/confd
- log/controller
- log/host
- diags/core
- diags/crash
- diags/shared
- images/import
- images/staging
You can export files in these directories from the chassis partition:
- configs
- diags/core
- diags/shared
- images
- log
You can download files in these directories from a system controller to your local workstation from the webUI:
- configs
- diags/core
- diags/crash
- diags/shared
- log/confd
- log/controller
- mibs
You can download files in these directories from a chassis partition to your local workstation from the webUI:
- configs
- diags/core
- diags/shared
- log
- mibs
You can upload files in these directories from your local workstation to a system controller from the webUI:
- configs
- images/staging
You can upload files in these directories from your local workstation to a chassis partition from the webUI:
- configs
- images
You can delete files (to which you have file permissions) on a system controller or a chassis partition only from the diags/shared or configs directories from either the webUI or the CLI.
File Utilities are available in both the system controller and chassis partition webUIs. You can use File Utilities to import, export, download, upload, or delete files asynchronously depending on which directory you select to work in. All file transfers are done using the HTTPS protocol.
-
Log in to the VELOS system controller webUI or the chassis partition webUI using an account with admin access.
-
On the left, click System Monitoring > File Utilities.
-
From the Base Directory list, browse the directories and click subfolders to view their contents and the commands that are available from each one.
From a subfolder, click the left arrow next to the path to navigate back to the main folder.
-
To import a file, click Import.
-
In the popup, enter the URL of the file to import.
-
Provide the Username and Password only if required by the remote host.
-
Select Ignore Certificate Warnings if you want to skip warnings when importing files (such as if the remote host does not have a valid CA-signed certificate).
-
Click Import File to begin the import.
-
-
To export a file, select the file and click Export.
-
In the File Export screen, enter the Server URL for where to export the file.
-
Provide the Username and Password only if required by the remote host.
-
Select Ignore Certificate Warnings if you want to skip warnings when importing files.
-
Click Export File to begin the export.
-
-
To upload a file:
Click Upload and select the file you want to upload. The selected file will be uploaded.
-
To download a file:
Select the file and click Download. The selected file will be downloaded.
On the system controller and chassis partition, you can delete files from
diags/shared.
You can view the status of a file transfer operation to view its progress and see if it was successful. If you want to cancel the in-progress file transfer operation, click Cancel. If an operation fails, hover over the warning icon to see the error that occurred.
Note: A runtime error displays in the File Transfer status area, if an invalid operation is performed.
MIB files can be managed from the File Utilities page in both the system controller and chassis partition webUIs. You can use File Utilities to export or download MIB files. File transfers are done using the HTTPS protocol.
-
Log in to the VELOS system controller webUI or the chassis partition webUI using an account with admin access.
-
On the left, click System Monitoring > File Utilities.
-
From the Base Directory list, select mibs.
-
To export a MIB file, select the file and click Export.
-
In the popup, enter the Server URL for where to export the file.
-
Provide the Username and Password only if required by the remote host.
-
Select Ignore Certificate Warnings if you want to skip warnings when importing files.
-
Click Export File to begin the export.
-
-
To download a file:
-
Select the file and click Download.
The selected file will be downloaded.
-
You can view the status of a file transfer operation to view its progress and see if it was successful. If you want to cancel the in-progress file transfer operation, click Cancel. If an operation fails, hover over the warning icon to see the error that occurred.
Note: A runtime error displays in the File Transfer status area, if an invalid operation is performed.
You can view the contents of a file from either the system controller or chassis partition CLI.
-
Log in to the command line interface (CLI) of the system controller or chassis partition using an account with admin access.
When you log in to the system, you are in user (operational) mode.
-
View the contents of a file.
file show <*local-file-path*>This example shows how to view the contents of the
velos.logfile:default-1# file show log/velos.log 2022-02-26T18:23:05.160009+00:00 controller-1(p1) partition-bladesd[7]: priority="Info" version=1.0 msgid=0x6602000000000005 msg="DB is not ready". 2022-02-26T18:23:05.161038+00:00 controller-1(p1) tcpdumpd-master[10]: priority="Notice" version=1.0 msgid=0x5402000000000002 msg="tcpdumpd-master starting" VERSION="1.3.18" DATE="Wed Feb 10 17:04:45 2021". 2022-02-26T18:23:05.161047+00:00 controller-1(p1) tcpdumpd-master[10]: priority="Notice" version=1.0 msgid=0x5402000000000004 msg="tcpdumpd-master args." ARGS="/usr/bin/tcpdumpd_master". 2022-02-26T18:23:05.161053+00:00 controller-1(p1) tcpdumpd-master[10]: priority="Notice" version=1.0 msgid=0x5402000000000004 msg="tcpdumpd-master args." ARGS="-r". 2022-02-26T18:23:05.161057+00:00 controller-1(p1) tcpdumpd-master[10]: priority="Notice" version=1.0 msgid=0x5402000000000004 msg="tcpdumpd-master args." ARGS="1". 2022-02-26T18:23:05.161062+00:00 controller-1(p1) tcpdumpd-master[10]: priority="Notice" version=1.0 msgid=0x5402000000000004 msg="tcpdumpd-master args." ARGS="-l". 2022-02-26T18:23:05.161067+00:00 controller-1(p1) partition-bladesd[7]: priority="Info" version=1.0 msgid=0x6602000000000005 msg="DB is not ready". ...
You can import a file from an external serve onto your system from either the system controller or chassis partition CLI.
-
Log in to the command line interface (CLI) of the system controller or chassis partition using an account with admin access.
When you log in to the system, you are in user (operational) mode.
-
Import a file.
file import [ remote-port <*port-number*> } username <*user*> password <*password*> remote-host <*ip-address-or-fqdn*> remote-file <*remote-file-path*> remote-url <*full-remote-url*> local-file <*local-file-path*> [insecure] web-token <*remote-system-token*>Note: The insecure option ignores certificate warnings during the transfer.
This example shows how to import a file to the system controller:
file import username admin password remote-url
  https://files.company.com/images/BIGIP-1x.x.x.x-x.x.xxx.ALL-F5OS.qcow2.zip
  local-file images/staging
This example shows how to import a file to the chassis partition:
file import username admin password remote-url https://files.company.com/images/BIGIP-1x.x.x.x-x.x.xxx.ALL-F5OS.qcow2.zip local-file images -
Return to user (operational) mode.
end -
Optionally, you can check the file transfer status.
file transfer-status file-name <*local-file-path*>
You can cancel an in-progress file import onto your system from either the system controller or chassis partition CLI.
-
Log in to the command line interface (CLI) of the system controller or chassis partition using an account with admin access.
When you log in to the system, you are in user (operational) mode.
-
Get the operation identifier for the file transfer process.
show file transfer-operationsA summary similar to this example displays:
syscon-1-active# show file transfer-operations file transfer-operations transfer-operation images/import/iso/F5OS-C-1.6.0-1234.CONTROLLER.iso files/F5OS-C/controller/images/F5OS-C-1.6.0-1234.CONTROLLER.iso "Import file" "HTTPS " operation-id IMPORT-C16QYpun status "In Progress (13.0%)" timestamp "Fri Mar 24 23:05:54 2023" -
Cancel the specified file transfer.
file abort-transfer operation-id <*id*>This example shows canceling a specified in-progress file transfer:
syscon-1-active# file abort-transfer operation-id IMPORT-C16QYpun
Aborting will stop the file transfer. Do you want to proceed? [yes/no] yes
result File transfer abort operation initiated.
You can export files to an external server from your system from either the system controller or chassis partition CLI.
-
Log in to the command line interface (CLI) of the system controller or chassis partition using an account with admin access.
When you log in to the system, you are in user (operational) mode.
-
Export a file.
file export insecure local-file <*local-file-path*> protocol { https | scp | sftp } remote-file <*remote-file-path*> remote-host <*ip-address-or-fqdn*> remote-port <*port-number*> remote-url <*ip-address-or-fqdn*> username <*user*> web-token <*remote-system-token*>
You can delete files from either the system controller or chassis partition CLI.
-
Log in to the command line interface (CLI) of the system controller or chassis partition using an account with admin access.
When you log in to the system, you are in user (operational) mode.
-
Delete a file.
file delete file-name <*local-file-path*>
This release supports F5 VELOS platform Foreground diagnostic processes which include Foreground diagnostic profiles. These profiles include the diagnostic analysis of specific components (Such as, CPU, memory, disk).
Foreground diagnostics let you troubleshoot F5 VELOS hardware while the system is still running. You can check the health of hardware components and services without taking tenants offline.
What foreground diagnostics include:
-
Profiles and governance model: A set of rules that control how and when diagnostics run safely on active systems.
-
Task operating model: A framework that defines diagnostic tasks, who runs them, and the business value each task provides.
-
In-service troubleshooting: The ability to run diagnostic checks on live, active hardware without disrupting tenant workloads.
You can perform the diagnostics operations using a CLI, webUI, and REST API. This diagnostic tool allows you to perform following operations:
-
You can start, stop, and execute profile diagnostics for individual nodes.
-
You can view the state of a diagnostic profile, including its unique profile ID, input parameters, run result (passed, error, failure, or inconclusive), run state (running, completed, or aborted), total execution duration, start time, and estimated progress percentage.
Troubleshooting workflows
Foreground diagnostic results are captured as part of the QkView collection, providing enhanced visibility into system health for issue identification and resolution. When you generate a QkView, the system captures diagnostic data.
You can find the Foreground diagnostic profile results in theQkView 'diag-agent/file-system/tmp/profile-results' directory. TheQkView collection process is standard on both F5 VELOS platforms. For QkView generation, see System reports (QKView) overview
The following is a list of nodes and diagnostic profiles of the platforms:
| Node | Profile | Profile summary |
|---|---|---|
| Blade/Controller | drive-status |
Current state of a designated drive provided as an input parameter, or the status of all drives if no input parameter is specified: serial number, model name, firmware version, user capacity, SMART status, error log status, and important SMART attributes. |
| Blade/Controller | aom-test |
Checks AOM health: verifies LOPd is running and the UDP socket is present, confirms the USB device is present, and checks LOP health. |
| Blade/Controller | file-system-status |
Reports file system status: checks file system space and reports RAID status if available. |
| Blade/Controller | platform-test |
Runs platform diagnostics: verifies CPLD read/write from host and LOP, identifies CPLD registers for system health insight, performs PCIe device checks (bus presence, speed, width, link errors — except CC), scans a device subset excluding internal-to-CPU devices, and checks TPM status (except P5a). |
| Blade/Controller | memory-test |
Performs DIMM consistency check (verifies all DIMMs are the same vendor and model) and DIMM count/memory size verification (confirms all DIMMs are present and correctly sized for the platform). |
| Blade | hardware-suite |
Runs the Blade hardware suite, which includes: aom-test, drive-status, memory-test, and platform-test. |
| Controller | chassis-ha-test |
Checks chassis link status: verifies the system-controller high availability (HA) path is functional using iperf3 and checks link status. |
| Controller | hardware-suite |
Runs the Chassis hardware suite, which includes: aom-test, drive-status, fan-status, lcd-status, memory-test, platform-test, and psu-status. |
| LCD | lcd-status |
Verifies LCD info, checks that the LCD is reporting healthy, confirms LCD services are reachable, and queries LCD sensors. |
| Fantray | fan-status |
Checks device presence, reads device sensors (checks limits and sensor faults), reads device status, and checks fan RPM. |
| PSU-Controller | psu-controller-status |
Checks device presence, reads device sensors (checks limits and sensor faults), queries health status from the LOP, and reads and verifies SEEPROM values. |
| PSU | psu-status |
Checks PSU consistency and presence, reports PSU model/serial number/firmware version, and checks all generated binary alerts (sensors and PMBus status registers). |
You can monitor health and state of system from the CLI and webUI.
The list of tasks are performed during the diagnostics operation.
| Diagnostic Operations | Description |
|---|---|
| Nodes | Displays the list of available nodes for the current system |
| List | List all of the available profiles for the given node |
| Profile Help | Displays the help for a given profile, shows descriptions, parameters and example run commands |
| Health | Displays the high-level health of each node within the system |
| Start | |
| Status | |
| Stop | Stop a profile that is currently running |
| Run | |
| Results | Displays the results of a profile that is running or has run in the past |
| History | A list of profiles that have run in the past |
The listed tasks outline key attributes monitored during the operation of a profile.
| Field | Description |
|---|---|
| Profile Id | The unique ID of the profile being run. |
| Parameters | The parameter name/value pair used to invoke the profile. |
| Result | The run result of the profile, which can be one of the following: passed, error, failure, inconclusive. |
| Execution State | The current execution state of the profile, which can be: running, completed, aborted. |
| Execution Duration | The total execution time for the given profile, presented as a string. |
| Started At | The timestamp indicating when the profile was started. |
| Progress | An estimated percent of progress towards completion, with 100% indicating the profile is done. |
-
Log in to the VELOS system controller or chassis partition webUI using an account with admin access.
-
On the left, click System Monitoring > Log Settings.
-
Select the Node from the dropdown for which you want to run the diagnostics.
In the Profiles area, list of profile associated with the Node are displayed.
-
Run the diagnostics for a profile:
-
Run the system’s health diagnostics for a profile without parameter value:
- Select the profile checkbox for which you want to run the diagnostics and click Run Diagnostics.
-
Run the system’s health diagnostics for a profile with parameter value:
-
Select the desired profile checkbox and click RunDiagnostics.
A new drawer with list of parameters and parameter values opens.
-
Click the Run All button to run diagnostics on all parameters using default values.
-
Select your desired options and click Run Selected to run diagnostics on selected parameters. Use the dropdown next to each parameter to modify its value.
-
-
The drawer closes when the diagnostic run starts, and the Diagnostics Status section displays the run details.
-
-
-
In the Diagnostics Status area, the state of the current diagnostics running on your profile is displayed:
-
Active runs include runs triggered from the CLI or runs in progress from previous sessions
-
Health check initiated. The table displays a Stop button next to the progress indicator.
-
The table displays current result information for the running check.
-
Health check initiated on parameterized profile displays parameter name and parameter value along with health check progress state.
-
When Health check aborted a table displays the aborted execution state. You can expand the row to view detailed result information.
-
-
To stop the diagnostics, click Stop button. Upon clicking, a popup will appear displaying the latest status information.
You can view the history and results of system’s health diagnostics for a profile from the webUI.
-
Log in to the VELOS system controller or chassis partition webUI using an account with admin access.
-
On the left, click System Monitoring > Log Settings.
-
Select the Node from the dropdown for which you want to view the information.
In the Profiles area, list of profile associated with the Node are displayed.
-
Select the profile checkbox, click View History.
The system displays a drawer with the profile’s diagnostic history details.
-
Click View Results.
The system displays both the parameter table (for profiles that support parameters) and the results table.
You can run the system’s foreground diagnostics for a profile from the CLI
-
Connect using SSH to the system controller floating management IP address or chassis partition management IP address.
-
Log in to the command line interface (CLI) of the system controller or chassis partition using an account with admin access.
When you log in to the system, you are in user (operational) mode.
-
Change to config mode.
configThe CLI prompt changes to include
(config). -
Run the diagnostics:
-
Run diagnostics for a profile without a parameter value:
system health diagnostics nodes node <node-name> profiles profile <profile-name> startA summary this example displays:
``` syscon-1-active(config)# system health diagnostics nodes node appliance profiles profile platform-test start profile { result inconclusive exec-state starting exec-duration 1.139377ms started-at 2025-09-03T09:38:33Z progress 0 profile-id A.68b7dc2c.3c } ``` -
Run diagnostics for a profile with a parameter value:
system health diagnostics nodes node <node> profiles profile <profile-name> start parameters { parameter { name <node> value <parameter-value>} }A summary to this example displays:
  ```
  syscon-1-active(config)# system health diagnostics nodes node psu profiles profile psu-status start parameters { parameter { name psu value psu-1 } }

      profile {

          parameters {

              parameter {

                  name psu

                  state {

                      value psu-1

                  }

              }

          }

          result inconclusive

          exec-state starting

          exec-duration 1.36711ms

          started-at 2025-01-21T19:02:28Z

          progress 0

          profile-id A.678fef33.21

      }
  ```
-
You can stop diagnostics for a profile, if it is currently in the running state. A unique profile identifier is generated during the Start command.
You can use the profile ID to stop the execution of the diagnostic process.
-
Connect using SSH to the system controller floating management IP address or chassis partition management IP address.
-
Log in to the command line interface (CLI) of the system controller or chassis partition using an account with admin access.
When you log in to the system, you are in user (operational) mode.
-
Change to config mode.
configThe CLI prompt changes to include
(config). -
Stopping a diagnostic process for a profile:
system health diagnostics nodes node <platform> profiles profile <profile-name> action stop <profile-id>
You can view and monitor the system’s health statuses of a profile from the CLI.
-
Log in to the command line interface (CLI) of the system controller or chassis partition using an account with admin access.
When you log in to the system, you are in user (operational) mode.
-
Display the system’s health.
show system health diagnostics nodes node <node name> profiles profile <profile id> stateA summary to this example displays
syscon-1-active# show system health diagnostics nodes node appliance profiles profile platform-test ids id A.68b7dc2c.3c state
state result  passed
state exec-state complete
state exec-duration 0.372
state started-at 2025-09-03T09:38:33.084076831Z
state progress 100
You can view results of the system’s health statuses for the specific parameters and profiles from the CLI
-
Log in to the command line interface (CLI) of the system controller or chassis partition using an account with admin access.
When you log in to the system, you are in user (operational) mode.
-
Display the history and results of diagnostics for a profile:
show system health diagnostics nodes node <node name> profiles profile <profile name> ids id < profile id > fullExample:
syscon-1-active# show system health diagnostics nodes node appliance profiles profile file-system-status ids id A.69faf35e.28 full
The system controller and chassis partition webUIs include options for configuring remote log servers and the log severity level for individual software components and services.
From the webUIs you can generate a system report, or QKView file, to collect configuration and diagnostic information from the VELOS system if you have any concerns about your system operation. The QKView file contains machine-readable (JSON) diagnostic data and combines the data into a single compressed tar.gz format file. You can upload the QKView file to F5 iHealth where you can get help to verify proper operation of the system and get help with troubleshooting and understanding any issues you might be having and ensure that the system is operating at its maximum efficiency.
You can view event logs and configure secure remote logging from the CLI. You can also send host log files, which are in the /var/log directory, as well as audit.log files to the remote server from the CLI.
You can add and display information about configured remote log servers from either the system controller webUIs. You can also change the log severity level for individual software components and services.
-
Log in to the VELOS system controller webUI using an account with admin access.
-
On the left, click System Monitoring > Log Settings.
-
To include hostname configured for your system in the log:
-
On the Include Hostname tile, click the edit icon.
-
Select True from the Include Hostname field dropdown.
-
Click Save.
Note: By default, the Include Hostname dropdown value is set to false.
-
-
To add access to a Remote Log Server, click Add.
-
In the Server field, enter the IPv4 address, IPv6 address, or fully qualified domain name (FQDN) of the remote server. After the remote log server is saved, you cannot modify the server address.
-
In the Port field, enter the port number of the remote server.
The default port value is 514.
-
For Protocol, select UDP or TCP to choose between TCP or UDP input.
Note: The Authenticationfield is displayed only when the TCP protocol is selected.
-
From the Selectors field,
- Select LOCAL0 or AUTHPRIV
- From the Severity list, select the severity level of the messages to log
Option Description Emergency Emergency system panic messages Alert Serious errors that require administrator intervention Critical Critical errors, including hardware and file system failures Error Non-critical, but possibly important, error messages Warning Warning messages that should be logged and reviewed Notice Messages that contain useful information, but might be ignored Informational Messages that contain useful information, but might be ignored Debug Verbose messages used for troubleshooting Note: To add more selectors, click the Add button. To remove the existing selectors, select it and click the Delete button.
-
For Authentication, select the enable or disable option from the list. The default value is Disabled. This option is visible when the TCP protocol is selected while configuring the remote log server. If the UDP protocol is selected, the authentication value is saved as N/A.
-
Click Save
-
-
To delete a remote log server, select the server and click Delete.
-
To configure Host Log Settings, click on the edit icon on the Host Log Settings card.
-
For Host Log Forwarding, select the enable or disable radio button for remote forwarding. The default value is Disabled. When host log forwarding is enabled, the Include Standby Controller field displays.
-
System Controller webUI: For Include Standby Controller, select true or false from the list to include the standby controllers and send the host log files to the active controller. The default value is False. This option is visible when the Host Log Forwarding option is enabled at the chassis level.
-
Chassis Partition webUI: For Include Blades, select one or more blades from the list. This option is visible when the Host Log Forwarding option is enabled at the chassis partition level.
-
For Selectors, select the required facility and severity options from the list. To add more selectors, click Add. To remove the existing selectors, select it and click the Delete.
-
To add the required host log files to the Selected Files panel, click the required host log files checkboxes. Click on directories to view the files and sub-directories and select individual files within the directory.
At the chassis partition level, you can only view the already selected and locked host files.
The Selected Files option allows the host logs files to be forwarded from the directory and subdirectories.
-
For Custom Log File, enter the log file in the text box and click Add to manually add host log file names to the Selected Files panel.
-
Click Save.
-
-
For TLS Certificate & Key, click chevron/expand icon to view the configured TLS Certificate and Key values. Click on edit icon on TLS Certificate & Key card.
-
Update the values in the TLS Certificate and TLS Key fields.
-
Click Save.
Note: If the authentication value is set as enabled for any of the remote log servers, you cannot be able to clear the TLS configuration fields.
-
-
For CA Bundles, click Add to enter the Name and TLS certificate.
-
Enter the Name of the CA certificate.
-
Update the value in the TLS Certificate field.
-
Click Save.
Note: When any of the remote server authentication is enabled, you cannot delete the CA bundle.
-
-
On the Log Settings screen, click the chevron icon to review the software component log levels for individual software components and adjust them as needed. Click Update if you made changes.
The log levels determine at what level events (and all higher levels) are logged for each service. Informational is the default so all except debug-level events are logged.
Component
Description
alert-service
Software component that handles alerts and events at the system level. These components use ConfD to process updates and manage the status of the Alarm LED depending on the severity of the alert.
api-svc-gateway
Software component that manages requests and subscriptions for Tenants on the appliance.
audit-service
Software component for capturing the system configuration related logs in audit log.
authd
Software component responsible for managing the configuration settings for various AAA (Authentication, Authorization, Accounting) mechanisms supported by the F5OS system.
dagd-service
Software component that manages the distribution of Tenant traffic.
datapath-cp-proxy
Software component that manages Tenant datapath setup requests and configuration.
diag-agent
The Diagnostic Agent is responsible for running various diagnostic profiles, gathering and exporting telemetry data and providing system health information and producing the hardware alerts.
diag-data
Software component for primarily tasked with collecting important information periodically from an F5OS device and sending that data back to F5 for analysis purposes.
disk-usage-statd
- dma-agent
Software component for Core Offload feature that functions as a buffer broker, allowing multiple tenants to share access to the FPGA while remaining isolated from one another.
fips-service
Software component for System FIPS configuration and handles system integrity check requests.
firewall-manager
One software component that enables the setting up of a whitelist for designated source IP addresses and destination ports such as HTTP, HTTPS, RESTCONF, SNMP, and vConsole.
fpgamgr
Software component, which manages the datapath FPGAs. This includes front panel interfaces, L2 functionality, and other advanced FPGA features.
ihealth-upload-service
Software component for providing secure way of transporting support package to F5 to different target destination. This service offers historical track records of support package uploads with configurable data retention policy.
ihealthd
Software component responsible for handling ihealth configuration parameters and Start a qkview upload by sending a request to ihealth.
image-agent
A software module that manages the validation of imported tenant images and displays the current status of both tenant and platform images on the user interface.
kubehelper
Software component triggered during tenant deployment and runs as an assistant task before tenant container is created.
For BIG-IP
- Covert qcow2 image to raw format for BIG_IP tenant only.
- Reserves huge pages for the tenant.
- Creates host-net interface for host and tenant communication purposes.
- Creates a tenant management interface for BIG-IP NEXT tenants and includes route integration.
l2-agent
Software component responsible for managing the setup and status of physical connections (such as interfaces and portgroups) and the configuration and status of Layer-2 components (such as VLANs, LAGs, and FDB).
lacpd
Daemon responsible for negotiation of LACP over system interfaces.
license-service
Software component responsible for system licensing installation.
line-dma-agent
Software component which is an fundamental layer of tcpdump in the VELOS/rSeries family.
lldpd
Software component for LLDP configuration.
lopd
Software component to manage communication with the LOP (AOM).
network-manager
Software component responsible for managing datapath related resources, such as MAC Addresses. It also manages datapath tables that route traffic between Tenants and Interfaces.
node-agent
Software component triggered during tenant deployment and node reboots.
- Creates a tenant management interface for BIG-IP NEXT tenants and includes route integration.
- Adds water-marking rules for BIG-IP NEXT tenants.
- In charge of allocating large pages for chassis during tenant deployments.
optics-mgr
Software component that is responsible for storing the tuning values for supported optics. When provided with an optic, returns the proper tuning.
orchestration-agent
Software component for Tenant Orchestration which includes tenant configuration and deployments.
partition-bladesd
Software component responsible for the peer enumerator service, creates a file containing a list of IP addresses for peers in a partition. Qkviewd uses the list of IP addresses for collecting peer qkviews. - The generated peer file is located in
/var/F5/partitionX/qkviewd/peers, where X indicates the partition number.- This container is only relevant for partition qkviews. This container is not intended to be usable by you.
partition-common
Software component responsible for incorporating standard ConfD utility functions that enhance the CLI interface.
partition-ha
Systen partition software component responsible for Partition’s HA control framework.
partition-manager
System partition software component responsible for Partition’s instance of ConfD.
platform-diag
Software component for providing statistics reports and measurements on top of the low-level hardware.
platform-fwu
Software component responsible for updating and reporting firmware.
platform-hal
Software component that provides other services with access to platform/hardware data and configuration.
platform-mgr
This software component displays the versions of platform components, CPUs, memory, and firmware. It also automatically initiates firmware upgrades when upgrading or installing a new ISO and rebooting.
platform-monitor
Monitoring Agent is responsible for:
- Creating telemetry pipelines that query data periodically.
- Applying processors to the data.
- Sending the data to various destinations.
platform-stats
Software component responsible for capturing the various utilization stats of the CPU, drives and memory and storing the data in TMSTAT stat tables.
platform-stats-bridge
Software components responsible for handling the platform statistics to display on user interfaces.
qat-confd-service
Service for communicating QAT device tenant assignments to ConfD tables.
qat-plugin
Kubernetes device plugin for reporting and managing QAT device resources and resource activities related to their respective tenant assignments.
qkviewd
Software component designed to create diagnostic snapshots in containerized systems, known as QKView. A QKView file is a compressed file with diagnostic info from containers, the host, and other systems.The main qkviewd service operates within a container, while qkviewd-host service collects data on the host. A peer system is another system running the qkviewd daemon.
rsyslog-configd
Software component for remote syslog configuration handling.
snmp-service
Software component used to configure system SNMP configuration such as community, target, and user.
snmp-trapd
Software component that process the system alerts/events as traps and sends it to SNMP manager.
sshd-crypto
Software component for handling sshd crypto agility configurations.
stpd
Software component for configuring STP L2 protocol in platform.
stream-generator
Software component provides the capability to produce independent streams of traffic, which can be directed anywhere in the chassis. This service can also connect to the dma-client unix pipes to manage ePVA information. Internally, the stream-generator can asynchronously read the FSC status messages and store the last value in a cache.
Key features of the stream generator:
- The stream-generator utilizes the SEP Topology feature to connect to all 3 data-movers within the dma-agent. The stream can be configured to traverse a specific data-mover.
- A stream can have a flexible transmit schedule.
- The stream’s packet can be a generic MAC frame or it can also include IPv4 + UDP type traffic.
- The stream’s packets can be a variable size.
- The stream can be directed to any Destination ID in the chassis.
- The stream-generator uses a fixed service-id == 6.
sw-rbcast
Software component that is responsible for forwarding broadcast traffic received on a shared VLAN to the tenants which share that VLAN. A secondary responsibility is to forward DLF (destination look-up failures) requests to the fpgamgr component, so that they can be resolved.
tcam-manager
tcpdumpd
Software component responsible for the tcpdump client daemon.
tcpdumpd-manager
Software component responsible for the tcpdump server daemon.
tmstat-agent
Software component for providing the framework which can be used to store the statistics data in centralized location on each host.
tmstat-merged
Software component for providing framework to integrate and divide statistics streams.
user-manager
Software component responsible for the management and configuration of local users on the system such as user accounts, groups/roles, and passwords.
utils-agent
Software component that manages file transfer operations such as import, export, delete, and download/upload.
vconsole
Software component for providing authenticated virtual console access to F5OS tenants.
-
Click Save to save the log settings.
You can add and display information about configured remote log servers from chassis partition webUIs. You can also change the log severity level for individual software components and services.
-
Log in to the command line interface (CLI) of the chassis partition using an account with admin access.
When you log in to the system, you are in user (operational) mode.
-
On the left, click System Monitoring > Log Settings.
-
In Include Hostname section, to include hostname for your configured system in logs, click the Edit button to set the Include Hostname field to True.
Note: By default, the Include Hostname dropdown value is set to true.
-
To add access to a Remote Log Server, click Add.
-
In the Server field, enter the IPv4 address, IPv6 address, or fully qualified domain name (FQDN) of the remote server. After the remote log server is saved, you cannot modify the server address.
-
In the Port field, enter the port number of the remote server.
The default port value is 514.
-
For Protocol, select UDP or TCP to choose between TCP or UDP input. When the TCP protocol is selected, the Authentication field displays.
-
From the Facility list, select LOCAL0.
F5OS supports only the LOCAL0 logging facility. All logs are directed to this facility, and it is the only one that you can use for remote logging.
-
From the Severity list, select the severity level of the messages to log.
Option Description Emergency Emergency system panic messages Alert Serious errors that require administrator intervention Critical Critical errors, including hardware and file system failures Error Non-critical, but possibly important, error messages Warning Warning messages that should be logged and reviewed Notice Messages that contain useful information, but might be ignored Informational Messages that contain useful information, but might be ignored Debug Detailed messages used for troubleshooting -
For Authentication, select the enable or disable option from the list. The default value is Disabled. This option is visible when the TCP protocol is selected while configuring the remote log server. If the UDP protocol is selected, the authentication value is saved as N/A.
-
Click Save.
-
To delete a remote log server, select the server and click Delete.
-
In the Host Log Settings section, click the Edit button to configure the Host Log Settings.
-
For Host Log Forwarding, select the enable or disable for remote forwarding. The default value is Disabled. When host log forwarding is enabled, the Include Standby Controller or Include Blades field displays.
-
System Controller webUI: For Include Standby Controller, select true or false from the list to include the standby controllers and send the host log files to the active controller. The default value is False. This option is visible when the Host Log Forwarding option is enabled at the chassis level.
-
Chassis Partition webUI: For Include Blades, select one or more blades from the list. This option is visible when the Host Log Forwarding option is enabled at the chassis partition level.
-
Click Save.
-
Click the Add button in the Remote Log Servers section to add selectors. In the Add Remote Log Server screen click the Add icon to selector the respective server.
-
Click Save.
-
To add the required host log files to the Selected Files panel, at the chassis level, click the required host log files checkboxes.
At the chassis partition level, you can only view the already selected and locked host files.
The Selected Files option allows the host logs files to be forwarded from the directory and subdirectories.
-
For Custom Log File, enter the log file in the text box and click Add to manually add host log file names to the Selected Files panel.
-
In the TLS Certificate & Key section, click the Edit button to specify TLS Certificate and TLS Key. If the authentication value is set as enabled for any of the remote log servers, you cannot be able to clear the TLS configuration fields.
-
Click Save.
-
For CA Bundles, click Add to enter the name and TLS CA certificate. When any of the remote server authentication is enabled, you cannot delete the CA bundle.
-
On the Log Settings screen, review the software component log levels for individual software components and adjust them as needed. Click Update if you made changes.
The log levels determine at what level events (and all higher levels) are logged for each service. Informational is the default so all except debug-level events are logged.
Component
Description
alert-service
Software component that handles alerts and events at the system level. These components use ConfD to process updates and manage the status of the Alarm LED depending on the severity of the alert.
api-svc-gateway
Software component that manages requests and subscriptions for Tenants on the appliance.
audit-service
Software component for capturing the system configuration related logs in audit log.
authd
Software component responsible for managing the configuration settings for various AAA (Authentication, Authorization, Accounting) mechanisms supported by the F5OS system.
dagd-service
Software component that manages the distribution of Tenant traffic.
datapath-cp-proxy
Software component that manages Tenant datapath setup requests and configuration.
diag-agent
The Diagnostic Agent is responsible for running various diagnostic profiles, gathering and exporting telemetry data and providing system health information and producing the hardware alerts.
diag-data
Software component for primarily tasked with collecting important information periodically from an F5OS device and sending that data back to F5 for analysis purposes.
disk-usage-statd
dma-agent
Software component for Core Offload feature that functions as a buffer broker, allowing multiple tenants to share access to the FPGA while remaining isolated from one another.
fips-service
Software component for System FIPS configuration and handles system integrity check requests.
firewall-manager
One software component that enables the setting up of a whitelist for designated source IP addresses and destination ports such as HTTP, HTTPS, RESTCONF, SNMP, and vConsole.
fpgamgr
Software component, which manages the datapath FPGAs. This includes front panel interfaces, L2 functionality, and other advanced FPGA features.
ihealth-upload-service
Software component for providing secure way of transporting support package to F5 to different target destination. This service offers historical track records of support package uploads with configurable data retention policy.
ihealthd
Software component responsible for handling ihealth configuration parameters and Start a qkview upload by sending a request to ihealth.
image-agent
A software module that manages the validation of imported tenant images and displays the current status of both tenant and platform images on the user interface.
kubehelper
Software component triggered during tenant deployment and runs as an assistant task before tenant container is created.
For BIG-IP
- Covert qcow2 image to raw format for BIG_IP tenant only.
- Reserves huge pages for the tenant.
- Creates host-net interface for host and tenant communication purposes.
- Creates a tenant management interface for BIG-IP NEXT tenants and includes route integration.
l2-agent
Software component responsible for managing the setup and status of physical connections (such as interfaces and portgroups) and the configuration and status of Layer-2 components (such as VLANs, LAGs, and FDB).
lacpd
Daemon responsible for negotiation of LACP over system interfaces.
license-service
Software component responsible for system licensing installation.
line-dma-agent
Software component which is an fundamental layer of tcpdump in the VELOS/rSeries family.
lldpd
Software component for LLDP configuration.
lopd
Software component to manage communication with the LOP (AOM).
network-manager
Software component responsible for managing datapath related resources, such as MAC Addresses. It also manages datapath tables that route traffic between Tenants and Interfaces.
node-agent
Software component triggered during tenant deployment and node reboots.
- Creates a tenant management interface for BIG-IP NEXT tenants and includes route integration.
- Adds water-marking rules for BIG-IP NEXT tenants.
- In charge of allocating large pages for chassis during tenant deployments.
optics-mgr
Software component that is responsible for storing the tuning values for supported optics. When provided with an optic, returns the proper tuning.
orchestration-agent
Software component for Tenant Orchestration which includes tenant configuration and deployments.
partition-bladesd
Software component responsible for the peer enumerator service, creates a file containing a list of IP addresses for peers in a partition. Qkviewd uses the list of IP addresses for collecting peer qkviews.1. The generated peer file is located in /var/F5/partitionX/qkviewd/peers, where X indicates the partition number.2. This container is only relevant for partition qkviews.3. This container is not intended to be usable by customers.
partition-common
Software component responsible for incorporating standard ConfD utility functions that enhance the CLI interface.
partition-ha
Systen partition software component responsible for Partition’s HA control framework.
partition-manager
System partition software component responsible for Partition’s instance of ConfD.
platform-diag
Software component for providing statistics reports and measurements on top of the low-level hardware.
platform-fwu
Software component responsible for updating and reporting firmware.
platform-hal
Software component that provides other services with access to platform/hardware data and configuration.
platform-mgr
This software component displays the versions of platform components, CPUs, memory, and firmware. It also automatically initiates firmware upgrades when upgrading or installing a new ISO and rebooting.
platform-monitor
Monitoring Agent is responsible for:
- Creating telemetry pipelines that query data periodically.
- Applying processors to the data.
- Sending the data to various destinations.
platform-stats
Software component responsible for capturing the various utilization stats of the CPU, drives and memory and storing the data in TMSTAT stat tables.
platform-stats-bridge
Software components responsible for handling the platform statistics to display on user interfaces.
qat-confd-service
Service for communicating QAT device tenant assignments to ConfD tables.
qat-plugin
Kubernetes device plugin for reporting and managing QAT device resources and resource activities related to their respective tenant assignments.
qkviewd
Software component designed to create diagnostic snapshots in containerized systems, known as QKView. A QKView file is a compressed file with diagnostic info from containers, the host, and other systems.The main qkviewd service operates within a container, while qkviewd-host service collects data on the host. A peer system is another system running the qkviewd daemon.
rsyslog-configd
Software component for remote syslog configuration handling.
snmp-service
Software component used to configure system SNMP configuration such as community, target, and user.
snmp-trapd
Software component that process the system alerts/events as traps and sends it to SNMP manager.
sshd-crypto
Software component for handling sshd crypto agility configurations.
stpd
Software component for configuring STP L2 protocol in platform.
stream-generator
Software component provides the capability to produce independent streams of traffic, which can be directed anywhere in the chassis. This service can also connect to the dma-client unix pipes to manage ePVA information. Internally, the stream-generator can asynchronously read the FSC status messages and store the last value in a cache.
Key features of the stream generator:
- The stream-generator utilizes the SEP Topology feature to connect to all 3 data-movers within the dma-agent. The stream can be configured to traverse a specific data-mover.
- A stream can have a flexible transmit schedule.
- The stream’s packet can be a generic MAC frame or it can also include IPv4 + UDP type traffic.
- The stream’s packets can be a variable size.
- The stream can be directed to any Destination ID in the chassis.
- The stream-generator uses a fixed service-id == 6.
sw-rbcast
Software component that is responsible for forwarding broadcast traffic received on a shared VLAN to the tenants which share that VLAN. A secondary responsibility is to forward DLF (destination look-up failures) requests to the fpgamgr component, so that they can be resolved.
tcam-manager
tcpdumpd
Software component responsible for the tcpdump client daemon.
tcpdumpd-manager
Software component responsible for the tcpdump server daemon.
tmstat-agent
Software component for providing the framework which can be used to store the statistics data in centralized location on each host.
tmstat-merged
Software component for providing framework to integrate and divide statistics streams.
user-manager
Software component responsible for the management and configuration of local users on the system such as user accounts, groups/roles, and passwords.
utils-agent
Software component that manages file transfer operations such as import, export, delete, and download/upload.
vconsole
Software component for providing authenticated virtual console access to F5OS tenants.
-
Click Save to save the log settings.
The system logs events to the velos.log file located in the /var/log_controller directory. To list files and view the contents of log files, you use the file command from either the system controller or chassis partition CLI.
-
Connect using SSH to the system controller floating management IP address or chassis partition management IP address.
-
Log in to the command line interface (CLI) of the system controller or chassis partition using an account with admin access.
When you log in to the system, you are in user (operational) mode.
-
List all files in the log directory.
file list path [ log/confd/ | log/controller/ | log/host/ }This example shows an excerpt of the contents of the
log/controller/directory:syscon-1-active# file list path log/controller/ entries { name afu-cookie date Wed Jun 15 19:52:37 UTC 2022 size 33B } entries { name cc-confd date Wed Jun 15 20:25:49 UTC 2022 size 581KB } entries { name cc-confd-hal date Wed Jun 15 19:52:10 UTC 2022 size 0B } ... -
Show the contents of a log file.
file show [ log/confd/<*filename*> | log/controller/<*filename*> | log/host/<*filename*> ]This example shows the contents of the
log/controller/velos.logfile and uses themoreoption to paginate the output:syscon-1-active# file show log/controller/velos.log | more 2022-04-21T08:18:28-07:00 localhost.localdomain notice boot_marker: ---===[ BOOT-MARKER ]===--- 2022-04-21T08:19:39-07:00 controller-1.chassis.local notice boot_marker: ---===[ BOOT-MARKER ]===--- 2022-04-21T15:27:39.925830+00:00 controller-1 alert-service[8]: priority="Notice" version=1.0 msgid=0x2201000000000001 msg="Alert Service Starting..." version="3.10.2" date="Fri Apr 8 09:42:10 2022". 2022-04-21T15:27:39.926245+00:00 controller-1 alert-service[8]: priority="Info" version=1.0 msgid=0x6602000000000005 msg="DB is not ready". 2022-04-21T15:27:39.926264+00:00 controller-1 snmp-trapd[9]: priority="Notice" version=1.0 msgid=0x2101000000000007 msg="SNMP Trap Service Starting..." version="3.2.3" date="Fri Apr 8 09:43:28 2022". 2022-04-21T15:27:39.926274+00:00 controller-1 alert-service[8]: priority="Info" version=1.0 msgid=0x6602000000000005 msg="DB is not ready". -
Show only the most recent entries in a log file.
file tail [ log/confd/<*filename*> | log/controller/<*filename*> | log/host/<*filename*> }This example shows the last ten lines of the
velos.logfile and uses the-foption to append output as the file grows:syscon-1-active# file tail -f log/controller/velos.log 2022-06-16T23:24:36.170220+00:00 controller-1 switchd[8]: priority="Notice" version=1.0 container="VCC-SWITCHD" msgid=0x1001000000000485 msg="Linkstatus change" PORT="1/mgmt0" LINKSTAT="DOWN". 2022-06-16T23:24:36.176481+00:00 controller-1 vcc-lacpd[82]: priority="Info" version=1.0 msgid=0x330100000000004e msg="" info_str="check_if_op_modify(): new oc_if_oper_status: 2 (1:UP 2:DOWN ... )". 2022-06-16T23:24:36.176820+00:00 controller-1 vcc-lacpd[82]: priority="Info" version=1.0 msgid=0x330100000000004e msg="" info_str="check_if_op_modify(): new oc_eth_port_speed: ns: 1857063266 id: 1980508219 ". 2022-06-16T23:24:36.267589+00:00 controller-1 switchd[8]: priority="Notice" version=1.0 container="VCC-SWITCHD" msgid=0x1001000000000485 msg="Linkstatus change" PORT="1/mgmt0" LINKSTAT="DOWN". 2022-06-16T23:24:36.425971+00:00 controller-1 vcc-lacpd[82]: priority="Info" version=1.0 msgid=0x330100000000004e msg="" info_str="CCLacpdWriteHdlr::delete_member(memberName=1/mgmt0) from ConfD". 2022-06-16T23:24:36.434091+00:00 controller-1 vcc-lacpd[82]: priority="Info" version=1.0 msgid=0x330100000000004e msg="" info_str="InterfaceCmObj::modifyOp: if_name=1/mgmt0 mode=FULL DUPLEX status=DOWN speed=10000#012". 2022-06-16T23:24:36.434371+00:00 controller-1 vcc-lacpd[82]: priority="Info" version=1.0 msgid=0x330100000000004e msg="" info_str="InterfaceCmObj::modifyOp: if_name=1/mgmt0 mode=FULL DUPLEX status=DOWN speed=0#012". 2022-06-16T23:25:09.324530+00:00 controller-1 platform-hal[8]: priority="Info" msg="NEBS is assumed to be true as chassis SEEPROM NEBS option couldn't be read" interface="job-2648493" apogeeUuid="a519fa20-ece4-11ec-a487-024264410634" $parent.jobId=0 $parent.apogeeUuid="a519fa20-ece4-11ec-a487-024264410634" $parent.treeUuid="90151e75-edcb-11ec-a487-024264410634" $parent.appKey="hal" actionKey="GET:chassis/nebs-capable" jobId=2648493 jobTreeUuid="90151e75-edcb-11ec-a487-024264410634" 2022-06-16T23:25:09.399391+00:00 controller-1 platform-hal[8]: priority="Info" msg="NEBS is assumed to be true as platform SEEPROM NEBS option couldn't be read" interface="job-2648493" actionKey="GET:chassis/nebs-capable" jobId=2648493 jobTreeUuid="90151e75-edcb-11ec-a487-024264410634" apogeeUuid="a519fa20-ece4-11ec-a487-024264410634" $parent.jobId=0 $parent.apogeeUuid="a519fa20-ece4-11ec-a487-024264410634" $parent.treeUuid="90151e75-edcb-11ec-a487-024264410634" $parent.appKey="hal" 2022-06-16T23:25:09.429431+00:00 controller-1 platform-hal[8]: priority="Info" msg="NEBS is assumed to be true as platform SEEPROM NEBS option couldn't be read" interface="job-2648493" actionKey="GET:chassis/nebs-capable" jobId=2648493 jobTreeUuid="90151e75-edcb-11ec-a487-024264410634" apogeeUuid="a519fa20-ece4-11ec-a487-024264410634" $parent.jobId=0 $parent.apogeeUuid="a519fa20-ece4-11ec-a487-024264410634" $parent.treeUuid="90151e75-edcb-11ec-a487-024264410634" $parent.appKey="hal" _
The system logs events to the velos.log file located in the /var/log_controller directory. To list files and view the contents of log files, you use the file command from the CLI.
-
Connect using SSH to the system controller floating management IP address or chassis partition management IP address.
-
Log in to the command line interface (CLI) of the system controller using an account with admin access.
When you log in to the system, you are in user (operational) mode.
-
Change to config mode.
configThe CLI prompt changes to include
(config). -
Configure secure remote logging. The default value is disabled.
system logging remote-servers remote-server <*name*> config proto <*proto*> remote-port <*port*> authentication { disabled | enabled }This example enables secure remote logging:
syscon-1-active(config)# system logging remote-servers remote-server test config proto test2 remote-port 80 authentication enabled -
Add authentication details for secure remote logging.
system logging remote-servers remote-server <*server-IP*> config authentication -
Add certificate or key details for secure remote logging.
system logging tls { certificate | key } <*string*> -
Add CA bundle details for secure remote logging.
system logging tls ca-bundles ca-bundle <*name*> config name <*name*> content <*ca-cert-contents*>Note: The certificate bundle that you specify must include the certificate chain of the certificate authority.
-
Remove authentication details from secure remote logging.
no system logging remote-servers remote-server <*server-IP*> config authentication -
Remove certificate or key details from secure remote logging.
no system logging tls { certificate | key } <*string*> -
Remove CA bundle details from secure remote logging.
no system logging tls ca-bundles ca-bundle -
Send log files to the remote server.
You can send host log files, which are in the /var/log directory, or audit.log files to the remote server
system logging host-logs config files file <file-name>
-
Commit the configuration changes.
commit -
Return to user (operational) mode.
end -
Show authentication, certificate, key, and CA bundle details.
show running-config system logging tls { certificate | key | ca-bundles } <*string*>
Simple Network Management Protocol (SNMP) is an industry-standard protocol that enables you to use a standard SNMP management system to remotely manage network devices. VELOS systems support SNMPv1, SNMPv2c, and SNMPv3. You can configure the system from both the CLI and webUI.
You can use SNMP to monitor VELOS systems at both the system controller and chassis partition levels. For more comprehensive monitoring, configure your system at both levels from the CLI or webUI. SNMP traps always send from the active system controller’s fixed management IP address as the source IP address.
SNMP support is available in different ways, depending on which F5OS software version you are using. On VELOS systems, SNMP is available from both the system controller and chassis partition CLIs and webUIs.
F5 recommends using the newer system snmp commands, which include support for SNMP versions 1, 2c, and 3. For more information on the older commands, see:
-
F5OS-C software version
Older CLI (v1/v2c only)
Newer CLI (v1/v2c/v3)
webUI
1.5.0
SNMP-COMMUNITY-MIB
SNMP-NOTIFICATION-MIB
SNMP-TARGET-MIB
SNMP-VIEW-BASED-ACM-MIB
SNMPv2-MIB
system snmp communities system snmp engine-id
system snmp targets
system snmp users
SYSTEM SETTINGS > SNMP Configuration
Before you configure SNMP access for VELOS systems:
Before you configure SNMP access for VELOS systems:
- Add the SNMP manager IP address to the system allow list. For more information, see Allow list overview.
- Add descriptions to front-panel interfaces. For more information, see Configure an interface from the CLI.
- Add descriptions to management interfaces. For more information, see Configure management IP addresses from the CLI.
- Add descriptions to LAGs, if needed. For more information, see Configure a static LAG interface from the CLI.
- Download the F5 MIB files from File Utilities in the system controller or chassis partition webUI (on the left, click SYSTEM SETTINGS > File Utilities, and then from Base Directory, select mibs, select a
.tar.gzfile, and click Download). - Configure a DNS name server if you would like to use a fully-qualified domain name (FQDN) instead of an IP address for the SNMP trap destination. For more information, see Configure DNS from the webUI.
You can view SNMP information in the /log/system/snmp.log file. You can download the log file to your local workstation from the File Utilities screen in the system controller or chassis partition webUI on the left, click System Monitoring > File Utilities, and then from Base Directory, select log/system, select snmp.log, and click Download.
For more information about managing files from the system controller or chassis partition webUI or CLI, see File utilities overview.
SNMPWALK is an application on an SNMP management system that performs SNMP GETNEXT requests to query a network device for information. You can provide an object identifier (OID) to specify which portion of the object identifier space to search using GETNEXT requests. The SNMP management system queries all variables in the subtree below the specified OID, displays these values to the user, and stops when it returns results that are no longer inside the range of the specified OID.
The IDs display in text format when the corresponding MIB is loaded in your SNMP management system. If the MIB is not loaded, the walk displays in OID format.
To more accurately map these system OIDs, you must download the F5-OS-SYSTEM-MIB.mib file and load it into your SNMP management system. To download the F5 MIB files, use File Utilities in the system controller or chassis partition webUI on the left, click System Monitoring > File Utilities, and then from Base Directory, select mibs, select a .tar.gz file, and click Download.
You can configure the SNMP properties from the webUI.
-
Log in to the VELOS system controller webUI or the chassis partition webUI using an account with admin access.
-
On the left, click System Monitoring > SNMP.
-
In the Properties section, click the edit icon to specify values in the required fields.
- System Contact
- System Location
- System Name Note: The maximum number characters limit is 255.
-
Click Save.
You can configure SNMP communities with either version 1, version 2c, or both security models from either the system controller or chassis partition webUI.
-
Log in to the VELOS system controller webUI or the chassis partition webUI using an account with admin access.
-
On the left, click System Monitoring > SNMP.
-
In the Communities area, click Add.
-
For Name, enter a descriptive name for the community.
-
For Security Model, select from these security models: v1, v2c, and v1 and v2c.
-
Click Save.
You can configure SNMP version 3, which is a user-based security model, from either the system controller or chassis partition webUI. This model provides support for additional authentication and privacy protocols.
-
Log in to the VELOS system controller webUI or the chassis partition webUI using an account with admin access.
-
On the left, click System Monitoring > SNMP.
-
In the Users area, click Add.
The Add V3 User screen displays.
-
For User, enter the user name.
-
For Authentication Protocol, select from these protocols: MD5, SHA, SHA256, SHA512, or None.
-
For Authentication Password, enter the password for the specified user.
-
For Privacy Protocol, select from these protocols: AES128, AES192, AES256, DES, or None.
-
Click Save.
Before you can add an SNMP target, you must have already configured either the SNMPv1/v2c community or SNMPv3 user.
You can configure SNMP targets from either the system controller or chassis partition webUI. These are required to send system-generated traps to a manager. You can choose either community (v1/v2c) or user-based (v3) security.
-
Log in to the VELOS system controller webUI or the chassis partition webUI using an account with admin access.
-
On the left, click System Monitoring > SNMP.
-
In the Targets area, click Add.
The Add Target screen displays.
-
For Name, enter a descriptive name.
-
For Security Model, select from these security models: v1, v2c, or v3.
-
Select one of these options, depending on the selected security model:
- If you select v1 or v2, for Community, select the community that you created.
- If you select v3, for User, select the user that you created.
-
For IPv4/IPv6, select either IPv4 or IPv6.
-
For Address, enter the IPv4 address, IPv6 address, or fully qualified domain name (FQDN) of the target.
-
For Port, enter the port number for the target.
The default value is 162, and the range is from 1024 to 65535
-
Click Save.
You can configure the SNMP port from the CLI.
-
Connect using SSH to the system controller floating management IP address or chassis partition management IP address.
-
Log in to the command line interface (CLI) of the system controller or chassis partition using an account with admin access.
When you log in to the system, you are in user (operational) mode.
-
Change to config mode.
configThe CLI prompt changes to include
(config). -
Configure SNMP port
system snmp config port <*value*>The following example configures SNMP port ‘5000’:
syscon-1-active(config)# system snmp config port 5000Note: The allowed values for the Port are either 161 or in the ranges of [1024-7000, 7033-8887, 8889-65535]. The port configured in the SNMP Configuration area is reflected on the Allow List Entry screen of the Allowed IP Addresses section under System Security in the System Settings chapter. When an allowlist is created with an SNMP port, the user is not allowed to change the SNMP Port in the SNMP Configuration area, which can cause an error. For more information, see Configure the system allow list from the webUI
-
Commit the configuration changes.
commit
You can configure the SNMP properties from the CLI.
-
Log in to the command line interface (CLI) of the system controller or chassis partition using an account with admin access.
When you log in to the system, you are in user (operational) mode.
-
Change to config mode.
configThe CLI prompt changes to include
(config). -
Configure SNMP properties
SNMPv2-MIB system sysName <*system name*> sysLocation <*location name*> sysContact <*contact details*>A summary of this example displays:
syscon-1-active(config)# SNMPv2-MIB system sysName f5System sysLocation boston sysContact support@f5.com -
Commit the configuration changes.
commit
You can configure SNMP communities with either version 1, version 2c, or both security models from either the system controller or chassis partition CLI.
-
Connect using SSH to the system controller floating management IP address or chassis partition management IP address.
-
Log in to the command line interface (CLI) of the system controller or chassis partition using an account with admin access.
When you log in to the system, you are in user (operational) mode.
-
Change to config mode.
configThe CLI prompt changes to include
(config). -
Configure a community.
system snmp communities community <*community-name*> | config security-model { v1 | v2c }This example creates a community that uses the v2c security model:
syscon-1-active(config)# system snmp communities community v2comm config
  security-model v2c
This example creates a community that uses both v1 and v2c community models:
syscon-1-active(config)# system snmp communities community v1v2c config security-model [ v1 v2c ] -
Commit the configuration changes.
commit -
Return to user (operational) mode.
end -
Verify the community configuration.
show system snmp communitiesA summary similar to this example displays:
syscon-1-active# show system snmp communities
                      SECURITY
NAME       NAME       MODEL
----------------------------------
v1v2c      v1v2c     [ v1 v2c ]
Note: This example shows both security models configured. If you configure only one security model, then only the configured model displays in the output.
You can configure SNMP version 3, which is a user-based security model, from either the system controller or chassis partition CLI. This model provides support for additional authentication and privacy protocols.
-
Connect using SSH to the system controller floating management IP address or chassis partition management IP address.
-
Log in to the command line interface (CLI) of the system controller or chassis partition using an account with admin access.
When you log in to the system, you are in user (operational) mode.
-
Change to config mode.
configThe CLI prompt changes to include
(config). -
Configure a user, including authentication and privacy protocols.
system snmp users user <*user-name*> config authentication-protocol config { md5 | none | sha | sha256 | sha512 } privacy-protocol { aes | aes192 | aes256 | des | none }This example creates a user that uses MD5 authentication and AES for password authentication:
syscon-1-active(config)# system snmp users user jdoe config
  authentication-protocol md5 privacy-protocol aes authentication-password
After you press Enter, you are prompted to enter the authentication password.
(<string, min: 8 chars, max: 32 chars>): ********After you press Enter, configure the privacy password.
syscon-1-active(config-user-v3-user)# config privacy-passwordAfter you press Enter, you are prompted to enter the privacy password.
(<string, min: 8 chars, max: 32 chars>): ********* -
Commit the configuration changes.
commit -
Return to user (operational) mode.
end -
Verify the user configuration.
show system snmp usersA summary similar to this example displays:
syscon-1-active# show system snmp users
                  AUTHENTICATION  PRIVACY
NAME     NAME     PROTOCOL        PROTOCOL
--------------------------------------------
jdoe     jdoe     md5             aes
You can configure SNMP targets with community-based security (SNMPv1/SNMPv2c) from either the system controller or chassis partition CLI. These are required to send system-generated traps to a manager.
-
Connect using SSH to the system controller floating management IP address or chassis partition management IP address.
-
Log in to the command line interface (CLI) of the system controller or chassis partition using an account with admin access.
When you log in to the system, you are in user (operational) mode.
-
Change to config mode.
configThe CLI prompt changes to include
(config). -
Configure a target with community-based security.
system snmp targets target <*target-name*> config community <*community-name*> security-model { v1 | v2c } { ipv4 | ipv6 } address <*ip-address*> port <*port-number*>This example creates a target with community-based security:
syscon-1-active(config)# system snmp targets target v2c-target config community v2c-comm security-model v2c ipv4 address 192.0.2.24 port 5001 -
Commit the configuration changes.
commit -
Return to user (operational) mode.
end -
Verify the target configuration.
show system snmp usersA summary similar to this example displays:
syscon-1-active# show system snmp targets
                                          SECURITY
NAME       NAME       USER     COMMUNITY  MODEL     ADDRESS         PORT  ADDRESS  PORT
-----------------------------------------------------------------------------------------
v2c-target v2c-target jdoe     -          -         192.0.2.24      5001  -        -
You can configure SNMP targets with user-based security (SNMPv3) from either the system controller or chassis partition CLI. These are required to send system-generated traps to an SNMP management system.
-
Connect using SSH to the system controller floating management IP address or chassis partition management IP address.
-
Log in to the command line interface (CLI) of the system controller or chassis partition using an account with admin access.
When you log in to the system, you are in user (operational) mode.
-
Change to config mode.
configThe CLI prompt changes to include
(config). -
Configure a target with user-based security.
system snmp targets target <*target-name*> config user <*user-name*> { ipv4 | ipv6 } address <*ip-address*> port <*port-number*>This example creates a target with user-based security:
syscon-1-active(config)# system snmp targets target v3-target config user jdoe ipv4 address 192.0.2.24 port 5001 -
Commit the configuration changes.
commit -
Return to user (operational) mode.
end -
Verify the target configuration.
show system snmp targetsA summary similar to this example displays:
syscon-1-active# show system snmp targets
                                          SECURITY
NAME       NAME       USER     COMMUNITY  MODEL     ADDRESS         PORT  ADDRESS  PORT
-----------------------------------------------------------------------------------------
v3-target  v3-target  jdoe     -          -         192.0.2.24      5001  -        -
If you have any concerns about your system operation, you can use the QKView utility to generate a system report to collect configuration and diagnostic information from the system.
The QKView file contains machine-readable (JSON) diagnostic data and combines the data into a single compressed tar.gz format file. You can upload the QKView file to F5 iHealth at ihealth2.f5.com, where you can get help verifying proper operation of the system, understanding and troubleshooting any issues you might be having, and ensuring that the system is operating at its maximum efficiency.
When generating a QKView from the CLI, you use the same command to generate a QKView file at both the system/chassis and the chassis partition levels. To generate a QKView from a remote system, the commands differ slightly.
For information about generating a QKView for BIG-IP Next or other tenants, see the documentation on my.f5.com and clouddocs.f5.com.
If you want to upload a QKView file to the F5 iHealth server, your VELOS system must have DNS configured and have internet access to these services using the HTTPS/443 remote service/port:
- api.f5.com
- ihealth-api.f5.com
You can generate a QKView file from either the system controller or chassis partition webUI. Both reports contain diagnostic information, such as configuration data, log files, time series statistics, and platform information.
-
Log in to the VELOS system controller webUI or the chassis partition webUI using an account with admin access.
-
On the left, click System Monitoring > System Reports.
The System Reports screen displays. A list of QKView files that were previously generated are shown with any reports that were uploaded to iHealth.
-
To generate a system report, click Generate QKView.
The Generate QKView screen displays these additional options:
Option
Description
Filename
Specify a name for the file to which QKView file data is written. The default filename is <system-name>.tar.
Timeout Value
Specify the time in seconds after which to stop QKView file data collection. The default value is 0, which indicates no timeout.
Max File Size
Exclude all files greater than the specified size (in MB). The range is from 2 MB to 1000 MB. The default value is 500 MB.
Max Core Size
Exclude core files greater than this size (in MB). The range is from 2 MB to 1000 MB. The default value for maximum core size is 25 MB.
Exclude Cores
Specify whether core files should be excluded from the QKView file. The default is to include core files.
Note: The system runs many commands to collect the diagnostic information, so generating the report might affect its performance.
It takes a few minutes for the system to finish creating the report and list it on the screen. The QKView Status changes to
File generated successfullywhen it is done. -
To upload the report to the F5 iHealth server, select the check box next to the QKView name and click Upload to iHealth.
Note: For information on uploading the report using a web proxy, see “Configure iHealth uploads and web proxy from the webUI”.
The QKView tar file uploads to iHealth, where you can get help to diagnose the health and proper operation of the system. You can view the report at ihealth2.f5.com.
-
To delete a QKView file, select it and click Delete.
You can generate a QKView file from either the system controller or chassis partition CLI. The report contains diagnostic information, such as configuration data, log files, and platform information.
-
Log in to the command line interface (CLI) of the system controller or chassis partition using an account with admin access.
When you log in to the system, you are in user (operational) mode.
-
List existing QKView files.
show system diagnostics qkview -
Generate a QKView file.
system diagnostics qkview capture exclude-cores [ false | true ] filename <*filename*> maxcoresize <*size*> maxfilesize <*size*> timeout <*time*>These options are available:
Option
Description
exclude-cores
Specify whether core files should be excluded from the QKView file. The default is to include core files.
filename
Specify a name for the file to which QKView file data is written. The default filename is
<*system-name*>.qkview.maxcoresize
Exclude core files greater than this size (in MB). The range is from 2 MB to 1000 MB. The default value for maximum core size is 25 MB.
maxfilesize
Exclude all files greater than the specified size (in MB). The range is from 2 MB to 1000 MB. The default value for maximum file size is 500 MB.
timeout
Specify the time in seconds after which to stop QKView file data collection. The default value is 0, which indicates no timeout.
In this example, you generate a QKView file named
client-qkview.tarthat excludes core files and sets a timeout value of 0 (zero), which indicates no timeout:syscon-1-active# system diagnostics qkview capture filename client-qkview exclude-cores true timeout 0 result Qkview file client-qkview is being collected return code 200 -
Check the status of the QKView generation process.
system diagnostics qkview statusA summary similar to this example displays:
syscon-1-active# system diagnostics qkview status result {"Busy":true,"Percent":12,"Status":"collecting","Message":"Collecting Data","Filename":"client-qkview"} resultint 0 -
Delete a QKView file.
system diagnostics qkview delete filename [<*hostname*>:]<*filename*>In this example, you delete a QKView file named “c3-test.tar.canceled” on the local system:
syscon-1-active # system diagnostics qkview delete filename c3-test.tar.canceledIn this example, you delete a QKView file named “c3-test.tar.canceled” on a remote system with the hostname “controller-2”:
syscon-1-active # system diagnostics qkview delete filename controller-2:c3-test.tar.canceledWhen deleting a file from a remote system, append the hostname before the file name, using a colon (:) to indicate where the QKView file is stored.
Next, you upload the report to the iHealth server.
Before you can upload QKView files to F5 iHealth, you must already have configured the system with iHealth credentials.
You can upload a QKView file from either the system controller or chassis partition CLI. The report contains diagnostic information, such as configuration data, log files, and platform information.
-
Connect using SSH to the system controller floating management IP address or chassis partition management IP address.
-
Log in to the command line interface (CLI) of the system controller or chassis partition using an account with admin access.
When you log in to the system, you are in user (operational) mode.
-
Upload a QKView file to iHealth.
system diagnostics ihealth upload qkview-file [<*hostname*>:]<*filename*> description <*qkview-file-description*> service-request-number <*sr-number*>In this example, you upload a QKView file named
client-qkview.tarto iHealth using configured iHealth credentials:syscon-1-active# system diagnostics ihealth upload qkview-file client-qkview.tar description testing service-request-number C523232 message HTTP/1.1 202 Accepted Location: /support/ihealth/status/iuw53AYW Date: Mon, 11 Jul 2022 12:09:08 GMT Content-Length: 00In this example, you upload a QKView file named
client-qkview.tarto iHealth using configured iHealth credentials on a remote system with the hostname “controller-2”:syscon-1-active# system diagnostics ihealth upload qkview-file controller-2:client-qkview.tar description testing service-request-number C523232 message HTTP/1.1 202 Accepted Location: /support/ihealth/status/iuw53AYW Date: Mon, 11 Jul 2022 12:09:08 GMT Content-Length: 00
Finally, you view the uploaded report on F5 iHealth at ihealth2.f5.com.
The System Inventory screen on the system controller webUI enables you to see an inventory of all components on the VELOS system, including the system controllers, blades, power supply units (PSU), PSU controller, fan tray, and LCD. The inventory includes the component name, status, part number, and serial number.
You can view an inventory of all of the system components on the VELOS system, including the system controllers, blades, power supply units (PSU), PSU controller, fan tray, and LCD from the system controller webUI. The inventory includes the component name, status, part number, and serial number.
-
Log in to the VELOS system controller webUI using an account with admin access.
-
On the left, click System Monitoring > System Inventory.
The system inventory displays, and you can review the information about the components on the VELOS system. An example is shown here.
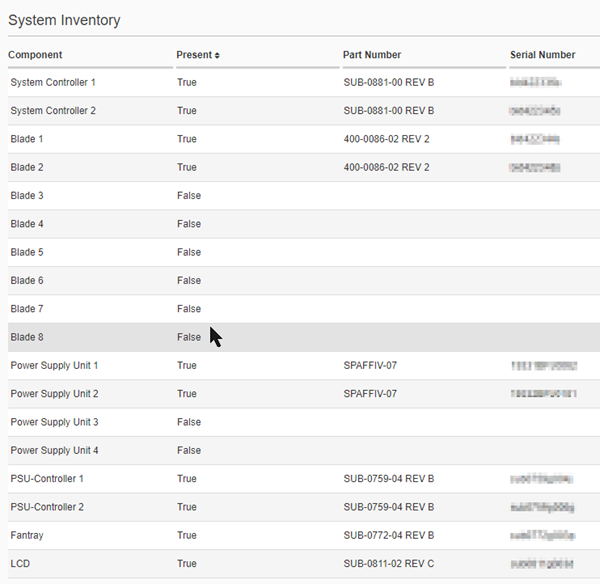
You can view an inventory of all of the system components on the VELOS system, including the system controllers, blades, power supply units (PSU), PSU controller, fan tray, and LCD from the system controller CLI. The inventory includes the component name, status, part number, and serial number.
-
Connect using SSH to the system controller floating management IP address.
-
Log in to the command line interface (CLI) of the system controller using an account with admin access.
When you log in to the system, you are in user (operational) mode.
-
View information about system components.
Add a specific component to show information only about that component or omit it to show information about all components.
show components component [ <*specific-component*> ]In this example, you view details only about the system storage:
syscon-1-active# show components component storage
components component controller-1
 storage state disks disk nvme0n1
  state model "SAMSUNG MZ1LB960HAJQ-00007"
  state vendor Samsung
  state version EDA7602Q
  state serial-no S123NA0NA04567
  state size 894.00GB
  state type nvme
 storage state disks disk sda
  state model DataTraveler
  state vendor Kingston
  state version 3.0
  state serial-no 0000000005??
  state size 28.00GB
  state type usb
components component controller-2
 storage state disks disk nvme0n1
  state model "SAMSUNG MZ1LB960HAJQ-00007"
  state vendor Samsung
  state version EDA7602Q
  state serial-no S123NA0NA45678
  state size 894.00GB
  state type nvme
 storage state disks disk sda
  state model DataTraveler
  state vendor Kingston
  state version 3.0
  state serial-no 000000000123
  state size 28.00GB
  state type usb
You can monitor data and metrics related to the usage, performance, and behavior of the system from the webUI. These statistics are crucial for monitoring, managing, and optimizing the system. You can monitor the following system details:
- System CPU Usage: Shows the measurement of CPU utilization by the system.
- System Memory Usage: Shows the measurement of memory utilization by the system.
- System Disk Usage: Shows the measurement of disk utilization by the system.
You can monitor system’s statistics from the webUI.
-
Log in to the VELOS chassis partition webUI using an account with admin access.
-
On the left, click System Monitoring > System Reports.
-
Select a configured blade from the Blade dropdown to see the system statistics.
You can now see the following statistics and status of the system.
- System CPU Usage: Displays the vCPU’s current utilization of the system by default. However, if multiple vCPUs are available, you can select a vCPU and change the time series to view the historical data and analyze the vCPU utilization.
- System Memory Usage: Displays the current memory utilization of the system by default. However, you can change the time series to view the historical data and analyze memory utilization.
- System Disk Usage: Displays the disk’s current utilization of the system by default. However, if multiple disks are available, you can select a disk, data type, and change the time series to view the historical data and analyze memory utilization
You can monitor data and metrics related to the usage, performance, and behavior of a tenant from the CLI. These statistics, tenant CPU usage, memory usage and disk usage, are crucial for monitoring, managing, and optimizing the tenant.
-
Log in to the command line interface (CLI) of the chassis partition using an account with admin access.
When you log in to the system, you are in user (operational) mode.
-
Show tenants status and statistics.
tenants tenant <*tenant name*> state <*action*>Note: You can get the stats with an average of 10 seconds, 30 seconds, 1 minute, 5 minutes, and 10 minutes.
This example displays the tenant status and statistics for a BIG-IP tenant running on the rSeries system.
-
For CPU stats that average for every 1 minute:
default-1(config)# components component blade-1 state cpu-thread-stats average 1m-avg averages { unix-seconds 1717588320 cpu-threads { cpu-thread { thread-index 0 busy-percent 1 } cpu-thread { thread-index 1 busy-percent 0 } cpu-thread { thread-index 2 busy-percent 0 } cpu-thread { thread-index 3 busy-percent 4 } cpu-thread { thread-index 4 busy-percent 4 } cpu-thread { thread-index 5 busy-percent 4 } cpu-thread { thread-index 6 busy-percent 4 } cpu-thread { thread-index 7 busy-percent 12 } cpu-thread { thread-index 8 busy-percent 4 } cpu-thread { thread-index 9 busy-percent 1 } cpu-thread { thread-index 10 busy-percent 4 } cpu-thread { thread-index 11 busy-percent 4 } cpu-thread { thread-index 12 busy-percent 4 } default-1(config)# -
For disk stats that average for every 1 minute:
default-1(config)# components component blade-1 state disk-stats average 1m-avg averages { unix-seconds 1717588260 used-percent 88 disk-list { disk { disk-name nvme0n1 total-iops 0 read-iops 0 read-bytes 148 write-iops 154 write-bytes 1691163 } } } default-1(config)# -
For interface stats that average for every 1 minute:
default-1(config)# components component blade-1 state interface-stats average 1m-avg averages { unix-seconds 1717588380 interface-list { interface { interface-name 1.0 ifc-bytes-in 1466 ifc-bytes-out 0 ifc-packets-in 0 ifc-packets-out 0 } interface { interface-name 2.0 ifc-bytes-in 135 ifc-bytes-out 0 ifc-packets-in 0 ifc-packets-out 0 } } } default-1(config)# -
For memory stats that average for every 1 minute:
default-1(config)# components component blade-1 state memory-stats average 1m-avg
averages {
        unix-seconds 1717588440
        available 8493508881
        free 1060426615
        used-percent 93
        platform-total 16107667456
        platform-used 8114811835
    }
default-1(config)#
-
OpenTelemetry streamlines observability in distributed systems through standardized APIs, libraries, and tools for collecting telemetry data, including traces, metrics, and logs.
F5OS OpenTelemetry enables the efficient collection of streaming metrics and logs in a structured format from the F5OS product to display in your observability platform. All the metrics and logs will be exported through a gRPC connection. The F5OS supports gRPC endpoints and each OpenTelemetry Line Protocol (OTLP) endpoint is provided with the ability to toggle instrument based filtering.
Telemetry subsystem within the F5OS platform layer generates common attributes and different metrics to display in your observability platform.
An instrument is an area of metrics, which contain multiple metrics and can be enabled selectively. F5OS Resource includes instruments.
Summarizes the metrics that are associated with each tenant as they enters and exits the platform hardware at the DMA level.
The following tenant metrics are currently reported by the BIG-IP tenant into the F5OS platform layer. The metrics visible at the platform layer are only a limited subset of the total number of metrics available to the tenant. You can view the full tenant metrics by using the BIG-IP metric reporting capability.
F5OS OpenTelemetry exporter will only report the metrics that are associated with the Docker containers managed by the platform layer. For more information about the docker container metrics, see Docker stats documentation.
The platform hardware sensors represent physical sensors associated with the hardware which measure: temperature, current, power, voltage, RPM and percent humidity.
The metric schema is heavily dependent upon the internal representation of the tmstat tables within F5OS.
An instrument is an area of metrics, which contain multiple metrics and can be enabled selectively. F5OS Resource includes instruments.
| Instument name | Description |
|---|---|
| all | All the logs and metrics produced by the F5OS platform layer except docker container metrics |
| logs | All the F5OS logs file |
| platform-log | All the F5OS platform logs file |
| event-log | All the F5OS ConfD event log |
| metrics | All the F5OS metrics except docker container metrics |
| platform | Standard platform metrics such as memory, disk, CPU, and interface |
| hardware | The low-level platform hardware sensors |
| optics | The front-panel optic DDM metrics |
| tenant | Tenant-initiated metrics such as memory, disk, CPU, and interface |
| datapath | F5OS data-path metrics such as those generated by the FPGA and DMA |
| tmstat | F5OS tmstat tables exported as metrics |
| container | Docker container metrics for F5OS services |
Note: Support for the intrument “tenant” is provided only for BIG-IP tenants.
This image provides a representation how the F5OS Resource includes instruments with multiple metrics:
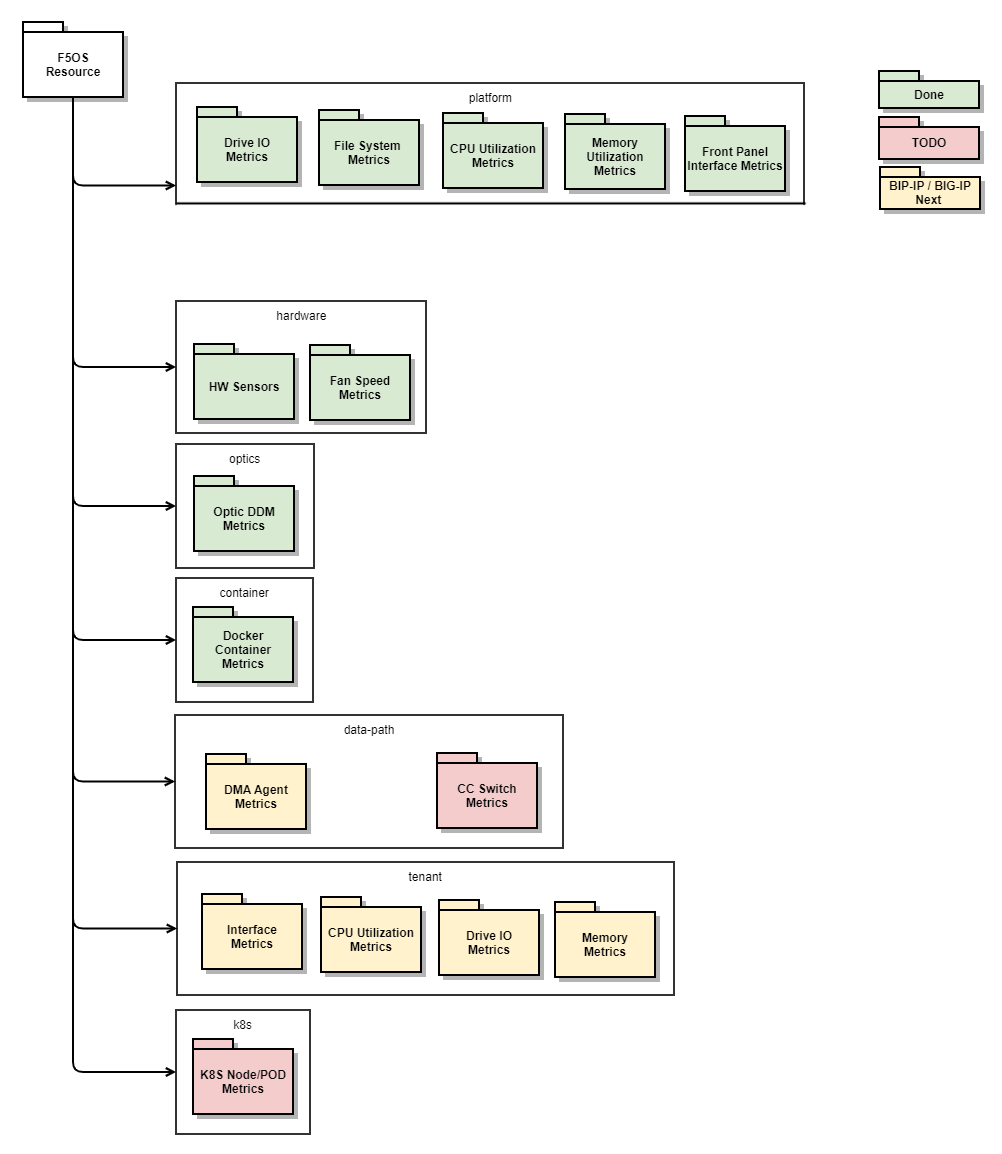
The table lists the set of attributes that can be applied to all metrics produced by the platform.
The scope indicates which product the attribute applies to:
- F5 - Applies to all metrics produced by F5
- F5OS - Applies to all metrics produced by the F5OS product
|
Name |
Value |
Type |
Scope |
Description |
|---|---|---|---|---|
|
|
string |
F5 |
The host-name for F5OS, derived from ConfD system hostname. |
|
|
string |
F5 |
A unique instance ID per product. |
|
|
string |
F5 |
A version string, which represents the version of the product. |
|
|
string |
F5 |
The high-level F5 product generating the metric/log: - F5OS
|
|
|
string |
F5OS |
The platform type. |
|
|
string |
F5OS |
Serial number of an appliance, blade, or controller. |
|
|
string |
F5OS |
The appliance is straight-forward. However, for chassis products, the telemetry data can originate from multiple places. The role can help identify a location. - Blade - The data originated from a blade within a partition
|
|
|
string |
F5OS |
The platform ID |
|
|
string |
F5OS |
The Platform Name - rSeries - The appliance products
|
|
|
string |
F5OS |
F5OS Instrument name associated with the metric. |
|
|
string |
F5 |
The attribute used by BIG-IP Central Manager to help direct F5OS specific metrics |
|
|
string |
F5OS |
The deployed tenant name |
The following attributes apply for the tenant based metrics.
|
Name |
Value |
Type |
Description |
|---|---|---|---|
|
|
string |
The name of the tenant which acts as a tenant ID |
|
|
string |
The tenant image version |
|
|
string |
The tenant type name |
Note: These metrics are relevant to Platforms.
|
Metric Name |
Metric Type |
Value Type |
Attributes |
Unit |
|---|---|---|---|---|
|
|
|
|
|
|
|
|
|
|
|
|
|
|
|
|
|
|
|
|
|
|
|
|
|
|
|
|
|
|
|
|
|
|
|
|
|
|
|
|
|
|
|
|
|
|
|
|
|
|
|
|
|
|
|
|
|
|
|
|
|
|
|
|
|
Reports the front-panel Optic DDM metrics.
Common Attributes include:
port.group=<string>
    -   The F5OS port group name associated with the Optic
-   ``` {#codeblock_cld_wtz_z1c}
 port.name="1.0"..
- The front-panel port number
channel=1..N
    -   For metrics which are per-channel, identifies the individual channel number
-   ``` {#codeblock_zkj_wtz_z1c}
direction="transmit" | "receive"
- An indication of transmit or receive direction
|
Metric Name |
Metric Type |
Value Type |
Attributes |
Unit |
|
|
|
|
|
|
|
|
|
|
|
|
|
|
|
|
|
|
|
|
|
|
|
| |
|
|
|
|
The schema of the CPU metrics is based on the OpenTelemetry semantic conventions. For more information, see Metrics Semantic Conventions
|
Metric Name |
Metric Type |
Value Type |
Attributes |
Unit |
|---|---|---|---|---|
|
|
|
|
|
|
|
|
|
|
The Disk IO Metrics are based on the OpenTelemetry semantic conventions. For more information, see Metrics Semantic Conventions
|
Metric Name |
Metric Type |
Value Type |
Attributes |
Unit |
|---|---|---|---|---|
|
|
|
|
|
|
|
|
|
|
|
|
|
|
|
|
|
|
|
|
|
|
|
|
|
|
|
|
|
|
|
|
|
|
|
|
|
|
|
|
|
|
|
|
|
|
|
|
|
|
The Memory Metrics are based on the OpenTelemetry semantic conventions. For more information, see Metrics Semantic Conventions
|
Metric Name |
Metric Type |
Value Type |
Attributes |
Unit |
|---|---|---|---|---|
|
|
|
|
|
|
|
|
|
|
|
|
|
|
|
|
|
|
|
|
The File system Metrics are based on the OpenTelemetry semantic conventions. For more information, see Metrics Semantic Conventions
|
Metric Name |
Metric Type |
Value Type |
Attributes |
Unit |
|---|---|---|---|---|
|
|
|
|
|
|
|
|
|
|
The Uptime Metrics are based on the OpenTelemetry semantic conventions. For more information, see Metrics Semantic Conventions
|
Metric Name |
Metric Type |
Value Type |
Attributes |
Unit |
|---|---|---|---|---|
|
|
|
|
The Raid Metrics are based on the OpenTelemetry semantic conventions. For more information, see Metrics Semantic Conventions
Note: Applicable for F5 r10000/12000 platforms with only two hard disks.
|
Metric Name |
Metric Type |
Value Type |
Attributes |
Unit |
|---|---|---|---|---|
|
|
|
|
|
|
|
|
|
|
|
system.raid.status |
|
|
state = “active” || “blocks-synced” |
{status} |
|
system.raid.sync.estimation |
|
|
Seconds | |
|
system.raid.sync.percent |
|
|
Percent | |
|
system.raid.sync.speed |
|
|
KbPerSecInterface Counter Metrics |
Summarizes the metrics that are associated with each tenant as they enters and exits the platform hardware at the DMA level.
Note: This metric is the sum of all internal tenant interfaces and independent of the F5 platform front-panel interface.
|
Metric Name |
Metric Type |
Value Type |
Attributes |
Unit |
|---|---|---|---|---|
|
|
|
|
|
|
|
|
|
|
The following tenant metrics are currently reported by the BIG-IP tenant into the F5OS platform layer. The metrics visible at the platform layer are only a limited subset of the total number of metrics available to the tenant. You can view the full tenant metrics by using the BIG-IP metric reporting capability.
This table lists the attributes that are associated with the tenant-based metrics.
|
Metric Name |
Metric Type |
Value Type |
Attributes |
Unit |
|---|---|---|---|---|
|
|
|
|
|
|
|
|
|
|
|
Metric Name |
Metric Type |
Value Type |
Attributes |
Unit |
|---|---|---|---|---|
|
|
|
|
|
|
|
|
|
|
|
Metric Name |
Metric Type |
Value Type |
Attributes |
Unit |
|---|---|---|---|---|
|
|
|
|
|
|
|
|
|
|
|
|
|
|
|
|
|
|
|
|
|
|
|
|
|
|
|
|
|
|
|
|
|
|
|
|
|
|
|
|
|
|
|
|
|
|
Metric Name |
Metric Type |
Value Type |
Attributes |
Unit |
|---|---|---|---|---|
|
|
|
|
|
|
|
|
|
|
|
|
|
|
|
|
|
|
|
|
F5OS OpenTelemetry exporter will only report the metrics that are associated with the Docker containers managed by the platform layer. For more information about the docker container metrics, see Docker stats documentation.
|
Attributes |
Metric value type |
Description |
|---|---|---|
|
|
The name of the container |
|
|
The container image name |
|
Metric Name |
Metric Type |
Value Type |
Attributes |
Unit |
|---|---|---|---|---|
|
|
|
| |
|
|
|
| |
|
|
|
| |
|
|
|
| |
|
|
|
|
|
|
|
|
|
|
|
|
|
|
|
The platform hardware sensors represent physical sensors associated with the hardware which measure: temperature, current, power, voltage, RPM and percent humidity.
f5.sensor.name=
    Eamples:

    -   Temperature:
        -   Inlet
        -   Outlet
        -   Central
    -   Voltage:
        -   12V
        -   3.3V BCM
    -   Current:
        -   12V Main
        -   Current In
    -   Power:
        -   Controller Power
        -   Total Power Supply Unit \(PSU\) Power In
        -   Total Power Supply Unit \(PSU\) Power Out
-   ``` {#codeblock_onv_mj1_1bc}
f5os.sensor.source=<component name>
Eamples:
- psu-\[1..N\]
- fantray-\[1..N\]
- psu-controller-\[1..N\]
- blade-\[1..N\]
- controller-\[1..2\]
- platform
|
Metric Name |
Metric Type |
Value Type |
Attributes |
Unit |
|---|---|---|---|---|
|
|
|
|
|
|
|
|
|
|
|
|
|
|
|
|
|
|
|
|
|
|
|
|
|
|
|
|
|
|
The metric schema is heavily dependent upon the internal representation of the tmstat tables within F5OS.
Note: When you select instrument type as “all” and/or “metrics”, the instrument type “tmstat” is set to off and cannot be selected. You have to manualy enable the instrument “tmstat”. Using this instrument is more tailored to internal F5 use cases, such as deep diagnostics.
|
Metric Name |
Metric Type |
Value Type |
Attributes |
Unit |
|---|---|---|---|---|
|
|
|
|
You can configure an exporter from the webUI.
-
Log in to the VELOS system controller webUI or the chassis partition webUI using an account with admin access.
-
On the left, clickSystem Monitoring > Telemetry.
The Telemetry screen displays.
-
Under the Telemetry exporters area, click Add.
The Add Exporter screen displays.
-
Enter Name of the Exporter (up to 20 characters).
The first character in the name cannot be a number. After that, only lowercase alphanumeric characters and hyphens are allowed.
-
For Endpoint
- For IP Address, enter the IPv4 address, IPv6 address, or Fully Qualified Domain Name (FQDN) for an exporter.
- For Port, enter the port number of the Server.
-
For Enable, select True if you want to enable and send the telemetry data to the exporter or False to disable it.
-
For Instruments, select one or more instruments for an exporter.
Following table lists the avaialble options:
Note: Note: “tenant” and “datapath” instruments are only supported on Chassis partition.
Option Description all All the logs and metrics produced by the F5OS platform layer except docker container metrics logs Reports all F5OS logs file through the OpenTelemetry ’ log’ API platform-log Exports the F5OS platform log through the OpenTelemetry ’ log’ API event-log Exports the F5OS confd event log through the OpenTelemetry ’ log’log’ API metrics All the F5OS metrics except docker container metrics platform F5OS platform metrics such as memory, disk, cpu, interface, and file system hardware F5OS hardware sensors such as voltage, current, temperature, power, fan-speeds optics F5OS front-panel Optic DDM metrics tenant Low level tenant reported metrics such as memory, disk, cpu, interface stats datapath F5OS data-path metrics such as those generated by the FPGA and DMA tmstat F5OS tmstat tables exported as metrics container F5OS Per-Container metrics such as cpu, block-io, network, memory -
For Compression, select the compression type. By default gzip will be selected.
-
For Attributes, specify the attributes for the exporter.
Click Add to inlclude an attribute. To delete an attribute, select the respective attribute and click the Delete button.
Attributes are reference data which can be associated with the exporter. Attributes can be specified in the key & value format.
-
For Secure input, select True to enable and configure the Transport Layer Security (TLS) to secure the connections. The default option is False.
Note: Before you can enable TLS encryption, you must configure a key and certificate on the system.
-
If you have selected True for secure connections, you can use one of these methods:
- Server Authentication only:
- For TLS CA Certificate, paste the contents of the certificate (self-signed or from a CA) for server TLS authentication.
- Both Server and Client Authentication
- For TLS CA Certificate, paste the contents of the certificate (self-signed or from a CA) for server TLS authentication.
- In the TLS Certificate field, paste the text of the local certificate for client TLS authentication.
- In the TLS Key field, paste the text of the private key for client TLS authentication.
- Server Authentication only:
-
-
For Reload Interval, specify the duration to reload the certificate within the specified timeframe.
Note: You can only specify the duration value in nanoseconds (ns), microseconds (us (or µs)), milliseconds (ms), seconds, minutes, and hours.
-
Click Save.
You can delete an exporter from the webUI.
-
Log in to the VELOS system controller webUI or the chassis partition webUI using an account with admin access.
-
On the left, click System Monitoring > Telemetry.
The Telemetry screen displays the existing exporter and associated details.
-
To delete an exporter, in the Telemetry exporters area, select the exporter from the list and then click Delete.
-
Click Save.
Attributes are reference data which can be associated with the exporter. Attributes can be specified in the key:value format. Spaces must be included between each entry. You can add attributes to all the configured exporters from the webUI.
-
Log in to the VELOS system controller webUI or the chassis partition webUI using an account with admin access.
-
On the left, click System Monitoring > Telemetry.
The Telemetry screen displays the existing exporter and associated details.
-
In the Telemetry Attributes section, click Add to add the attributes.
Select an attribute and click the Delete to delete it.
-
Click Save.
An instrument is an area of metrics, which contain multiple metrics and can be enabled selectively.
Before configuring an exporter, you can display supported instruments from the CLI.
-
Connect using SSH to the system controller floating management IP address or chassis partition management IP address.
-
Log in to the command line interface (CLI) of the system controller or chassis partition using an account with admin access.
When you log in to the system, you are in user (operational) mode.
-
Change to config mode.
configThe CLI prompt changes to include
(config). -
Show the total and available instruments:
show system telemetry instrumentsFollowing is an example for the instruments that are supported on System Controller:
syscon-2-active# show system telemetry instruments
NAME          DESCRIPTION
--------------------------------------------------------------------------------------------------------
all           Report all logs and metrics produced by the F5OS platform layer
logs          Report all F5OS logs file through the OpenTelemetry 'log' API
platform-log  Export the F5OS platform log through the OpenTelemetry 'log' API
event-log     Export the F5OS confd event log through the OpenTelemetry 'log' API
metrics       Report all F5OS metrics through the OpenTelemetry 'metric' API
platform      F5OS platform metrics such as: memory, disk, cpu, interface, and file system
hardware      F5OS hardware sensors such as: voltage, current, temperature, power, fan-speeds
optics        F5OS front-panel Optic DDM metrics
tmstat        F5OS tmstat tables exported as metrics
container     F5OS Per-Container metrics such as: cpu, block-io, network, memory
Following is an example for the instruments that are supported on Chassis Partition:
default-2# show system telemetry instruments
NAME          DESCRIPTION
--------------------------------------------------------------------------------------------------------
all           Report all logs and metrics produced by the F5OS platform layer
logs          Report all F5OS logs file through the OpenTelemetry 'log' API
platform-log  Export the F5OS platform log through the OpenTelemetry 'log' API
event-log     Export the F5OS confd event log through the OpenTelemetry 'log' API
metrics       Report all F5OS metrics through the OpenTelemetry 'metric' API
platform      F5OS platform metrics such as: memory, disk, cpu, interface, and file system
hardware      F5OS hardware sensors such as: voltage, current, temperature, power, fan-speeds
optics        F5OS front-panel Optic DDM metrics
tenant        Low level tenant reported metrics such as: memory, disk, cpu, interface stats
datapath      F5OS data-path metrics such as those generated by the FPGA and DMA
tmstat        F5OS tmstat tables exported as metrics
container     F5OS Per-Container metrics such as: cpu, block-io, network, memory
An exporter defines an OpenTelemetry gRPC endpoint to which the F5OS Platform will push metrics/logs.
You can configure the exporter from the CLI.
-
Connect using SSH to the system controller floating management IP address or chassis partition management IP address.
-
Log in to the command line interface (CLI) of the system controller or chassis partition using an account with admin access.
When you log in to the system, you are in user (operational) mode.
-
Change to config mode.
configThe CLI prompt changes to include
(config). -
Configure the exporter.
You must specify the IP address or DNS name of the server and the port number of the server on which OpenTelemetry (OTEL) is running
system telemetry exporters exporter <*server name*> config endpoint address <*address*> port <*port number*> instruments <*instrument name*> tls sercure { false | true }Following example displays the configuration for an exporter in the System Controller :
Following example displays the configuration for an exporter in the System Controller :


syscon-2-active(config)# system telemetry exporters exporter test config endpoint address 10.146.243.109 port 4317 instruments [ platform hardware ] tls secure false
Following example dispalys the configuration for an exporter in the Chassis Partition:
default-2# system telemetry exporters exporter test1 config endpoint address 10.144.74.171 port 4317 instruments [all] tls secure false -
Commit the configuration changes.
commit
An exporter defines an OpenTelemetry gRPC endpoint to which the F5OS Platform will push metrics/logs.
Note: To optimize performance, F5 recommends to configure minimum exporters, as they utilize system resources.
Note: You can enable Transport Layer Security (TLS) and secure the connections for telemetry streaming. Before you can enable TLS encryption, you must generate a private key and self-signed certificate.
You can configure the exporter from the CLI.
-
Connect using SSH to the system controller floating management IP address or chassis partition management IP address.
-
Log in to the command line interface (CLI) of the system controller or chassis partition using an account with admin access.
When you log in to the system, you are in user (operational) mode.
-
Change to config mode.
configThe CLI prompt changes to include
(config). -
Configure the exporter.
You must specify the IP address or DNS name of the server and the port number of the server on which OpenTelemetry (OTEL) is running
system telemetry exporters exporter <*server name*> config endpoint address <*address*> port <*port number*> instruments <*instrument name*> tls sercure { false | true }A summary similar to this example displays:
appliance-1(config)# system telemetry exporters exporter test1 config endpoint address 10.144.74.171 port 4317 instruments [all] tls secure true Possible completions: ca-certificate Specifies the CA Certificate content. certificate Specifies the PEM-encoded telemetry client certificate (Configure for mTLS). key Specifies the PEM-encoded telemetry client private key (Configure for mTLS) reload-interval Specifies reload-interval in duration strings. <cr> -
You can secure the connections by using one of these methods:
-
To authenticate the server, add the certificate:
system telemetry exporters exporter <*server name*> config ca-certificatePress Enter to enable multi-line mode and then paste the contents. Press Ctrl-D to exit multi-line mode.
system telemetry exporters exporter test1 config ca-certificate (<string>): [Multiline mode, exit with ctrl-D.] > ...Following example displays the configuration for an exporter with secure connection in the System Controller:syscon-2-active(config)# system telemetry exporters exporter test config endpoint address 10.146.243.109 port 4317 instruments [ platform hardware ]tls secure true ca-certificate Value for 'system telemetry exporters exporter test-tls config tls ca-certificate' (<string, min: 1 chars>): [Multiline mode, exit with ctrl-D.] > -----BEGIN CERTIFICATE----- > MIIFiTCCA3GgAwIBAgIJAOhKpL9Y2XI0MA0GCSqGSIb3DQEBCwUAMFsxCzAJBgNV > BAYTAklOMQswCQYDVQQIDAJUUzEMMAoGA1UEBwwDSHlkMQswCQYDVQQKDAJGNTER > MA8GA1UECwwIQVBJU1ZDR1cxETAPBgNVBAMMCE15Um9vdENBMB4XDTIzMTExMzA3 > MTgzOVoXDTI0MTExMjA3MTgzOVowWzELMAkGA1UEBhMCSU4xCzAJBgNVBAgMAlRT > MQwwCgYDVQQHDANIeWQxCzAJBgNVBAoMAkY1MREwDwYDVQQLDAhBUElTVkNHVzER > MA8GA1UEAwwITXlSb290Q0EwggIiMA0GCSqGSIb3DQEBAQUAA4ICDwAwggIKAoIC > AQDQ/BzhFOmjSQpi/IHCaD8lGB353a5Lbq42WRM37DJXbZ1aOL57JNEdenHmqi9C > 8KQSM5E4rtEvEnNL667JeYzXZA6W8Juf6fgMhjvPhK1knFB1Hs1wROgPVhv2Xd0Q > cVVHBE4CWCrazVD2dM/lRgCr/kxJVI+u5y16Kpe4c/0qoUetkcCEGnm04hC7N41O > 5UfbDGHFyqYNVU+f5EnCG0fV/LrWxqKGMSB8KUywAEJ32pteUxpsI5fq50XKPBkK > PFrSM2T4lipwt2A1bKOq+GU8J8YefEIQNBxznQdMHOntWyJ+9spxxa2MVco045kH > XVX6YpVe3OQ8Ogd41TgXHPLcCzCtSeblXn2OkxNB8LjcdGDtRTOEc+mvUIZrw5YZ > FxegJOsoOm1Ul7YLaIvT281dyueqaAxq85OB+SYlcVe7BiorjoiF44ABAkBcQYrf > /byNoQJ/y4pPjD0suKznyC0q+MZSjra7ezv8mquT/nRo5v0XwtlC1hLOxRr6ljqH > s/irTqqzosqF/PidfaWopninLEGtMm2w5J4nqZn2XzHfCXs8uFxNlfy3X79E497r > jP/MfbFzjfZuJI/PjFVSF4I9Jj9sNbOIY4YVeKU65vjDnADFu0wZ5GA2O964hhX/ > J24RqVLVnsieMvaW5cfIvMXSAIYU7h2hyny308JA72X44QIDAQABo1AwTjAdBgNV > HQ4EFgQU2tPO6b+uiyewldxz0htrBLy6hI4wHwYDVR0jBBgwFoAU2tPO6b+uiyew > ldxz0htrBLy6hI4wDAYDVR0TBAUwAwEB/zANBgkqhkiG9w0BAQsFAAOCAgEAsGsA > j9rqRoCbbbQfGcdcxhNbDv05kICCyVn51rwc7iHYmY5PHZbUuaTo4nfJF7yiAjtD > wqSdZf3iRMAipHMInjHsWi+Aiv6JGABUHexnN1QNY99fw1XuvevC7XFSzOXH5Vq4 > 0mn0s9LEk4gyGZm2WqEZ887sbe8xEM1yG5IQkt0N5Sfg6PADjPXc6IwPVAltvzVi > 1ZuoIUqrryQsT1KlaWgZW5zx+N9oWgeE934zC3JpxnbHKZduCsPhIiwc/MQRdLFD > ElXzaAVLM3qFsPu9UMynT1IdbN1Z2dtCiwDxP+gvUflnENRFISBuYG0WA+D/7p2I > OkV7WeCs5AVeRrgnCNYDdxqPaRDoSfxKfNOMaXWV4519nW1DdfonDVnw0dITB0wG > 7ur/2Y2QfmAKjCoCI/gtDls60L8sNVpZgXVhkDjbYVELQN7uYSuMFYmZAeKDuXyH > 7hq+3oa+B3Nr9+h8A8fg3tIjeH6B/A0vz8zyBhtFctesmOV10TBZ6eCG+h+VvxPk > S65kZxcp+KuR41esUYjbTbnN58QqUDMfDWb7nbYRr9sxBcktfxSDnUzLzhGfvnDa > EF1MDwL8ivR1Fzh1B0YaMU7CNsDba7B3QgG08hrG18SiAFVuW/dcLnyIx9YHaPox > +1efl7PuS/ILKF78pMnHur+xpt5oQmHf1erqqBE= > -----END CERTIFICATE----- > -
To authenticate the server and client, add the certificates and key.
system telemetry exporters exporter <*server name*> config tls certificatePress Enter to enable multi-line mode and then paste the contents. Press Ctrl-D to exit multi-line mode.
system telemetry exporters exporter server1 config tls certificate (<string>): [Multiline mode, exit with ctrl-D.] > ... appliance-1(config-exporter-test)# config tls key (<string>): [Multiline mode, exit with ctrl-D.] > appliance-1(config-exporter-test)# config tls certificate (<string>): [Multiline mode, exit with ctrl-D.] >Following example displays the configuration for an exporter with secure connection in the System Controller :
syscon-2-active(config)# system telemetry exporters exporter test-mtls config endpoint address 10.238.678.16 port 4315 instruments [ all ] tls secure true
Value for 'system telemetry exporters exporter test-mtls config tls ca-certificate' (<string, min: 1 chars>):
[Multiline mode, exit with ctrl-D.]
> -----BEGIN CERTIFICATE-----
> MIIFiTCCA3GgAwIBAgIJAOhKpL9Y2XI0MA0GCSqGSIb3DQEBCwUAMFsxCzAJBgNV
> BAYTAklOMQswCQYDVQQIDAJUUzEMMAoGA1UEBwwDSHlkMQswCQYDVQQKDAJGNTER
> MA8GA1UECwwIQVBJU1ZDR1cxETAPBgNVBAMMCE15Um9vdENBMB4XDTIzMTExMzA3
> MTgzOVoXDTI0MTExMjA3MTgzOVowWzELMAkGA1UEBhMCSU4xCzAJBgNVBAgMAlRT
> MQwwCgYDVQQHDANIeWQxCzAJBgNVBAoMAkY1MREwDwYDVQQLDAhBUElTVkNHVzER
> MA8GA1UEAwwITXlSb290Q0EwggIiMA0GCSqGSIb3DQEBAQUAA4ICDwAwggIKAoIC
> AQDQ/BzhFOmjSQpi/IHCaD8lGB353a5Lbq42WRM37DJXbZ1aOL57JNEdenHmqi9C
> 8KQSM5E4rtEvEnNL667JeYzXZA6W8Juf6fgMhjvPhK1knFB1Hs1wROgPVhv2Xd0Q
> cVVHBE4CWCrazVD2dM/lRgCr/kxJVI+u5y16Kpe4c/0qoUetkcCEGnm04hC7N41O
> 5UfbDGHFyqYNVU+f5EnCG0fV/LrWxqKGMSB8KUywAEJ32pteUxpsI5fq50XKPBkK
> PFrSM2T4lipwt2A1bKOq+GU8J8YefEIQNBxznQdMHOntWyJ+9spxxa2MVco045kH
> XVX6YpVe3OQ8Ogd41TgXHPLcCzCtSeblXn2OkxNB8LjcdGDtRTOEc+mvUIZrw5YZ
> FxegJOsoOm1Ul7YLaIvT281dyueqaAxq85OB+SYlcVe7BiorjoiF44ABAkBcQYrf
> /byNoQJ/y4pPjD0suKznyC0q+MZSjra7ezv8mquT/nRo5v0XwtlC1hLOxRr6ljqH
> s/irTqqzosqF/PidfaWopninLEGtMm2w5J4nqZn2XzHfCXs8uFxNlfy3X79E497r
> jP/MfbFzjfZuJI/PjFVSF4I9Jj9sNbOIY4YVeKU65vjDnADFu0wZ5GA2O964hhX/
> J24RqVLVnsieMvaW5cfIvMXSAIYU7h2hyny308JA72X44QIDAQABo1AwTjAdBgNV
> HQ4EFgQU2tPO6b+uiyewldxz0htrBLy6hI4wHwYDVR0jBBgwFoAU2tPO6b+uiyew
> ldxz0htrBLy6hI4wDAYDVR0TBAUwAwEB/zANBgkqhkiG9w0BAQsFAAOCAgEAsGsA
> j9rqRoCbbbQfGcdcxhNbDv05kICCyVn51rwc7iHYmY5PHZbUuaTo4nfJF7yiAjtD
> wqSdZf3iRMAipHMInjHsWi+Aiv6JGABUHexnN1QNY99fw1XuvevC7XFSzOXH5Vq4
> 0mn0s9LEk4gyGZm2WqEZ887sbe8xEM1yG5IQkt0N5Sfg6PADjPXc6IwPVAltvzVi
> 1ZuoIUqrryQsT1KlaWgZW5zx+N9oWgeE934zC3JpxnbHKZduCsPhIiwc/MQRdLFD
> ElXzaAVLM3qFsPu9UMynT1IdbN1Z2dtCiwDxP+gvUflnENRFISBuYG0WA+D/7p2I
> OkV7WeCs5AVeRrgnCNYDdxqPaRDoSfxKfNOMaXWV4519nW1DdfonDVnw0dITB0wG
> 7ur/2Y2QfmAKjCoCI/gtDls60L8sNVpZgXVhkDjbYVELQN7uYSuMFYmZAeKDuXyH
> 7hq+3oa+B3Nr9+h8A8fg3tIjeH6B/A0vz8zyBhtFctesmOV10TBZ6eCG+h+VvxPk
> S65kZxcp+KuR41esUYjbTbnN58QqUDMfDWb7nbYRr9sxBcktfxSDnUzLzhGfvnDa
> EF1MDwL8ivR1Fzh1B0YaMU7CNsDba7B3QgG08hrG18SiAFVuW/dcLnyIx9YHaPox
> +1efl7PuS/ILKF78pMnHur+xpt5oQmHf1erqqBE=
> -----END CERTIFICATE-----
>
syscon-2-active(config-exporter-test-mtls)# config tls key
(<AES encrypted string>):
[Multiline mode, exit with ctrl-D.]
> *******************************
> ****************************************************************
> ****************************************************************
> ****************************************************************
> ****************************************************************
> ****************************************************************
> ****************************************************************
> ****************************************************************
> ****************************************************************
> ****************************************************************
> ****************************************************************
> ****************************************************************
> ****************************************************************
> ****************************************************************
> ****************************************************************
> ****************************************************************
> ****************************************************************
> ****************************************************************
> ****************************************************************
> ****************************************************************
> ****************************************************************
> ****************************************************************
> ****************************************************************
> ****************************************************************
> ****************************************************************
> ****************************************************************
> ****************************************************************
> ****************************************************************
> ****************************************************************
> ****************************************************************
> ****************************************************************
> ****************************************************************
> ****************************************************************
> ****************************************************************
> ****************************************************************
> ****************************************************************
> ****************************************************************
> ****************************************************************
> ****************************************************************
> ****************************************************************
> ****************************************************************
> ****************************************************************
> ****************************************************************
> ****************************************************************
> ****************************************************************
> ****************************************************************
> ****************************************************************
> ****************************************************************
> ****************************************************************
> ************************************************************
> *****************************
>
syscon-2-active(config-exporter-test-mtls)# config tls certificate
(<string>):
[Multiline mode, exit with ctrl-D.]
> -----BEGIN CERTIFICATE-----
> MIIFSTCCAzGgAwIBAgIBATANBgkqhkiG9w0BAQsFADBbMQswCQYDVQQGEwJJTjEL
> MAkGA1UECAwCVFMxDDAKBgNVBAcMA0h5ZDELMAkGA1UECgwCRjUxETAPBgNVBAsM
> CEFQSVNWQ0dXMREwDwYDVQQDDAhNeVJvb3RDQTAeFw0yMzExMTMwODE4MDFaFw0y
> NDExMTIwODE4MDFaMGAxCzAJBgNVBAYTAklOMQswCQYDVQQIDAJUUzEMMAoGA1UE
> BwwDSHlkMQswCQYDVQQKDAJGNTERMA8GA1UECwwIQVBJU1ZDR1cxFjAUBgNVBAMM
> DTEwLjE0NC43NC4xNzEwggIiMA0GCSqGSIb3DQEBAQUAA4ICDwAwggIKAoICAQDI
> HecdJvgITByPhLgtp8duUd0slfWABZYcRjpeLQj2FN7lPXMeKsuJn55zOSS9l/qv
> uOij7+FYj7asMLVfKBOZlLtR0AFEFSChM+bR48mTGMLpTo0pqEzod0KlxPt7P1bp
> DNkkfNlZZfIBFUvuDKgO4/ao45YEwD0DdXrswsnEh25e+NRLaPlmFbMRNhvfZKk6
> xkWW9Gd4int3EaXruHCc9FeMZAEyDelGxd5QlXU5VE9q3sJh6yHe0zssIAGatggR
> HzdxFxYwJsdDGedl1K9Z7v4zz7YG+3ziqZOdYtX+RXb/kJtTF1Xwk3gt6ZDH2BaU
> sDAZHHr87oei1qmISCaM2WMgHVo4XX2/R7dKLYvm/od91Fm1DLmpjNaHhWcNLbzH
> HdLbNwtlSPX7+6kBQbFTllyLcvmP6J2JTA+hVWkUNo6Ta82YAi2vW2bMKKkruNnt
> 8XCsi23Yvh9EyiBWTGanaiVbA7FDs2fw9FRHeKqpN21cb5w29zacwJnHGjkwi/uI
> tUVjHDdUOCvawJbAsDj3oGkwSzHElUg6WsiQ/lY9ZdjoumHRbeY19RfXt33gfwgr
> Nx/J/VVTbrR94Ysk6+NMW5M4M6EzktR3ikdnY3BoHCWIrE11eFWGwmTtQM5BxkbX
> zKPP9kc6rD9eNbvnxa8ZihVdsFHjh45LnXApDAHRDQIDAQABoxMwETAPBgNVHREE
> CDAGhwQKkEqrMA0GCSqGSIb3DQEBCwUAA4ICAQCL4WPnxZxkHQmWixwESO+r15hl
> Stys4rwY7okRk9jLu90pV+TumO+/oWS+/ZbsKr0gbnGuvKiCZbsjzS9FHdBCDJTI
> ZMbj2FLU4vwQZdaNRmmHJ8PjGVDrk5flAvM6mOBarZTuyElE8vAMlekjwcBwdEn3
> 9Cyh10V+4U6C/6yJPdImsG2VCBN4UtiiROoUqBVFOZ8Us9tYjDtg7e85ZBtzNthK
> 4rZ7cEbYMkYdQogC4J2LKGi+EDFEW7qbG1USArOo3mC2p4cAMTIhk5mfWPbyH8Ka
> apOQU9o3/TrWCGMnSTYkrTV7IAtkjqEnlJzclMa1p4slYPVYgfsRS4JMtjnTxVtd
> 9QoeNjlm81jqtUdxZLNTPJlLW6+tsonK12fkBFpiYHlFXR80VmVJ/llzjhSV8M7h
> phB1mzgVuhRSwEV7ZKtltYEvuXXnoI53AOJ8uZfK+a3OKTD/LNzfeKIDT9iYUznR
> K118PFLjRns25+ZsMsf+l72c9rvu4hpywnnTPp/1xT1OjfBh1Df66VNLjssg00d5
> cNqwtS3wQkTvrNk1ivSUr0fnq6EAtK5HALVs7+USXiHtfV7H1rqN8f6cMSdVGcHl
> GIuN7GXyY+Kclg+uFcRHTFGryESl1YhTV0LRdSBrR4Im1kPcuxqhOu65104jIlx7
> 9P1GdQ6vjkCt8i0hXQ==
> -----END CERTIFICATE-----
>
-
-
Commit the configuration changes.
commit
After you configure the exporter, you can display the state of the exporter from the CLI.
-
Connect using SSH to the system controller floating management IP address or chassis partition management IP address.
-
Log in to the command line interface (CLI) of the system controller or chassis partition using an account with admin access.
When you log in to the system, you are in user (operational) mode.
-
Display the state of a specific exporter
show system telemetry exporters exporter <*server name*>Following example displays the state of an exporter with secure connection enabled in system controller for both server and client:
syscon-2-active# show system telemetry exporters exporter test-mtls
system telemetry exporters exporter test-mtls
state enabled
state endpoint address 10.238.678.16
state endpoint port 4315
state instruments [ all ]
state tls secure true
state tls certificat
 "-----BEGIN CERTIFICATE-----\nMIIFSTCCAzGgAwIBAgIBATANBgkqhkiG9w0BAQsFADBbMQswCQYDVQQGEwJJTjEL\nMAkGA1UECAwCVFMxDDAKBgNVBAcMA0h5ZDELMAkGA1UECgwCRjUxETAPBgNVBAsM\nCEFQSVNWQ0dXMREwDwYDVQQDDAhNeVJvb3RDQTAeFw0yMzExMTMwODE4MDFaFw0y\nNDExMTIwODE4MDFaMGAxCzAJBgNVBAYTAklOMQswCQYDVQQIDAJUUzEMMAoGA1UE\nBwwDSHlkMQswCQYDVQQKDAJGNTERMA8GA1UECwwIQVBJU1ZDR1cxFjAUBgNVBAMM\nDTEwLjE0NC43NC4xNzEwggIiMA0GCSqGSIb3DQEBAQUAA4ICDwAwggIKAoICAQDI\nHecdJvgITByPhLgtp8duUd0slfWABZYcRjpeLQj2FN7lPXMeKsuJn55zOSS9l/qv\nuOij7+FYj7asMLVfKBOZlLtR0AFEFSChM+bR48mTGMLpTo0pqEzod0KlxPt7P1bp\nDNkkfNlZZfIBFUvuDKgO4/ao45YEwD0DdXrswsnEh25e+NRLaPlmFbMRNhvfZKk6\nxkWW9Gd4int3EaXruHCc9FeMZAEyDelGxd5QlXU5VE9q3sJh6yHe0zssIAGatggR\nHzdxFxYwJsdDGedl1K9Z7v4zz7YG+3ziqZOdYtX+RXb/kJtTF1Xwk3gt6ZDH2BaU\nsDAZHHr87oei1qmISCaM2WMgHVo4XX2/R7dKLYvm/od91Fm1DLmpjNaHhWcNLbzH\nHdLbNwtlSPX7+6kBQbFTllyLcvmP6J2JTA+hVWkUNo6Ta82YAi2vW2bMKKkruNnt\n8XCsi23Yvh9EyiBWTGanaiVbA7FDs2fw9FRHeKqpN21cb5w29zacwJnHGjkwi/uI\ntUVjHDdUOCvawJbAsDj3oGkwSzHElUg6WsiQ/lY9ZdjoumHRbeY19RfXt33gfwgr\nNx/J/VVTbrR94Ysk6+NMW5M4M6EzktR3ikdnY3BoHCWIrE11eFWGwmTtQM5BxkbX\nzKPP9kc6rD9eNbvnxa8ZihVdsFHjh45LnXApDAHRDQIDAQABoxMwETAPBgNVHREE\nCDAGhwQKkEqrMA0GCSqGSIb3DQEBCwUAA4ICAQCL4WPnxZxkHQmWixwESO+r15hl\nStys4rwY7okRk9jLu90pV+TumO+/oWS+/ZbsKr0gbnGuvKiCZbsjzS9FHdBCDJTI\nZMbj2FLU4vwQZdaNRmmHJ8PjGVDrk5flAvM6mOBarZTuyElE8vAMlekjwcBwdEn3\n9Cyh10V+4U6C/6yJPdImsG2VCBN4UtiiROoUqBVFOZ8Us9tYjDtg7e85ZBtzNthK\n4rZ7cEbYMkYdQogC4J2LKGi+EDFEW7qbG1USArOo3mC2p4cAMTIhk5mfWPbyH8Ka\napOQU9o3/TrWCGMnSTYkrTV7IAtkjqEnlJzclMa1p4slYPVYgfsRS4JMtjnTxVtd\n9QoeNjlm81jqtUdxZLNTPJlLW6+tsonK12fkBFpiYHlFXR80VmVJ/llzjhSV8M7h\nphB1mzgVuhRSwEV7ZKtltYEvuXXnoI53AOJ8uZfK+a3OKTD/LNzfeKIDT9iYUznR\nK118PFLjRns25+ZsMsf+l72c9rvu4hpywnnTPp/1xT1OjfBh1Df66VNLjssg00d5\ncNqwtS3wQkTvrNk1ivSUr0fnq6EAtK5HALVs7+USXiHtfV7H1rqN8f6cMSdVGcHl\nGIuN7GXyY+Kclg+uFcRHTFGryESl1YhTV0LRdSBrR4Im1kPcuxqhOu65104jIlx7\n9P1GdQ6vjkCt8i0hXQ==\n-----END CERTIFICATE-----\n"
state tls key  "$8$j6uZb0TF3fbN/hX/iayVBUJLDpyz1LJE3w2DkQXEB6BkBAi3PCWNLUAaQIopIND0EAdrN/Pq\nq/Exkmmv4NUt+pvhTtyYnZ03dFXGxdI3wOS3ctjLXkYeIaxatjhq/6ns/S/bKWSNgeMIt0CY\nUzxfp8dsV8a6JG/OoCZ2JsNlsYVzJ1fSQnTKTRcUtSrEfBdJn82Kr3wdx7lWInpyJWMNLNHs\nT4x0qv1Fm+mzW5q5/iZu/e/4F6c5WgCIpD6im0npfSYaQxH2gtjN9Xfpm+QK8WFxZJ3B1KxC\napu1oE9uUz1/8TWjfYPjeotvTcuxRz9j7aDyM6a9ONBesnA8Ngr4JiWvex1p0ctBK98DgXrz\nseahjyE4czwcIl6/WMUM6NuP38RG7BitFAt+c8Tf0C/tCzj1urZCwxMkg0+Vu6pzoZXTUMVv\ny+lbTzvnQpG90oR/LR4SbJI1RJ8w3v8lgrOT9EDCq847CD+ebqv9ONIZF74cH7z6eeTQPZmo\nw9bH0tGlbT0RrKWghGxB4NZGV5ivMJJTDGkCaIEXuw8GCo70uSXX9tn9VNiXz2LObTHBuRnp\n4F1F4Z7ESw7V/Mru1vJh3rb1v7fd7VHccvvQokWCL8Zg3DpC3x07hEMh4OzX09eY/PTRdceE\nBP+rUAt6aX4lVf24a/osFFEiApUceOBntHhZsxvnpwbwImC1Q6zyu4atVOaZtMwPDD1CdX6b\naOI/ZFNrG25jqpicIqO3sON64BOg+y6iWnfsiiOQZZ17+qcv4hsoR0hnjBJiNjeKqsxgrJA1\nhY4OHCNPVaK5jGEa+zBJJzYXrgYZFsqR5vgOGnCSFdLxtBckJ+H8O8V/v2Des96XwMkv2Fss\nxiCTUqbRrm1viquRtaVW9uygVc1MG1qSMv/YC7dun/X2Qx9RyBeM/SYjCsAYyp4zd4qeAcNp\n0MBAjgCdfL6+qxM6xtDnEXbFQO01JN6qMAMtcmwjQjO78qOjtxWwMJFPEa6ntEJRkeGeSqmn\np/QE9VbV+kB7W6Jj7DvmmWuqqQx1qX3EQBKKEx3pGpWTYpVA56Skki3UwygTbfYPQtRb3las\n6/NSHEtmT84EBhzraPk2N4E2Qj8O48U8IttKBAEd7vz7KMMPbDNvLu7pOOAgdNpuW8H4of3X\nn2TSiE2CseXAujlI9Hp7ag8YEM+1exxsXwz2Ft4oKMqE5/vjOd+MZfdm6DQP8Yv0h+bRUX+X\niUwkV3sO0zGX2cmw9vnMy9tVQXo7lZd2d+XVXZIFhhvo5L3OL0U+9TeOy4qbwEhfGWqoA8/l\ncsDJVZmjhVpXzj+gb1igSwx2YvmlSpZBTeJlFUGgJlUnGyDBXIebiPbb4GFTM19JKpRIJrrp\n2Bt93vlYczY3eD9KEN4TrxBz/mTD0pQIALopqf3FDP3/6sa6lcs9JWv5beTO4KkyfySiBC+m\n1J3zwoISPBPYWjxVclthLaZqY61AhL4yNVhjmE16G8XR1xXHn8BFD4wXlj82LndpQhSKxMpc\nDPzGHHs83I5K30/BbrAHwht0Z2q4IWhCRnXVWC5Vn/9E+3omophSL05/SPpj9I9D3a7/bWYm\nuFHfrG9omjRPgnkdUAED8keW1SRm0Z9k1Rz8862zhhMWE6Bj6kA1j1unmv+jXuWYboxEhOLI\narDCmWejfiZfM1wqNeJiUiwFpmBLFM3tiDqSB6tedPdoIwQi2VEvnQBpB4mj5xui6cgjeDWs\nWXkOlqEpVhg4/5G5LwcHpQPG993YlCfRk2qo52xFE+BagN/hpUm3MIYB8prDojnVvWm2YmQr\nJJdL2KmCoxC9NpMeomYNcYGjNYSyDTFriLZMUXz3xRG7DZhG4Q6NtWlyDZAUwILuoJ9f9MHs\ntJ6fnyIMhmdGgGRapHPYeZ1ll/pjpCnG5dMCoZjDkOLqJHLrh+QqAIWeTG2ZRlkXmQ1DXL0v\nPLTaqauOXGpg09mrleZgSlqpoDQof/+QQ4/QDmAz6Itxi7m20ngmhmnAq7lxAryBdeP2f+WG\nV73SjQO/5Xs9khc7QfYxD4D1tTYNJhfqNjHG3pv1AxOxzpHFFxfuvNhk5CRqiH+jWNiL8lpj\nxM7dldtzfw9fGgZeG0vtI25AnT8dVpFZYYwr23Rij0LmagspC0KWyS7vPiMnZ2znD791SozF\nfEJUGUGKYhkxLpaHV9X5IdZt7XJ54J1e4091cudQ1U6PzV7ypurEaw5DaerrZ++jC5bc8Kgl\nuEw73TUp7yrIJDWcPXjh/VSPlB11mcVc+YoPAyFIqpVcZSklllZynSEg+SAhVpr99OFM0i9F\n0EEIzExiDyJnc+iPRaJkOJhyN66F4psEXWbVASRUD4PqNPtHpJyX/1P/xjvK3YAnQeMCvDJ/\nvknR8N54XPCGH38fBXJbVEaK+yQgPbBAZHkNM7cZBxmjoZJ1694/eGAcsDLm3Gs/kDn7UxgF\nw69Qiff6Jgq4OMIPwqDlJHrB9fRQixYmFw4q2bhtgccUWUj/MLj2UECVGMD7/wubz6ovpf4r\nYtYz68wJx/AegWYw1AkMIa1VBOeUXXGCHXXfsJe4CPNZkOUb7de0ZgqgTtGpckDUvrlxvoFT\nzKKMBGZcbsVf7dkNPVF/htT3vkD/t1zf81nxuJFL0Ku9Jmws/u63sVHqr1iu26oInaQpXOoz\nDcfu6f5c22sZLoq8XTfi3zoIEZiFtpua+KEZAe5LbdsdGXL+yIiz6Ysp1PS28kvXgSgeDlxN\nTxC0diBKoaBSP0Gkcp/vGYI2gXJdLu3xT7OuLPLC6B9PQ1A2PVzVRCKU0vUGwrB8/SMNUWYv\nogyoFOXJ2xwig5u8xQKJAv9EtQuDi1XSjigEU4OlNjJGOfdk0ZJ32tBhDf/ghc1QKCD3/lpR\nJ41RMlcWcGVfqLqN/So/RADCSgiz3MI6kBavJXGnQOfDmtIQ1vTNcsULgpd4X/owoDAKVTJV\n8RCGsVmn4SQHxyRSl1m4c3tzYY9+LhRkC6XfglH9nSKZhP7mrq/tdmM/7/Vu/Zz8XTsBAhVz\npFc/JIP1LHlZOEbEkBF79rWaPly3EXHEQ/7XXgiLVqo+nFp+I8oQwb1dxIKsKT3JFBN9G/81\nBUppiTmXDivFefkzZyWRRws7LQkN7dgMysEerzXM6tIVhtpu28xqkb0WaClQQXi193MA/SNX\n8xq02KH7DWmpY95bZ/EVD9uog8q/HSR7Y9SlJKuUL/qPPk1Rq5vMVr1njmJhtXmpb8rLWs8w\nYa0dCPMebiRacF1ikyDjasnax9ZOsGRaDPuWe/5QNxMVjAJRA0GWbrX7O72UlnMpfANOvT0C\nV8K35H2/BIgJYgr/kLn6Ye2+oT6evXiJw4m3ors2KrCnxb+3sPExWKHmzm5vvN5I8E1mYoyo\nWQoXxu63J+ZkuylD13/Gh2ynOFNATnnxeBSVpi3SIc+hFI5dqSSHCOJ/6iYDkjYJoZnbk6SC\nlWnsB3ZzMIIOYL36+l4XckoCju60aRnZGGnyf0VjVaHPOUsYcFJu1gCGn3BWv0K/LlpiSCrs\n2bgPG4ZH3lSTWvyWfISHDru/u2i2qUr2cw5Z9BfJg2rsbjbjOcxe4pAc5c2DgzhBkF415lic\nFMiX8xhV0ADRiNsaRN/xjHYJe/k8hhQ98TixZy/EZdsWtHsLamg7ODXMGZAzNA43MI0xCJTf\n0qrf8Lfof34d1g7aiqF9VxV7Gb2jYZ6qVR8pJfRG8CkI28m+HVW2r+qQC+18Q0CaLKgvQgsg\nioAGvlM18eI+cWe8xmZEBLTzOyOWXonM3RDXZPTWSkhLA4F9tuwPcrxLrdrykPQMx0Fp6vji\nln3Dm9GwlztImHkkmnYDfmOPe0+W4AAJOYcl6v200gpY26iAjtFSP9As9FYc+e0H1/bW8KE2\noTXSRkvhy/dCvijJAZMxrawHCZK378kx/kU/RqnsNr4EBoXnf25Kjo+Z4Xz3J7jqgH4PU/pe\nSfk77/dgMZp15Bq8J+a0Uft0OP9j7baG/l9TclLytmoO03C4Cr8i/qfX1HUxsnf17pArYiyU\n+y1XMxAmfVjbj8gGOyrsitjqgX4MHDautext7gwzB+kFzH8ZFwsqGpxX62SNe8uwONtKVrPM\n5sjNDzLXaDXzJ0XiZU027VZNfJ23wV5GwIew/Q/EzIIhujU8tz0ndZBYbQObPHcXGwPMM731\n8cH4iSA7ZU17rUnFihB8Btsdr+6lxj7X2gykVVsZJ9wRDflkK9I9f79c0Wsfe5rMCckSNkjI\ncoaET2QJCe35Gmy57SgwQIQJH1NAi9+BUeP6ii2z5OMkVp+p9xXjjvvrRCtLrO3ZCpPPh6lN\ncj1q/npvZJldbe4eet/wtplOdd9vzDxN"
state tls ca-certificate
"-----BEGIN CERTIFICATE-----\nMIIFiTCCA3GgAwIBAgIJAOhKpL9Y2XI0MA0GCSqGSIb3DQEBCwUAMFsxCzAJBgNV\nBAYTAklOMQswCQYDVQQIDAJUUzEMMAoGA1UEBwwDSHlkMQswCQYDVQQKDAJGNTER\nMA8GA1UECwwIQVBJU1ZDR1cxETAPBgNVBAMMCE15Um9vdENBMB4XDTIzMTExMzA3\nMTgzOVoXDTI0MTExMjA3MTgzOVowWzELMAkGA1UEBhMCSU4xCzAJBgNVBAgMAlRT\nMQwwCgYDVQQHDANIeWQxCzAJBgNVBAoMAkY1MREwDwYDVQQLDAhBUElTVkNHVzER\nMA8GA1UEAwwITXlSb290Q0EwggIiMA0GCSqGSIb3DQEBAQUAA4ICDwAwggIKAoIC\nAQDQ/BzhFOmjSQpi/IHCaD8lGB353a5Lbq42WRM37DJXbZ1aOL57JNEdenHmqi9C\n8KQSM5E4rtEvEnNL667JeYzXZA6W8Juf6fgMhjvPhK1knFB1Hs1wROgPVhv2Xd0Q\ncVVHBE4CWCrazVD2dM/lRgCr/kxJVI+u5y16Kpe4c/0qoUetkcCEGnm04hC7N41O\n5UfbDGHFyqYNVU+f5EnCG0fV/LrWxqKGMSB8KUywAEJ32pteUxpsI5fq50XKPBkK\nPFrSM2T4lipwt2A1bKOq+GU8J8YefEIQNBxznQdMHOntWyJ+9spxxa2MVco045kH\nXVX6YpVe3OQ8Ogd41TgXHPLcCzCtSeblXn2OkxNB8LjcdGDtRTOEc+mvUIZrw5YZ\nFxegJOsoOm1Ul7YLaIvT281dyueqaAxq85OB+SYlcVe7BiorjoiF44ABAkBcQYrf\n/byNoQJ/y4pPjD0suKznyC0q+MZSjra7ezv8mquT/nRo5v0XwtlC1hLOxRr6ljqH\ns/irTqqzosqF/PidfaWopninLEGtMm2w5J4nqZn2XzHfCXs8uFxNlfy3X79E497r\njP/MfbFzjfZuJI/PjFVSF4I9Jj9sNbOIY4YVeKU65vjDnADFu0wZ5GA2O964hhX/\nJ24RqVLVnsieMvaW5cfIvMXSAIYU7h2hyny308JA72X44QIDAQABo1AwTjAdBgNV\nHQ4EFgQU2tPO6b+uiyewldxz0htrBLy6hI4wHwYDVR0jBBgwFoAU2tPO6b+uiyew\nldxz0htrBLy6hI4wDAYDVR0TBAUwAwEB/zANBgkqhkiG9w0BAQsFAAOCAgEAsGsA\nj9rqRoCbbbQfGcdcxhNbDv05kICCyVn51rwc7iHYmY5PHZbUuaTo4nfJF7yiAjtD\nwqSdZf3iRMAipHMInjHsWi+Aiv6JGABUHexnN1QNY99fw1XuvevC7XFSzOXH5Vq4\n0mn0s9LEk4gyGZm2WqEZ887sbe8xEM1yG5IQkt0N5Sfg6PADjPXc6IwPVAltvzVi\n1ZuoIUqrryQsT1KlaWgZW5zx+N9oWgeE934zC3JpxnbHKZduCsPhIiwc/MQRdLFD\nElXzaAVLM3qFsPu9UMynT1IdbN1Z2dtCiwDxP+gvUflnENRFISBuYG0WA+D/7p2I\nOkV7WeCs5AVeRrgnCNYDdxqPaRDoSfxKfNOMaXWV4519nW1DdfonDVnw0dITB0wG\n7ur/2Y2QfmAKjCoCI/gtDls60L8sNVpZgXVhkDjbYVELQN7uYSuMFYmZAeKDuXyH\n7hq+3oa+B3Nr9+h8A8fg3tIjeH6B/A0vz8zyBhtFctesmOV10TBZ6eCG+h+VvxPk\nS65kZxcp+KuR41esUYjbTbnN58QqUDMfDWb7nbYRr9sxBcktfxSDnUzLzhGfvnDa\nEF1MDwL8ivR1Fzh1B0YaMU7CNsDba7B3QgG08hrG18SiAFVuW/dcLnyIx9YHaPox\n+1efl7PuS/ILKF78pMnHur+xpt5oQmHf1erqqBE=\n-----END CERTIFICATE-----\n"
state options compression gzip
You can modify the configuration of an exporter from the CLI.
-
Connect using SSH to the system controller floating management IP address or chassis partition management IP address.
-
Log in to the command line interface (CLI) of the system controller or chassis partition using an account with admin access.
When you log in to the system, you are in user (operational) mode.
-
Change to config mode.
configThe CLI prompt changes to include
(config). -
You can use the following commands to modify the exporter configuration:
-
Disable the exporter
system telemetry exporters exporter <*server name*> config disabledWhen you specify an exporter, a summary to this example displays:
syscon-2-active(config)# system telemetry exporters exporter server1 config disabled -
Modify option compression
system telemetry exporters exporter server1 config options compression <*new value*>A summary to this example displays:
syscon-2-active(config)# system telemetry exporters exporter server1 config options compression zstd
-
-
Commit the configuration changes.
commit -
Return to user (operational) mode.
end -
You can verify the state of the exporter. see Display exporter state from the CLI.
You can add attributes to all the configured exporters from the CLI
-
Log in to the command line interface (CLI) of the system controller or chassis partition using an account with admin access.
When you log in to the system, you are in user (operational) mode.
-
Change to config mode.
configThe CLI prompt changes to include
(config). -
You can add attributes to all the configures exporters:
system telemetry attributes attribute <*attribute name*> <*attribute value*>Following example displays the configuration for an Attributes for all the configured exporters in the System Controller :
syscon-2-active(config)# system telemetry attributes attribute test.key config key test.key value test.value -
Commit the configuration changes.
commit -
Return to user (operational) mode.
end -
You can verify the added attributes.
show system telemetry attributesA summary similar to this example displays:
syscon-2-active# show system telemetry attributes
KEY       KEY       VALUE
--------------------------------
test.key  test.key  test.value
You can add, modify, or delete the instruments that are configured for an exporter from the CLI.
-
Connect using SSH to the system controller floating management IP address or chassis partition management IP address.
-
Log in to the command line interface (CLI) of the system controller or chassis partition using an account with admin access.
When you log in to the system, you are in user (operational) mode.
-
Change to config mode.
configThe CLI prompt changes to include
(config). -
You can use the following commands to modify the exporter configuration:
-
Add a new instrument
system telemetry exporters exporter <*server name*> config instruments <*instrument name*>A summary to this example displays:
syscon-2-active(config)# system telemetry exporters exporter server1 config instruments hardware -
Modify the instrument
system telemetry exporters exporter <*server name*> config instruments [<*instrument name*>]A summary to this example displays:
syscon-2-active(config)# system telemetry exporters exporter server1 config instruments [ optics ] -
Delete the instrument
no system telemetry exporters exporter <*server name*> config instruments <*instrument name*>A summary to this example displays:
syscon-2-active(config)# no system telemetry exporters exporter server1 config instruments platform
-
-
Commit the configuration changes.
commit -
Return to user (operational) mode.
end -
You can verify the state of the exporter. see Display exporter state from the CLI.