Manual Chapter : Viewing DoS Reports Statistics and Logs

Applies To:

Show Versions Show Versions

BIG-IP ASM

  • 12.1.6, 12.1.5, 12.1.4, 12.1.3, 12.1.2, 12.1.1, 12.1.0
Manual Chapter

Viewing DoS Reports, Statistics, and Logs

Overview: Viewing DoS reports and logs

If you have configured DoS protection on the BIG-IP® system, you can view charts, reports, statistics, and event logs that show information about DoS attacks and mitigations in place on the system. For example, you can view a DoS Overview screen that shows at a glance whether or not the system is under attack. The DoS Overview also indicates the impact of DoS attacks on the server's throughput, and RAM and CPU usage.

Other reports show transaction outcomes, and correlate the impact of system detection and the mitigation of DoS attacks. The reports and event logs help you to understand whether the DoS protection you have implemented is protecting your application web site, or whether you need to fine-tune the configuration. You can use the information to provide the intelligence necessary to identify and track DoS attacks. By looking at historical attacks and their trends, you can gain insight into the DoS threats the web site is facing.

You can also define custom reports based on dimensional queries.

Investigating DoS attacks and mitigation

Before you can investigate DoS attacks, you need to have created a DoS profile so that the system is capturing the analytics on the system. You must associate the DoS profile with one or more virtual servers.
You can display a DoS Overview report that tells you whether or not a DoS attack is taking place, and shows information about the impact of DoS attacks on your system throughput and memory.
  1. On the Main tab, click Security > Reporting > DoS .
    The DoS Overview screen opens and displays real-time information about all DoS attacks on the system. The system displays attacks that either started or ended during the last hour, by default.
  2. Review the Recent Attacks log, Throughput, and RAM & CPU usage charts to see if there have been any recent DoS attacks.
    The Recent Attacks log lists recent DoS attacks and shows a flag for an attack in progress. The log includes the most recent 100 events per protocol for application and network attacks. So up to 200 attacks may be shown in the charts.
  3. If the information you are looking for is not shown, try increasing the time period selected in the filter.
    You can also filter the attacks to view only those which have high, medium, or low impact.
  4. To focus in on the specific details in the charts, point on the charts at the time you are interested in.
    The system displays the details about what was happening at that time in a tooltip. For example, pointing on the throughput chart at a specific time displays the number of bits in and bits out at that time.
  5. To learn more about attacks that have occurred, in the Recent Attacks log, click the Attack ID number.
    The system displays events associated with the attack. If there are more than 100 events, you can see a link to the Event Log, which you can click to see more events.
You can review the details about DoS attacks on the DoS Overview screen and quickly see whether or not you are under attack.

Sample DoS Overview screen

This figure shows a sample DoS Overview screen on a system that is having a low-level DoS attack now (the first one listed shows a flag in the duration). Click the Attack ID to display the Transaction Outcomes report which includes details about the attack.

The Overview screen includes information on throughput and RAM and CPU usage. Because the statistics vary from system to system, it is a good idea to become familiar with typical memory and CPU usage and throughput on your system as well as checking for recent attacks.
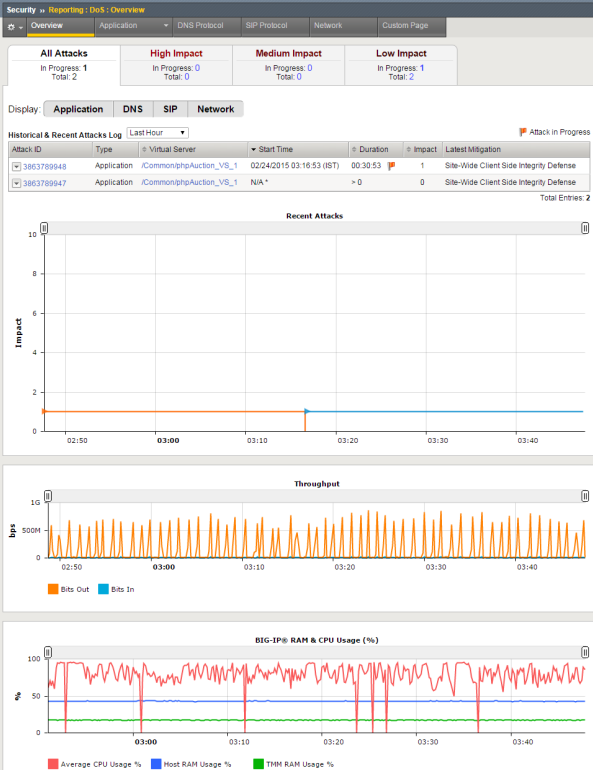
Sample DoS overview report

Sample DoS Overview screen

Viewing DoS transaction outcomes

Before you can look at DoS transaction outcomes, you need to have created a DoS profile so that the system is capturing the analytics on the BIG-IP® system. You must associate the DoS profile with one or more virtual servers.
You can display graphic charts that show transaction outcomes for DoS attacks on web applications that were detected on your system. The charts provide visibility into what caused the attack, IP addresses of the attackers, which applications are being attacked, and how the attacks are being mitigated.
  1. On the Main tab, click Security > Reporting > DoS > Application > Transaction Outcomes .
    The Transaction Outcomes screen opens and displays a graphical chart showing cumulative statistics about DoS attacks detected by the system.
  2. If you want to change the time frame for information shown in the chart, adjust the Display .. during settings.
    You can focus in on requests or responses only, and for the period of time you are interested in.
  3. To see the statistics for a specific time, point anywhere on the chart.
    Information about the transactions at that time pops up on the screen.
  4. If you want to view additional information, under the chart, from Drilldown to select the option for the details you want to see.
    For example, select Client IP Addresses to see the list of IP addresses involved in the attack, the number of transactions initiated by each one, and those which were valid, mitigated, and blocked.
  5. To view a report showing live traffic, click Open Real-Time Charts.
    A popup screen shows DoS statistics in real-time, and it is updated every 10 seconds.
By reviewing DoS Application Statistics, you can investigate the details of an attack. You can become more familiar with what caused the attacks, what applications are most vulnerable, and you see the mitigation methods that are in place. As a result of your investigation, you have more information to help you decide whether you need to tune the DoS configuration and add more protections, or change the thresholds in the DoS profile.
To get additional information if you are recording traffic during attacks, you can view the TCP dumps related to the DoS attacks in /shared/dosl7/tcpdumps.

Traffic distribution in DoS transaction outcomes

When displaying DoS transaction outcomes, the charts classify the traffic into the following traffic types.

Traffic type What it means
Incomplete Traffic that was dropped by the server because the connection was incomplete or the server did not respond. The system did not perform any DoS mitigation on this traffic. Transactions were reset, and responses were not sent to the client.
DoS Blocked Traffic that was blocked as a result of the mitigation methods (with rate limiting set using request blocking) in the DoS profile.
Shun Blocked Traffic that did not reach the server and was blocked because the IP address is on the network level shun list for having sent highly traffic that fails 90% of the time. As a result, statistics for HTTP transactions from this IP address are estimated because the IP address is blocked at the TCP level and not the HTTP level. This only appears when the dosl7d.shun_list system variable is set to enable.
Behavioral Blocked Traffic that did not reach the server because it was slowed down to an extreme level, and the TCP connection was reset.
Behavioral Slowdown Traffic that was slowed down but not blocked. The TCP connection of a potential attacker sending a lot of traffic was slowed down to lessen the impact on the server.
Proactive Mitigation Traffic that did not reach the server because it did not respond to a JavaScript challenge, which was sent due to using Proactive Bot Defense in the DoS profile. So it is potentially a web robot.
CAPTCHA Mitigation Traffic that did not respond to a CAPTCHA challenge or responded incorrectly. The challenge is specified in the mitigation methods of the DoS profile.
CS Integrity Mitigation Traffic that did not respond to a JavaScript challenge, which was sent as a result of the mitigation methods (set using client-side integrity defense options) in the DoS profile.
BIG-IP Response Traffic that is a response to the client from the BIG-IP system.
Cached by BIG-IP Traffic that is served from cache configured in the Web Acceleration profile.
Whitelisted Traffic from IP addresses on the IP Address whitelist in the DoS profile.
Passthrough Traffic that is allowed because it does not constitute a DoS attack.

Sample DoS Transaction Outcomes report

This figure shows a sample Transaction Outcomes report for a system on which there have been DoS attacks at the application level. The chart shows how the traffic has been handled by the system. It shows aggregated data that is updated every few minutes.
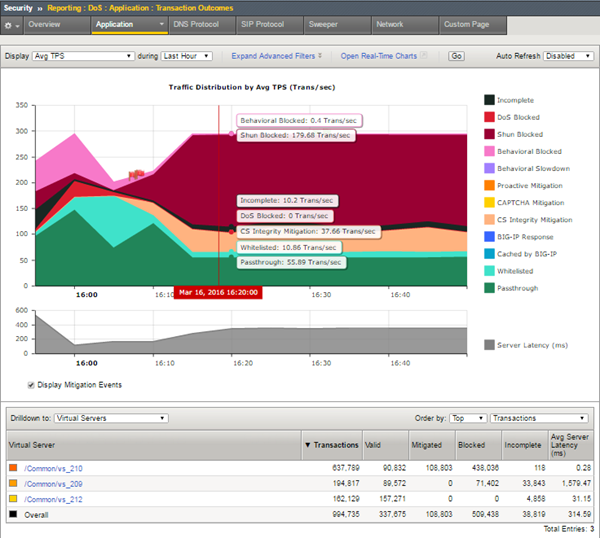
Sample DoS transaction outcomes

Sample DoS Transaction Outcomes report

You can adjust which elements are listed in the table below the chart. This figure lists the virtual servers that traffic is attempting to access. By clicking one of the virtual servers (or other objects listed), you can drill down to see what is happening with that specific traffic. For example, here attacks are primarily taking place on vs_210, and much of the traffic is being blocked.

You can also open a real-time chart that is constantly updated by clicking the Open Real-Time Charts link. It is a popup screen that you can leave displayed on your computer. It shows the traffic distribution on the system.
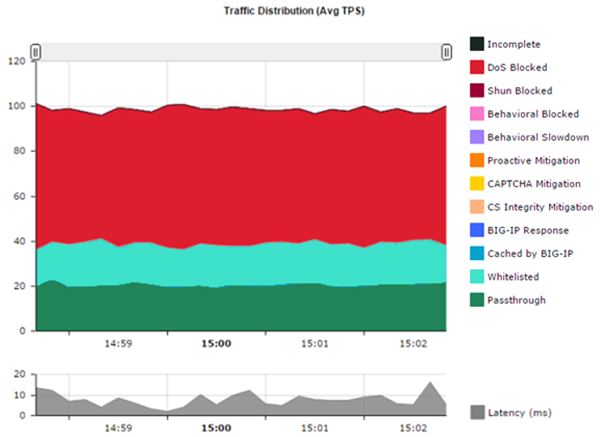
Sample DoS real-time chart

Sample DoS real-time chart

You can go back to the DoS Statistics report and change the values for what is displayed using the Display and during settings to see additional information. Viewing different statistical views is useful to understanding and tracking DoS attacks.

In the lower table on the screen, Latency (ms) indicates how long it takes (in milliseconds) from the time a request reaches the system, for it to proceed to the web application server, and return a response. Note that dropped or blocked requests that do not reach the server, do not register latency because there is no full request-response cycle.

Displaying DoS Application Events logs

You can display DoS Application Events logs to see whether L7 DoS attacks have occurred, and view information about the attacks. The logs show details about the DoS events.
  1. On the Main tab, click Security > Event Logs > DoS > Application Events .
    The DoS Application Events screen opens, and if Layer 7 DoS attacks were detected, it lists the details about the DoS attack such as the start and end times, how it was detected and mitigated, the attack ID, and so on.
  2. If DoS attacks are listed, review the list of attacks to see what has occurred, when it occurred, the mitigation, and the severity of the attack.
  3. From the event log, click the Attack ID link for an attack or event to display information about the attack in a graphical chart.

Sample DoS Application Events logs

This figure shows a sample DoS Application Events log showing information about the events related to several DoS attacks, such as when the attack started, how it was mitigated, the IP address where it originated, the transactions per second during the attack indicating the latency of traffic to the web application, and the attack ID. Many of the attacks have been mitigated by client side integrity defense where attackers have been detected by URL. Other attacks were relieved by rate limiting or behavioral mitigation.

Sample DoS Application Events log

Sample DoS Application Events log

You can click the attack ID to display DoS transaction outcomes related to the attack.

Viewing URL Latencies reports

For the URL Latencies report to include useful information, you need to have created a DoS profile and associated it with the application's virtual server for the system to capture the latency statistics for the application.
You can display a report that shows information about the latency of traffic to specific web pages in your application. The report lists the latency for each URL separately, and one row lists the latency for all URLs combined. You can use this report to check that the latency threshold that you used is close to the value in the latency histogram column for all traffic.
  1. On the Main tab, click Security > Reporting > DoS > Application > URL Latencies .
    The URL Latencies reporting screen opens.
  2. From the Time Period list, select the time period for which you want to view URL latency, or specify a custom time range.
  3. If you want to filter the information by virtual server, DoS profile, URL, or detection criteria, specify the ones for which you want to view the URL latency, and click Filter.
    By default, the report displays information for all items.
  4. Adjust the chart display options as you want.
    Display Option Description
    Display Mode Select whether to display the information as Cumulative or as related to the respective latency range, Per Interval.
    Unified Scale Select this check box to display all histograms using a single scale for all URLs, rather than a separate scale for each one.
    Order by Select the order in which to display the statistics: by the average server latency, the number of transactions, the histogram latency ranges (in milliseconds), or by how heavy URLs were detected (automatically detected or manually set).
  5. Review the latency statistics.
    • The report shows the latency for the most active URLs.
    • The Aggregated row summarizes the statistics for the URLs not included in the report.
    • The Overall Summary shows the latency of all traffic.
  6. To focus in on the specific latency details for one row, click the latency histogram.
    A magnified view of the histogram is displayed in a separate window. The latency histogram shows the percentage of transactions for each range of latency (0-2 ms, 2-4 ms, and so on up to 10000 ms or 10 seconds).

The URL Latencies report shows how fast your web application returns web pages and can show typical latency for applications (meaning virtual servers associated with a DoS profile) on your system. It can help you to identify slow pages with latency problems that may require additional troubleshooting by application developers.

You can also use the URL Latencies report for the following purposes:

  • To determine the threshold latencies, especially the heaviness threshold.
    Tip: Set the heaviness threshold to approximately 90-95% of the latency distribution for the site. Filter the data by site (that is, by virtual server and DoS profile), and check the latency distribution in the histogram of the Total row.
  • To track the current heavy URLs. You can add or remove manually configured heavy URLs depending on the information in the report.
  • To monitor the latency distribution.

Sample URL Latencies report

This figure shows a sample URL Latencies report for a system that has two DoS profiles and two virtual servers. It shows the latency for several web pages ranging from 10.97 ms to 2006.07 ms. One page (/DOS/latency2.php) has very high latency and might require some troubleshooting. In this case, the system determined that URL to be "heavy" based on traffic. While investigating the latency of URLs that take longer to display, if it is acceptable, you may decide to add them to the list of heavy URLs in the DoS profile so they do not trigger DoS mitigation.
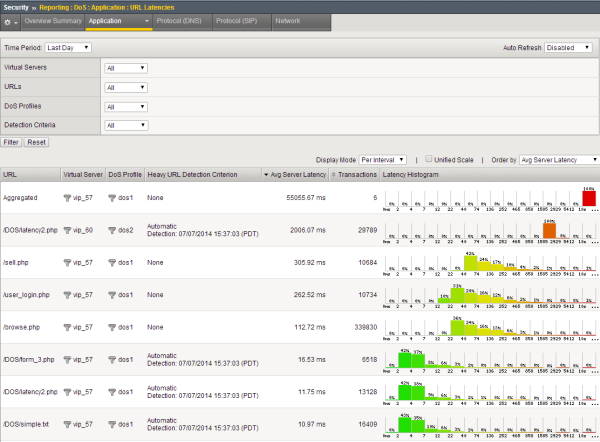
Sample URL Latencies report

Sample URL Latencies report

Creating customized DoS reports

You can create a customized DoS reporting screen so that it shows the specific data you are interested in, such as the top DoS attacks and server latency.
  1. On the Main tab, click Security > Reporting > DoS > Application > Custom Page .
    The DoS Custom Page screen opens, and shows default widgets (sections) you may find useful.
  2. Review the charts and tables provided, and click the configuration icon to adjust or delete them, as needed.
    • To modify the widget and change what it displays, click the gear icon and select Settings. On the popup screen, adjust the values that control what is displayed.
    • To remove the widget from the custom page, click the gear icon and select Delete.
  3. To create a new widget to your specifications, click Add Widget.
    The Add New Widget popup screen opens where you can select custom options for what to include, the time frame, and how to display the information.
  4. Continue adjusting the custom page so that it shows the information you want.
    You can drag and drop the widgets to change the order in which they are displayed. You can set the time range for all widgets or for each one separately.
  5. To save the information shown in the custom report to a file or email attachment, click Export and choose your options.
    You can also export the data from a single widget by selecting Export from the configuration icon.
You have created a custom page that includes the information you need to monitor your system. As you use the reports to investigate DoS attacks, you can adjust the custom page to include additional data that you need. You can save the reports or send them to others who want to review the data.