Applies To:
Show Versions
BIG-IP LTM
- 13.0.1, 13.0.0
Overview: Viewing CGNAT statistics
- Translation endpoints for all active LSN pools
- Logging attempts and failures
- Port block allocation (PBA) translations
- Port Control Protocol (PCP) requests
The CGNAT statistics provide information that is useful for capacity planning, resource distribution planning, and for investigating potential network problems.
You can view the historical statistics for different periods of time. On systems with multiple slots, you can view the statistics for each slot. You can also export the information in any of the reports to PDF or comma-separated value (CSV) format, and save the reports or email them.
Viewing CGNAT statistics
You can view CGNAT statistics on the BIG-IP® system to help with system planning and troubleshooting.
Sample CGNAT translation statistics
This figure presents a sample CGNAT translation statistics report showing the active translations for several LSN pools during the past week, and it includes the total number of active translations.
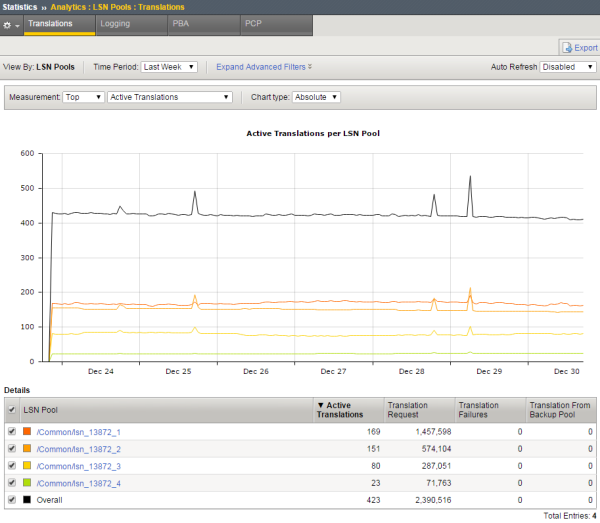
Sample CGNAT translation statistics
Sample CGNAT logging statistics
This figure presents a sample CGNAT logging statistics report showing the logging attempts for several LSN pools during the past hour.
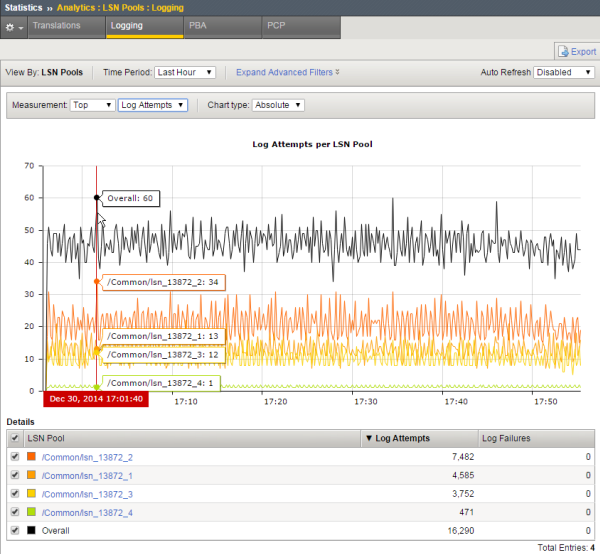
Sample CGNAT logging statistics
Sample CGNAT port block allocation statistics
This figure presents a sample CGNAT PBA statistics report showing the active port blocks for two LSN pools during the past hour.
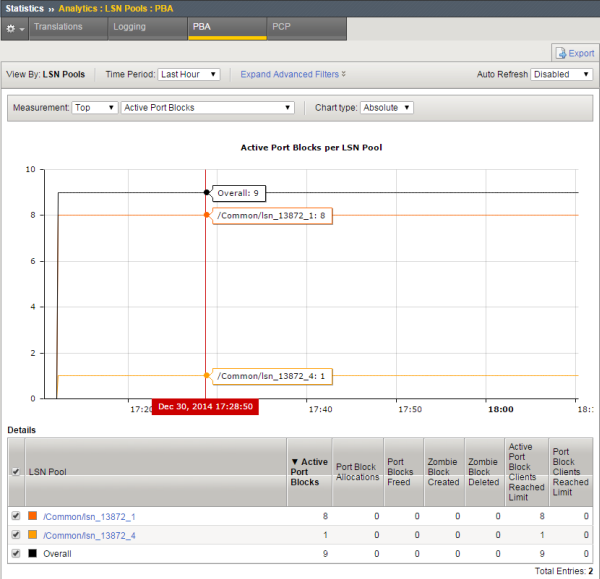
Sample CGNAT PBA statistics


