Applies To:
Show Versions
BIG-IP AAM
- 11.6.5, 11.6.4, 11.6.3, 11.6.2, 11.6.1
BIG-IP APM
- 11.6.5, 11.6.4, 11.6.3, 11.6.2, 11.6.1
BIG-IP GTM
- 11.6.5, 11.6.4, 11.6.3, 11.6.2, 11.6.1
BIG-IP LTM
- 11.6.5, 11.6.4, 11.6.3, 11.6.2, 11.6.1
BIG-IP ASM
- 11.6.5, 11.6.4, 11.6.3, 11.6.2, 11.6.1
Overview: Viewing vCMP statistics
After creating vCMP guests to process application traffic, you can display vCMP statistics to better manage performance.
Viewing virtual disk statistics
- The virtual disk names
- The slot number corresponding to each virtual disk image
- The size in gigabytes of each virtual disk
- The name of the guest to which each virtual disk is currently allocated
- On the Main tab, click .
- Locate the Virtual Disk List area of the screen.
The following table shows sample statistics for three separate virtual disks.
| Virtual Disk Name | Slot ID | Operating System | Status | Disk use |
|---|---|---|---|---|
| GuestA.img | 1 | TMOS | Ready | 64.4G |
| GuestB.img | 1 | Unknown | Unknown | 64.4G |
| GuestC.img | 1 | TMOS | Ready | 64.4G |
Viewing vCMP guest information
- The state configured for each guest
- The number of cores allocated to each guest
- The slot numbers on which each guest is running or slated to run
- The management IP address and netmask for each guest
- The minimum number of slots allocated to each guest
- The slot numbers on which each guest is allowed to run
Viewing current vCMP guest statistics
You can review current vCMP statistics for all guests on the BIG-IP system. The information shown includes the guest name, bytes, packets, multicast packets, dropped packets, and average CPU use. VIPRION systems also include slot information.
Viewing statistics for physical disk usage
- Disk name
- The slot numbers corresponding to the disk name
- The number of virtual disks
- The total vCMP application volume size, in gigabytes
- The available vCMP application volume size, in gigabytes
- On the Main tab, click .
- Locate the Disk Usage area of the screen.
The following table shows sample statistics.
| Disk | Slot ID | Number of Virtual Disks | Total Volume Size (GB) | Available Volume Size (GB) |
|---|---|---|---|---|
| HD1 | 2 | 1 | 84 | 14 |
Viewing historical statistics about vCMP
Sample vCMP Statistics reports
This figure shows a sample vCMP Statistics report showing a system on which there are two guests. The chart shows the average CPU usage for the guests over the past day.
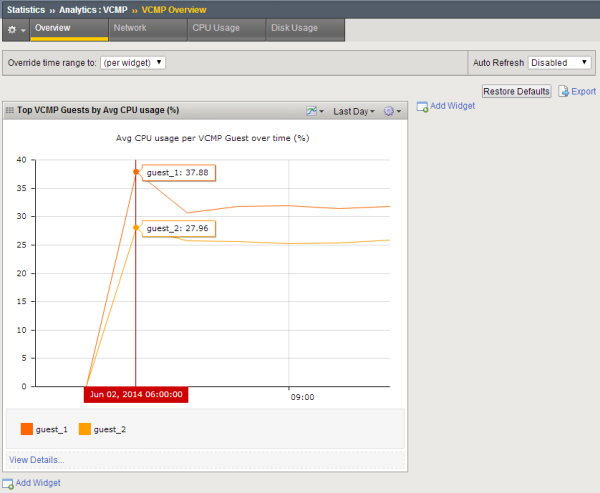 Sample vCMP Overview
You can view other statistics, such as network statistics, by clicking items on the menu bar. This figure shows network statistics for vCMP guests during the last hour, but you can also view statistics by vCMP interfaces or chassis slots. You can also change the time frame for which to view the statistics.
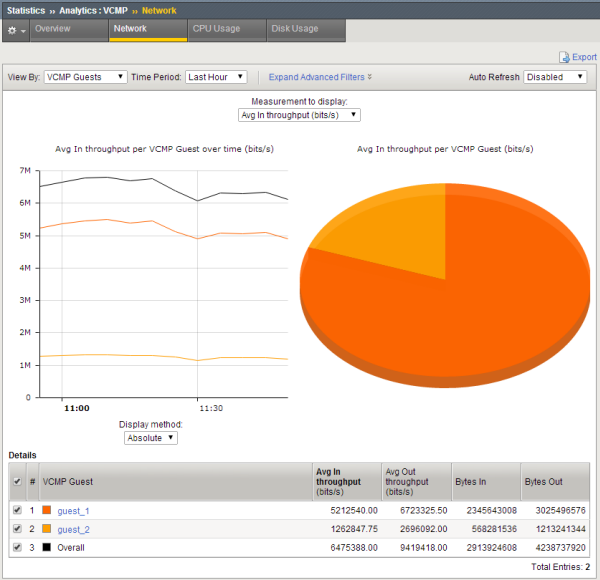 Sample vCMP Network statistics
By clicking guest_1 in the table below the chart, you can drill down to see what is happening for that guest. For example, here you can see the throughput for each of the interfaces on guest_1.
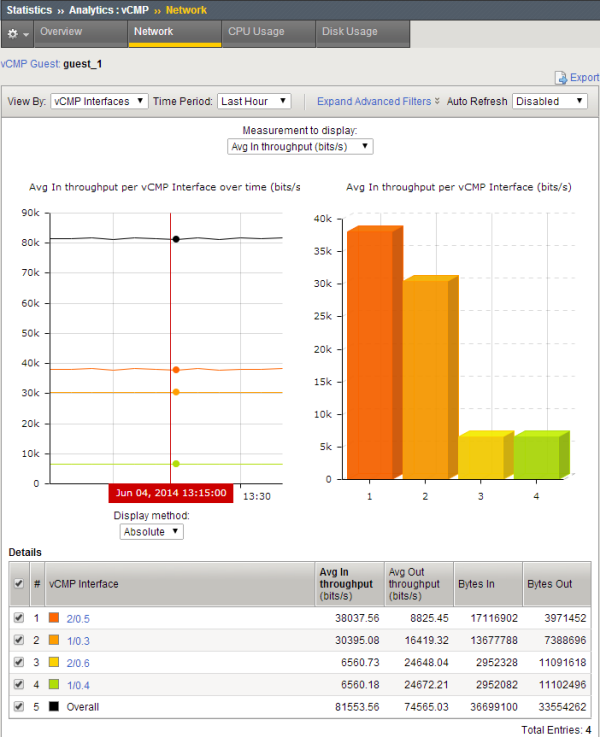 Sample vCMP Network statistics after drill down
You can further drill down by clicking an interface to see additional details, or view CPU or disk usage by clicking the menu bar.


