Applies To:
Show Versions
BIG-IQ Centralized Management
- 5.4.0
What analysis can I perform using collected statistics?
You can use the statistics collected by F5® BIG-IQ® Centralized Management to visually analyze the performance of Local Traffic objects, device traffic, DNS traffic, and overall system statistics. The statistics are displayed in graphical charts and tables that you can drill down into for more specific details. You might want to track network performance on a device, or memory and CPU utilization; or you might want to compare the performance on two devices or a group of devices. You can focus the statistics in the charts on different categories such as virtual servers, pools, pool members, or DNS traffic.
How do I get started managing statistics data?
You can monitor statistics data generated by the devices you manage. You can monitor the performance of your BIG-IQ® devices as well, but that works differently and is discussed in the online help. There are a few things you need to do before you can start monitoring the statistics data generated by your managed devices.
- You need to install, configure, and discover a data collection device (DCD). The DCD stores the data from your devices, and routes the date to your BIG-IQ device. Refer to Planning and Implementing a Centralized Management Deployment for details.
- You need to enable statistics collection for the devices you want to monitor. There a couple of ways to do that. Refer to Enabling Statistics Collection for details.
Once you have your system set up and you are receiving statistics, you should take a minute or two to understand how the user interface works. The interface is set up so that statistics from Device, DNS, and Local Traffic use a common set of tools to manage how you access and manage your data. Once you understand how this common interface works, you should be ready to go.
What elements make up a statistics overview screen?
This figure shows a typical statistics overview screen. The three parts of the statistics overview screens work together so you can fine-tune the statistics display. To view a screen similar to this, click . However, until you configure statistics collection, there won't be any data.
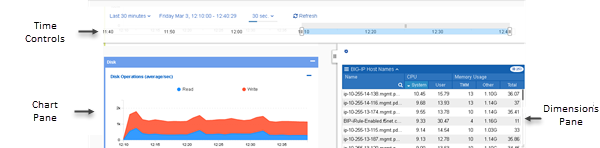
Typical statistics overview screen
The table defines key elements of this screen.
| User interface area | What does this part of the screen do? |
|---|---|
| Time Controls | Adjusts the time window for which statistics are displayed. For details on how these controls work, see How do the time controls work?. |
| Chart Pane | Displays a series of charts that plot the collected statistics. For details on how to manipulate these charts, see How does the chart pane work?. |
| Dimensions Pane | Determines the objects for which you display statistics. For details on how the controls on this pane work, see How does the dimensions pane work?. |
How do the time controls work?
This figure shows a close up of the time controls on a typical overview screen. To view a screen similar to this, click .The four time controls work together to give you control of the specific time period for which you wan to see statistics.
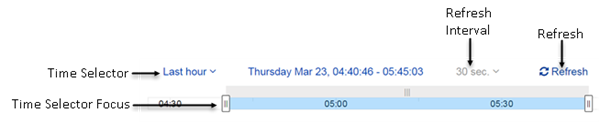
Overview screen time control detail
Key elements of this screen are defined in the table.
| User interface control | What does this control do? |
|---|---|
| Time Selector | Use this control to specify the length of time for which you want to view statistics data. When you first start looking at statistics, only the All option is available. Then as you gather additional data, additional time period options become available. Data is displayed from the instant the last refresh occurred, back to time interval you specify. For example, if the last refresh occurred at 11:00, and the Time Selector is set to 30 minutes, the charts display data from 10:30 to 11:00. |
| Time Selector Focus | Use this control to focus on a specific window of time within the currently selected
time period. Use the sliders at either end of this control to define the time segment you want
to examine. The time segment you select here is indicated along the lower horizontal axis of
the chart pane to provide a reference. For example, if the last refresh occurred at 11:00, and
the Time Selector is set to 30 minutes, you could use the sliders to look at the period from
10:45 to 10:50. When you adjust the sliders, the time markers along the bottom of each chart
axis update to indicate your selection. Also, note that you can adjust both ends of this
control. If you adjust the right side of the control, the auto refresh stops, effectively
freezing the display so you can focus on a particular data point.
Tip: Alternatively, you can click on the chart axis
to specify the focus. Click on a point in the axis and drag in the direction that you want to
view. As you drag, a highlighted window shows what you have selected for the time selector
focus, and a small magnifying glass icon appears. When you have the time selector focus you
want, click the magnifying glass.
|
| Refresh Interval | Use this control to specify how frequently the data on this page is refreshed. |
| Refresh | Use this control to trigger an immediate refresh of the data on this screen. |
How does the chart pane work?
This figure shows a closer look at the elements that make up the chart pane on a typical Overview screen. To view a screen similar to this, click . You can re-order the charts by dragging and dropping them into place.
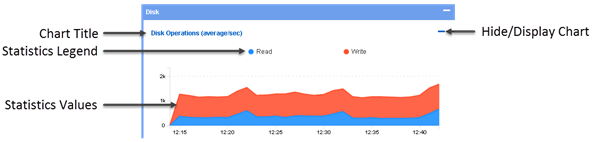
Overview screen, chart pane detail
Key elements of this screen are defined in the table.
| User interface control | What does this control do? |
|---|---|
| Chart Title | Each chart displays a title that identifies the statistic that plots on that chart. Each title includes the units of measure that apply to these plots. |
| Statistics Legend | These colored dots identify the specific plots displayed on the chart. When you move your cursor over a chart, the value of each plot displays adjacent to these dots. If there is a multiplier applied to a value, it displays as well. For example, if you hover over one of the New Connections plots and the value 31.9k displays, it means that there were an average of 31,900 connections per second at that point in time. |
| Statistics Values | These plots display the value of the statistics collected for the selected time
period. Data is aggregated for the objects or devices that are currently selected. Initially, the selection is all of the managed objects or devices, but you can use the dimensions pane to change the selection. If you select one device, the charts shows statistics for just that device. If you select two devices, the charts plot aggregated statistics for those devices. If you then select just one device, and five virtual servers, the charts plot aggregated statistics for the five virtual servers and the single device. For more information on using the dimensions pane refer to How does the dimensions pane work? |
| Hide/Display Chart | Use this control to hide or display a chart. When you hide a chart, the chart title remains. If you create a comparison chart, an additional control appears that you can use to delete that chart. |
How does the dimensions pane work?
In the BIG-IQ® user interface, a dimension is a statistical category (for example BIG-IP® host name or iRule event types). Each dimension is broken up into sub-categories that you can view when you expand the dimensions pane to display your statistical data as a table. The other primary use for the controls in the dimensions pane is to filter the objects for which statistics are displayed in the chart window. To view a screen similar to the following illustration, click , and then click the down arrow on the BIG-IP Host Names dimension. After you expand a dimension, you can select individual objects, or multiple objects, or create a comparison graph that displays statistics for selected objects. The figure shows the key elements that make up the dimensions pane on a typical Overview screen. You can re-order the dimensions by dragging and dropping them into place.
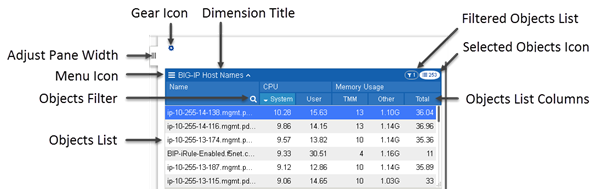
Overview screen dimensions pane detail
Key elements of this screen are defined in the table. Except for the name of each dimension and the pane width adjustment, these controls display only when you expand a dimension to display all of its members.
| User interface control | What does this control do? |
|---|---|
| Adjust Pane Width | With this tab, you can adjust the width of the chart and dimensions panes.
To adjust the dimensions pane width, click this tab and drag the pane to the width you want. To extend the dimensions pane to full screen, single click this tab. |
| Menu Icon | When you click the menu icon, you can choose between several options that you can use
to change what is displayed in the Dimensions pane.
Note: You can also sort a dimension or
specify which columns display by right-clicking the column header.
If you select one or
more objects for a dimension, you can choose two additional options:
|
| Objects Filter | Click the magnifying glass to open a filter control. To filter the list of objects that display in the Objects List, type the name you want to find and click the magnifying glass again. Note that the filter is a prefix match (it starts with the first character of the object name), and the match is case-sensitive. |
| Objects List | The first 100 objects that meet the filter criteria display here. To display an object
not in the top 100, you can change your filter criteria or sort order. Objects selected in the
objects list, control the data that plots in the charts. That is:
Note: If you select two or more
objects in this list, you can create a comparison chart that plots values for a selected
parameter.
|
| Objects List Columns | The default number of columns that display depends on the type of dimension. You can also change which columns display using the menu icon. You can sort the entries in a dimension by clicking an individual column title. . |
| Dimension Title | The title of the dimension displays here adjacent to an up arrow/down arrow toggle. This toggle collapses and expands the list of objects of this dimension type for the devices you are currently managing. |
| Gear Icon | The gear icon provides several options that you can use to change how the objects you
have selected in the Dimensions panel display.
|
| Selected Objects Icon | This icon displays the number of objects in this dimension that match the current filter settings. Note that the objects you select in one dimension impact the number of objects in the other dimensions. As an example, consider a BIG-IQ managing 20 BIG-IP devices that each have 100 virtual servers. Initially, on the Virtual Servers overview screen, the selected objects icon in the BIG-IP Host Names dimension reads 20, and the selected objects icon on the Virtual Servers dimension reads 2000. If you select one BIG-IP device, the icon for virtual servers changes to 100. On the other hand, if you select one of the virtual servers, the icon for BIG-IP devices would change to 1 (unless that virtual server happens to reside on more than one device). |
| Filtered Objects Icon | This icon displays the number of objects you have selected in this dimension. You can also click this icon to de-select all objects in this dimension. |
Comparison Charts
Comparison charts allow you to plot data values for selected items in a new chart. When you initially create a comparison chart, you select the statistical metric that you want to compare. When the comparison chart displays, the title for the new chart displays which items are selected for comparison, along with the metric being compared, followed by a down arrow icon. You can click that down arrow if you want to change the comparison metric for the selected objects. To compare additional items, you can create additional comparison charts by again selecting multiple items, right clicking and choosing Create Comparison Chart, and selecting the statistical metric you want to compare.
What is different about a DNS statistics overview screen?
This figure shows a typical DNS statistics overview screen. To view a screen similar to this, click . Until you configure statistics collection, there won't be any data. You can use the time controls to focus on a time period of interest, similar to other overview screens. However, there are unique elements on this screen that provide you with a quick overview summarizing the DNS traffic performance on your managed devices.
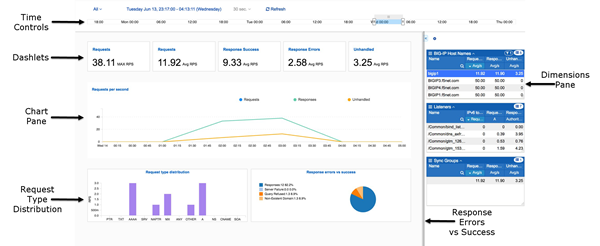
Typical DNS Sync group statistics overview screen
Key elements of this screen are defined in the table.
| User interface control | What does this part of the screen do? |
|---|---|
| Time Controls | Adjusts the time window for which statistics are displayed. For details on how these controls work, see How do the time controls work? |
| Dashlets | These small windows serve similarly to the gauges on a dashboard, providing a current performance readout for key performance statistics. |
| Chart Pane | Displays a series of charts that plot the collected statistics. For details on how to manipulate these charts, see How does the chart pane work? |
| Request Type Distribution | This chart graphs the types of request that are currently being processed by this DNS sync group. |
| Response Errors vs Success | This chart graphs the DNS sync group's success rate in processing requests relative to the number of requests that result in errors. |
| Dimensions Pane | Determines the objects for which you display statistics. For details on how the controls on this pane work, see How does the dimensions pane work? |


