Applies To:
Show Versions
BIG-IQ Centralized Management
- 5.4.0
About Access and SWG reports
Access reports focus on session and logging data from Access devices (managed devices with APM licensed and provisioned). F5® Secure Web Gateway Services reports focus on user requests (for URLs or applications, for example) from Access devices with Secure Web Gateway Services provisioned. BIG-IQ® Centralized Management Access also supports high availability. Thus, users can view both Access and SWG reports on a secondary BIG-IQ system.
Access reports and SWG reports provide the following features.
- Reports on any combination of discovered devices, Access groups, and clusters
- Graphs for typical areas of concern and interest, such as cross-geographical comparisons or top 10 issues
- Tabular data to support the graphs
- Ability in some screens to drill down from summarized data to details
- Ability to save data to CSV files
Setup requirements for Access and SWG reports
Before you can produce Access reports and SWG reports, you must ensure that these tasks are already complete.
- Set up the BIG-IQ® Centralized Management data collection devices.
- Add the BIG-IP® devices to BIG-IQ inventory.
- Discover the devices. (Devices with the Access service configuration are what you need.)
- Run the data collection device configuration setup on the devices from the Access Reporting screen.
What data goes into Access reports for the All Devices option?
The All Devices option for Access reports includes data from the devices that are currently managed (discovered) in the BIG-IQ® system. This is in addition to data from devices that were managed at some point during the report timeframe, but that are not currently managed. With All Devices selected, if data from unmanaged devices exists, it displays in reports.
An unmanaged device might be unmanaged temporarily or permanently. Any time a configuration management change causes APM® to be undiscovered, the device and its data are moved to All Devices until APM is re-discovered on the device.
You cannot generate a report for an unmanaged device. However, you can generate a report for the timeframe when the device was managed, and then search the report for the unmanaged device name. In the Summary report, All Active Sessions includes the number of sessions that were active on the device when it became unmanaged. Those sessions stay in the Summary and in the Active sessions reports until the next session status update, which occurs every 15 minutes.
About upgrades affecting reports
When you upgrade a BIG-IQ® Centralized Management system without taking a snapshot, it deletes all reporting data, including both Access and SWG reports. After upgrading, users cannot obtain these reports from the BIG-IP® devices. To prevent the lost of reports, users should take an Elasticsearch snapshot before upgrading, and restore the snapshot after upgrading. For more information on elasticsnapshots, refer to F5 BIG-IQ Centralized Management: Upgrading Logging Nodes to Version x.x.
About the application dashboard
The Application Summary dashboard is your starting point to view and download general reports for BIG-IQ Access.
View the Application Summary dashboard
- Log in to the BIG-IQ system with your user name and password.
- At the top of the screen, click Monitoring.
- On the left, select .
About application visibility
You can monitor your applications by viewing the BIG-IQ® Centralized Management Access user dashboard for data on which applications are linked to the BIG-IQ Access component. The system displays the top applications used and the application usage time. Administrators can expand the GUI for a specific application and view the following information:
- The application access history
- The users who use the application the most
- The access history
- The world map, showing where the user is access the application
About user visibility
You can monitor your user base by viewing the BIG-IQ® Centralized Management Access user dashboard for data on specific users. The system displays which users created the most sessions, were denied the most sessions, and had the longest total session duration. The administrator can enter a specific user name to get the following details for the user:
- User login locations on a world map.
- Total sessions, denied sessions, and session duration.
- Denied sessions.
- Top authentication failures, including AD Auth and LDAP only.
- Device type users used to log into the system.
- Reason the system terminated the session.
- Login history showing the success and failures over time.
- Most accessed applications.
- Most accessed URLs.
- Login failure attempts over time, sorted by the reason.
- Client session duration over time.
- Endpoint software.
- Network access reconnect, errors, and usage rates.
Managing a specific user in Access reporting
Running Access reports
Getting the details that underlie an Access report
-
Click anywhere in a summary to get more information.
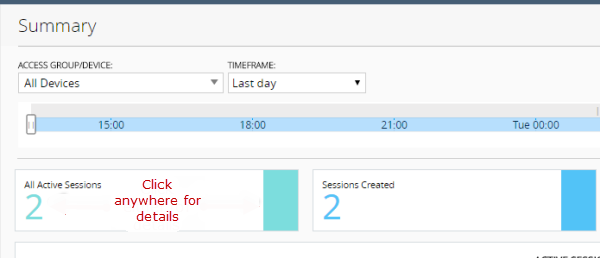
Top left portion of the Summary report display
Additional graphs display, and supporting data displays in a table at the bottom of the screen. -
If the table includes a Session ID field, click the link
in that field to open the session details.
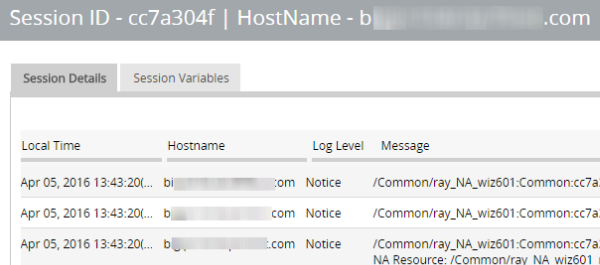
Session details popup screen (with addresses and host names blurred)
About the maximum number records for Access and SWG reports
When you run an Access report or an SWG report, Access can get up to 10,000 records to display to you. After you scroll to the end of those 10,000 records, Access displays a message. At that point, all you can do is select fewer devices or select a shorter timeframe.
Setting the timeframe for your Access or SWG report
- Log in to BIG-IQ Centralized Management with your admin user name and password.
- At the top of the screen, click Monitoring.
- To set a predefined timeframe, select one of these from the TIMEFRAME list: Last hour, Last day, Last week, Last 30 days, Last 3 months.
-
To set a custom timeframe, select one of these from
theTIMEFRAME list:
- Between: Click each of the additional fields that display to select dates and times. The report displays the records between those dates and times.
- Before: Click the additional fields that display to select a date and a time. The report displays the records before that date and time.
- After: Click the additional fields that display to select a date and a time. The report displays the records after that date and time.
Access report problems: causes and resolutions
| Problem | Resolution |
|---|---|
| A session is over, but it continues to display in the Active sessions report. | If a session starts when logging nodes are up and working, but terminates during a period when logging modes are unavailable, the session remains in the Active sessions report for 15 minutes. After 15 minutes, the session status is updated and the session is dropped from the report. |
| Active sessions are included in the Summary and Active sessions reports for a device that is no longer managed. | Sessions were active on a device when it was removed from an Access group and became unmanaged. Sessions that were active when the device became unmanaged remain counted in All Active Sessions on the Summary screen and stay in the Active sessions report until the next session status update, which occurs every 15 minutes. |
| A session is over, but Session Termination and Session Duration are blank in a session report. | If a session starts when logging nodes are up and working but terminates during a period when logging nodes are unavailable, the session termination is not recorded and the session duration cannot be calculated. |
What can cause logging nodes to become unavailable?
Logging nodes are highly available, but it is still possible for them to become unavailable. This could occur, for example, if all logging nodes are on devices in the same rack in a lab, and the power to the lab shuts down.
Sessions
Running Session reports
Stopping sessions on BIG-IP devices from Access
Running Secure Web Gateway reports
About denied sessions
You can monitor the sessions that BIG-IQ® Centralized Management denies. By using the Access Monitoring option, you can view the following information:
- The history of denied sessions
- The reasons why sessions were denied
- The top denied users, sorted by session count
- The top authentication failures
- The top denied policies
- The top denied sessions by country of origin
- The top denied session by the virtual server
- The denied sessions, sorted by the client platform
Viewing denied sessions
Getting the details that underlie an SWG report
About VDI reports
- The top 10 VDI applications
- The top users for the VDI applications
- The application usage history
About network access reporting
You can use F5® BIG-IQ® Centralized Management to monitor the health of your network access connections. From the Network Access dashboard, you can view graphs and data for network access performance, reconnecting detail, errors, and usage rates. With the network access reporting feature, you gain full visibility of your network access usage information such as which users are request access, timestamps of the requests, and details of failures in their APM enviornments. All this allows you to troubleshooting your BIG-IP system deployments without logging into each BIG-IP device individually.
View the network access summary
About network access performance
The Network Access Performance screen gives you an overview of how your network access traffic is performing. BIG-IQ supports the following features:
- Throughput over time - Displays a graph showing the throughput to and from the client device in bits per second.
- Active connections over time - Displays a graph showing the average number of connections per hour.
- New connections over time - Displays a graph showing the average number of new connections per hour.
About network access reconnect
The Network Access Reconnect screen gives you an overview of your network access reconnects. BIG-IQ supports the following features:
- Local Time - Displays the local timestamp when the user reconnected to the network access connection.
- Hostname - Displays the BIG-IP system from which the network access connection originates.
- Cluster - Displays the BIG-IP APM cluster.
- Session ID - Click the session ID to open the Session Details screen, displaying session details and session variables.
- User Name - Displays the username of the reconnecting user.
- Client IP - Displays the IP address of the client device used for the reconnect.
- Client OS - Displays the operating system of the client device used for the reconnect.
- Country - Displays the country where the reconnect originates.
- State - Displays the geographical state where the reconnect originates.
- Continent - Displays the continent where the reconnect originates.
- Client Application - Displays the client application associated with the network access.
About network access errors
The Network Access Errors screen gives you an overview of your errors that occur during your active network access connections. BIG-IQ supports the following features:
- Local Time - Displays the local timestamp when error occurred.
- Hostname - Displays the BIG-IP system from which the network access error occurred.
- Session ID - Click the session ID to open the Session Details screen, displaying session details and session variables.
- Error Message - Displays the error message.
- User Name - Displays the username of the the user associated with the error.
- Client IP - Displays the IP address of the client device where the error occurred.
- Client OS - Displays the operating system of the client device where the error occurred.
- Country - Displays the country where the error occurred.
- Virtual Server - Displays the virtual server associated with the network access resource.
About network access usage
The Network Access Usage screen gives you an overview of your network access connection usage rates. BIG-IQ supports the following features:
View network access usage for the top 1000 users in the table:
- User Name - Displays the usernames of the top users by usage.
- Total Connections - Displays the total number of network access connections.
- Total Bytes In - Displays the total number of bytes received by the network access.
- Total Bytes Out - Displays the total number of bytes sent out by the network access.
- Total Bytes Transferred - Displays the total number of sent and received bytes.
- Total Duration - Displays the total duration when the network access connections for a user were active. When the user has multiple active connections at the same time, the total duration is the sum of the duration of those two connections.
- Distinct Locations - Displays the number of unique locations from where the network access usage originates.
View network access usage for the top 1000 locations in the table:
- Country - Displays the countries from where the network access usage originates.
- State - Displays the states in the countries from where the network access usage originates.
- Total Connections - Displays the total number of network access connections.
- Total Bytes In - Displays the total number of bytes received by the network access.
- Total Bytes Out -Displays the total number of bytes sent out by the network access.
- Total Bytes Transferred - Displays the total number of sent and received bytes.
- Total Duration - Displays the total duration when the network access connections for a user were active. When the user has multiple active connections at the same time, the total duration is the sum of the duration of those two connections.
About endpoint security check
You can use F5® BIG-IQ® Centralized Management to monitor the your endpoint security checks. From the Endpoint Software Summary dashboard, you can view graphs and tables showing how your system collects and verifies system information. With the endpoint software reporting feature, you gain full visibility of your software checks, products, and vendors. All this allows you to troubleshooting your BIG-IP system deployments without logging into each BIG-IP device individually.
About endpoint software summary
The Endpoint Software Summary screen gives you an overview of your endpoint checks. BIG-IQ supports the following features:
- SOFTWARE CHECKS TYPES - Displays the types of software checks.
- TOP 10 USED PRODUCTS - Displays the top ten products used.
- TOP 10 USED VENDORS - Displays the top ten vendors used.
- Top 100 Products, Vendors Types by used count - Displays the top 100 products and the type of vendors used.
About endpoint software details
The Endpoint Software Details screen a detailed table of your endpoint software checks. BIG-IQ supports the following features:
- Local Time - Displays the local timestamp when the endpoint check took place.
- Hostname - Displays the BIG-IP system from which the endpoint check originates.
- Cluster - Displays the BIG-IP APM cluster.
- Session ID - Click the session ID to open the Session Details screen, displaying session details and session variables.
- Product Name - Displays the name of the product with endpoint software.
- Vendor Name - Displays name of the vendor who supplies the product.
- Version - Displays the product version.
- User Name - Displays the logon name used to perform the endpoint check.
- Client OS - Displays the operating system where the endpoint check originates.
- Continent - Displays the continent where the endpoint check originates.
- Country - Displays the country where the endpoint check originates.
- State - Displays the state or province where the endpoint check originates.
Managing federation reports
Running OAuth reports
Monitoring the OAuth server performance
The Authentication Server Summary screen shows several charts that you can use to track the health of your authorization server role. Data appears when you configure statistics collection. Controls on this screen work together so you can fine-tune the statistics display.
Monitoring the OAuth token summary
The Token Summary screen shows several charts that you can use to track the health of your OAuth tokens. Data appears when you configure statistics collection. Controls on this screen work together so you can fine-tune the statistics display.
Running SAML reports
Running SP assertion reports
The SP Assertions screen shows several charts that you can use to track the health of your SAML SP assertions. Data appears when you configure statistics collection. Controls on this screen work together so you can fine-tune the statistics display.
Running SP error reports
The SP Errors screen shows several charts that you can use to track the health of your SAML SP errors. Data appears when you configure statistics collection. Controls on this screen work together so you can fine-tune the statistics display.
Running IdP assertion reports
The IdP Assertions screen shows several charts that you can use to track the health of your SAML IdPs assertions. Data appears when you configure statistics collection. Controls on this screen work together so you can fine-tune the statistics display.
Running IdP error reports
The IdP Errors screen shows several charts that you can use to track the health of your SAML IdP errors. Data appears when you configure statistics collection. Controls on this screen work together so you can fine-tune the statistics display.
Troubleshooting Access reporting
Overview: About troubleshooting Access reports
Access in the F5® BIG-IQ® Centralized Management monitoring dashboard displays statistics for applications and users that are managed by the BIG-IP® system. In some cases, data is missing in the dashboard. Missing data can include log message reports and session reports. You can troubleshoot this issue by doing the following tasks:
- Make sure the Elastic Search Cluster health status is operational.
- Active the Access service.
- Enable remote logging.
- Make sure the BIG-IP device is communicating to the data collection device.
- Recover any missing user names in the Sessions report and the Log Message report.
- Resolve unassigned cluster shards.
Check data collection device health
Enable remote logging
- Discover BIG-IP devices that are provisioned with the APM service.
- Configure one or more BIG-IQ data collection device.


