Updated Date: 07/07/2026
Application service device charts
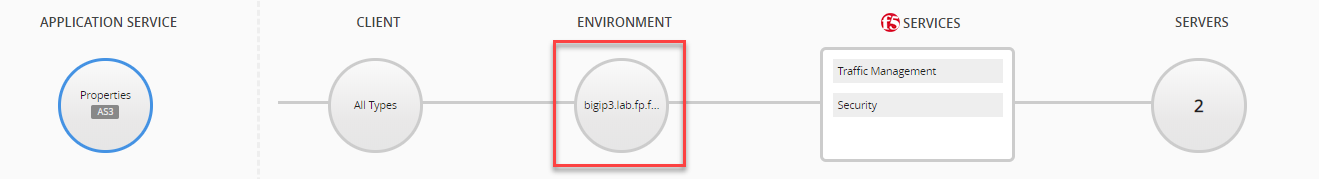
This table describes the menu options and charts found in the application service dashboard (Applications > APPLICATIONS > <Application Name> > <Application Service>). Select the option marked in the image to view charts at the bottom of the screen. These charts display the trends of the host BIG-IP device, or service scaling group. Each chart displays an aspect of the devices as a function of the selected time period.
|
ANALYTICS Menu Option |
Description |
|---|---|
|
CPU Usage |
The percentage of CPU usage based on overall and specific activities of the BIG-IP system devices.Metric Unit: Percent Legend: User: The average percentage of CPU usage for the all the BIG-IP user space programs over a given time period. System: The average percentage of CPU usage for all the running BIG-IP systems over a given time period I/O Wait: The percentage of time (during the selected time period) that a given CPU is idle for an I/O wait operation. This occurs when at least one outstanding I/O disk operation is requested by a task scheduled on system CPU. Stolen: The percentage of time a virtual CPU waits for real CPU when the hypervisor is servicing another virtual machine. |
|
Top Cores |
The six, most active CPU cores for all monitored BIG-IP devices. Metric Unit: Percent Legend: CPU core |
|
Memory |
The percentage of RAM used by system processes of the monitored BIG-IP devices. Metric Unit: Percent Legend: TMM: The average percentage of RAM used by device TMM processes. Total: The average percentage of RAM used by all devices Other: The average percentage of used RAM from non-TMM processes. |
|
Throughput |
The average rate of traffic (in bytes) processed by the BIG-IP device interfaces.Metric Unit: Average/s Legend: In: The average rate of incoming traffic to the BIG-IP devices. Out: The average rate of outgoing traffic from the BIG-IP devices. |
|
Connections |
The average number of connections that are open at the same time, on either the client-side or the server-side.Metric Unit: Count Legend: Client Side: The average number of concurrent connections at the client side. Server Side: The average number of concurrent connections at the server side. |
|
HTTP |
The transaction includes all HTTP request and response messages passed between the client, BIG-IP system, and server.Metric Unit: Average/s Legend: Transactions: Average number of HTTP transactions per second that were processed by the BIG-IP devices. |
|
Dropped |
The average rate of packets per second (pps) that were dropped by the BIG-IP device interfaces or discarded by the TMM over the course of the transaction.Metric Unit: Average/s Legend: In: The average rate of packets per second that were dropped by the BIG-IP interface. Out: The average rate of packets per second that were accepted by the BIG-IP interface, but discarded by the TMM. |
|
Errors |
The average rate packets per second (pps) that were corrupted or arrived incomplete over the course of the transaction across the network,Metric Unit: Average/s Legend: In: The average packets per second received as throughput error. Out: The average packets per second transmitted out at throughput error. |