Updated Date: 07/07/2026
TCP Charts
The charts that reflect TCP data allow you to analyze current traffic data, and troubleshoot any issues that may occur over time. The parameters found in the charts described can indicate the wait time over the course of the client-server communication channel. To view charts for a TCP application service, go to Applications > APPLICATIONS > <Application_Name> > <TCP_Application_Service>.
Note: You can view TCP data for all your traffic (to all managed applications) by going to Monitoring > DASHBOARDS > Local Traffic > TCP.
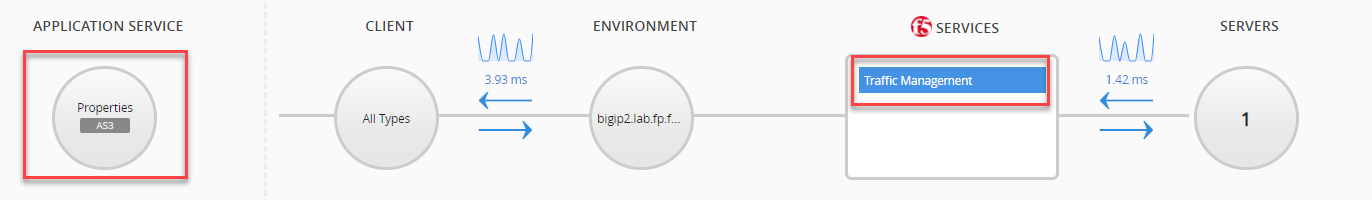
Tip: The image shows which selections display the charts detailed below. These charts display a combination of both request and server side data. Click CLIENT or SERVERS to view that part of the transaction with the BIG-IP system. Click Environment to display the status of the BIG-IP device.
- Round Trip Time (RTT)
- A measure of time it takes to send a packet and receive an ACK message from the target host. Increased RTT over time indicates limited network bandwidth.
- Goodput
- The number of useful bytes, delivered by the network, to a destination over time. Low goodput in ratio to overall throughput indicates network issues, such as increased retransmits.
- Delay States
- A traffic condition in which the TCP protocol limits packet flow to avoid network congestion. During periods of congestion, the TCP protocol applies a mitigation algorithm to manage traffic flow according to the root cause of congestion. For more information about the traffic conditions that prompts a delay state, see TCP Dimensions and Metrics.
- Connections
- The average number of new and closed TCP connections. Monitoring your TCP connections can indicate the level of activity across your network.
- Packets
- The volume of transmitted data over the network, including payload, and other required data based on the packet format. The outcome of these packets over time can indicate a number of network issues including: congestion, server performance/capacity limits, or an attack.