Updated Date: 07/07/2026
Evaluate client-side information from TCP data
You can evaluate data about your client-side connections using TCP analytics. When viewing TCP connection data, you can analyze detected client IP addresses, or traffic volume data from the client-side. There are two ways to view data: evaluate a specific application service; or evaluate TCP traffic to all your applications. Use the process that best suits your system’s needs.
Tip: For more information about the charts, dimensions and metrics referenced in this task, see TCP charts and TCP dimensions and metrics.
-
To view an application service’s client-side data:
-
Go to Applications > APPLICATIONS
-
Select the application name that hosts your TCP application service.
-
Select the name of the TCP application service.
The application service’s dashboard is displayed. Ensure the ANALYTICS tab at the center of the screen is selected
-
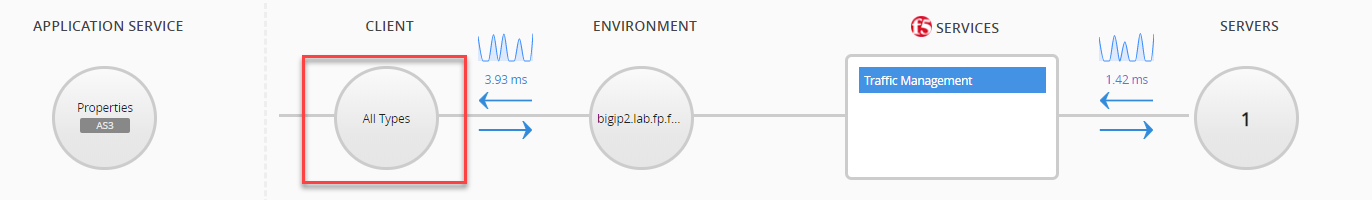
Click the icon All Types under CLIENT.
-
Using the menu to the left of the chart, select Client Side Connections.
The chart displays the client-side connection status over the selected time period.
-
To view the client IPs requesting access to your application, expand the dimension Remote Host IP Address, located in the dimension pane to the right of the chart.
You can select a specific IP to filter data displayed in the charts and other dimensions.
-
To view general traffic data, from the client-side, select any of the charts located in the menu to the left.
-
-
To view client-side data for all TCP application services:
-
Go to Monitoring > DASHBOARDS > Local Traffic > TCP.
-
From the dimensions pane, to the right of the charts, expand Requests Side and select Client-Side.
This action will filter all charts and dimensions on the screen to only display client-side request data.
-
To view the client IPs requesting access to your applications, expand the dimension Remote Host IP Address.
The list displays all client IP addresses detected in traffic over the selected time period. You can select one or more IP addresses to further filter the chart and remaining dimension data.
-