Updated Date: 07/07/2026
System Settings
You can access system settings in the webUI.
You can view active system alarms and events in the webUI and CLI.
The Alarms & Events screen lists alert information for system components (such as PSU, firmware, and LCD) that have currently crossed a performance or health threshold. Use this screen to identify the specific component that is affected.
-
Log in to the webUI using an account with admin access.
-
On the left, click SYSTEM SETTINGS > Alarm & Events.
-
Choose from one of these actions:
- To refresh the alarms or events list, click the Refresh icon on the right of the screen.
- To display events result by time preference, click the down arrow next to the Refresh icon and select a value from the list. The default value is one hour. For example, select five minutes to display any event that occurred in the last five minutes.
- To display events by severity, select a value from the Severity list. The default value is WARNING.
Option Description Emergency Emergency system panic messages Alert Serious errors that require administrator intervention Critical Critical errors, including hardware and file system failures Error Non-critical, but possibly important, error messages Warning Warning messages that should be logged and reviewed Notice Messages that contain useful information, but might be ignored Informational Messages that contain useful information, but might be ignored Debug Detailed messages used for troubleshooting
You can view information about active system alarm conditions from the CLI.
-
Connect using SSH to the management IP address.
-
Log in to the command line interface (CLI) of the system using an account with admin access.
When you log in to the system, you are in user (operational) mode.
-
View a list of active system alarm conditions.
show system alarms | tabThis example shows a power supply unit (PSU) redundancy fault:
appliance-1# show system alarms | tab
ID     RESOURCE        SEVERITY  TEXT                           TIME CREATED
–––––––––––––––––––––––––––––––––––––––––––––––––––––––––––––––––––––––––––––––––––––––––––––––––––––––––––––––-
65793  psu-1           ERROR     PSU fault detected             2022-06-01-11:11:11.999825828 UTC
You can access management interface settings in the webUI.
You can view or change settings for the management interface from the webUI.
You can view or change settings for the management interface from the webUI.
-
Log in to the webUI using an account with admin access.
-
On the left, click SYSTEM SETTINGS > Management Interface.
-
For DHCP, select either Enabled or Disabled.
-
Under IPv4 and IPv6, you can configure either one management IP address type or both types for the system:
-
For IP Address, enter IP addresses in the appropriate sections for IPv4 or IPv6, or in both sections, if using both.
The supported IPv4 format is, for example, 192.0.2.101. The supported IPv6 format is, for example, 2001:DB80:3238:DFE1:63::FEFB
-
For Prefix Length, specify a number from 1-32.
-
For Gateway, enter the gateway IP address.
-
-
Under Interface Settings, you can configure the management port:
-
For State, select either Enabled or Disabled.
-
For Auto-negotiation, select either Enabled or Disabled.
If you enable auto-negotiation, port speed and duplex mode are set automatically.
-
For Port Speed, select one of these options: SPEED_1GB, SPEED_10MB, or SPEED_100MB.
-
For Duplex Mode, select FULL or HALF.
-
-
Click Save.
You can configure the management interface from the CLI.
-
Connect to the system using a management console or console server.
Note: The default baud rate and serial port configuration is 19200/8-N-1.
-
Log in to the command line interface (CLI) of the system using an account with admin access.
When you log in to the system, you are in user (operational) mode.
-
Change to config mode.
configThe CLI prompt changes to include
(config). -
Enable and set general properties for the management interface.
interfaces interface mgmt config { disabled | enabled } description <*interface-description*>In this example, you enable the management interface, add a description, and set the type:
appliance-1(config)# interfaces interface mgmt config enabled description "Mgmt Interface" -
Exit to the top level of the configuration hierarchy.
top -
Configure Ethernet properties for the management interface.
interfaces interface mgmt config auto-negotiate { false | true } duplex-mode { FULL | HALF } port-speed { SPEED\_1GB | SPEED\_10MB | SPEED\_100MB }In this example, you enable the management interface, add a description, and set the type:
appliance-1(config)# interfaces interface mgmt config auto-negotiate true duplex-mode FULL port-speed SPEED_1GB -
Commit the configuration changes.
commit -
Return to user (operational) mode.
end -
Verify that the management interface is configured.
show interfaces interface mgmtA summary similar to this example displays:
appliance-1# show interfaces interface mgmt
interfaces interface mgmt
 state name  mgmt
 state type  ethernetCsmacd
 state enabled true
 state oper-status UP
 ethernet state auto-negotiate true
 ethernet state duplex-mode FULL
 ethernet state port-speed SPEED_1GB
 ethernet state hw-mac-address 00:12:a1:34:56:78
 ethernet state negotiated-duplex-mode FULL
 ethernet state negotiated-port-speed SPEED_1GB
You can access settings for hardening the security of your system in the webUI.
An allow list enables you to specify either specific IPv4 or IPv6 addresses, ports, or a netmask as an accepted source that can access the system.
When the IP address is configured and saved to the system allow list, only traffic coming from that IP address and port is accepted by the system’s management interface. You can also edit or delete entries in the allow list after you have configured them.
You can configure the system allow list from the webUI. To edit an existing allow list entry, select the IP address that you want to edit. You cannot change the designated name, but you can change all other fields.
-
Log in to the webUI using an account with admin access.
-
On the left, click SYSTEM SETTINGS > System Security.
-
In the Allowed IP Addresses area, click Add to add an IP address to the allow list.
-
For Name, enter a descriptive name for the IP address.
-
For IPv4/IPv6, select IPv4 or IPv6.
-
For Address, enter the IP address to be added to the allow list.
-
For Prefix Length, enter or select the prefix length.
The prefix length values must be between 1 and 32 for IPv4 and between 1 and 128 for IPv6.
-
For Port, select a port number for the IP address.
Available options are:
- 443 (HTTPS): Allow only HTTP with SSL traffic on this IP address.
- 80 (HTTP): Allow only HTTP traffic on this IP address.
- 8888 (RESTCONF): Allow only RESTCONF traffic on this IP address.
- 161 (SNMP): Allow only SNMP traffic on this IP address.
- 7001 (VCONSOLE): Allow only VCONSOLE traffic on this IP address.
- 22 (SSH): Allow only SSH traffic on this IP address.
-
Click Save & Close.
You can configure the system allow list from the CLI.
-
Log in to the command line interface (CLI) of the system using an account with admin access.
When you log in to the system, you are in user (operational) mode.
-
Change to config mode.
configThe CLI prompt changes to include
(config). -
Configure the system to allow traffic only from specified IP addresses.
system allowed-ips allowed-ip <*allowlist-profile-name*> config { ipv4 | ipv6 } address <*ip-address*> port <*port-number*>prefix-length <*subnet-prefix-length*>Important: This is applicable only for ports 161 (SNMP), 8888 (RESTCONF), 443 (HTTPS), 80 (HTTP), 7001 (VCONSOLE), and 22 (SSH).
This example adds a specified IPv4 address to the system allow list:
appliance-1(config)# system allowed-ips allowed-ip test config
  ipv4 address 192.0.2.33 port 161 prefix-length 32
This example adds a netmask to the system allow list:
appliance-1(config)# system allowed-ips allowed-ip test config
  ipv4 address 192.0.2.0 port 161 prefix-length 24
This example restricts access to the management interface (SSH) to only the specified IP address:
appliance-1(config)# system allowed-ips allowed-ip test config ipv4 address 192.0.2.33 port 22 prefix-length 32 -
Commit the configuration changes.
commit
You can run the system in appliance mode. Appliance mode adds a layer of security removing user access to Root and Bash. Enabling appliance mode disables all Root and Bash shell access for the system.
You can enable appliance mode at each of these levels:
- System
- Tenant
Appliance mode is disabled at all levels, by default. You can enable it from the webUI or the CLI. The appliance mode option for the system is available to users with admin access under SYSTEM SETTINGS > General in the webUI. For tenants, it is available in the webUI under TENANT MANAGEMENT > Tenant Deployments.
These are the effects of enabling appliance mode at each of the different levels.
System-level appliance mode
- Root or Bash access is disabled on the system.
- Console access: Root or Bash access is disabled on the system. Users can log in to the system CLI from the console using an admin account.
Tenant appliance mode
- Root access to the tenant is disabled by all means. Bash access is disabled for users (with a terminal shell flag enabled) inside the tenant.
- Users can access the tenant only through the webUI or the CLI.
- Tenant console access: Users can log in to the CLI from the virtual console using an admin account (with a terminal shell flag enabled).
You can enable or disable appliance mode from the webUI. Enable appliance mode to disable all root and Bash shell access.
Note: The appliance mode option for tenants is available in the webUI under TENANT MANAGEMENT > Tenant Deployments.
-
Log in to the webUI using an account with admin access.
-
On the left, click SYSTEM SETTINGS > System Security.
-
, in the Appliance Mode area, for Enable/Disable, select either Enabled or Disabled.
The default value is Disabled.
-
Click Save.
You can configure appliance mode from the CLI if you want to disable all root and Bash shell access.
Note: For greater security, it is highly recommended that you configure the system to run in appliance mode.
Note: The appliance mode option for tenants is available in the CLI using the tenants tenant <*tenant-name*> config appliance-mode command sequence.
-
Connect using SSH to the management IP address.
-
Log in to the command line interface (CLI) of the system using an account with admin access.
When you log in to the system, you are in user (operational) mode.
-
Change to config mode.
configThe CLI prompt changes to include
(config). -
Enable appliance mode.
system appliance-mode config [ disabled | enabled ]In this example, you enable appliance mode on the system controllers:
appliance-1(config)# system appliance-mode config enabled -
Commit the configuration changes.
commit
The LCD touchscreen enables you to view system status and manage the system without attaching a console or network cable. You can configure the LCD to meet security requirements by changing to a more restrictive operational mode.
The LCD touchscreen supports these modes:
Allows access to all options.
Allows access only to management and setup options. A padlock icon displays next to limited options.
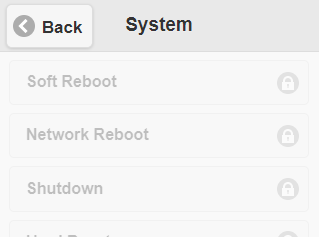
Does not allow access to any options and displays only an image to indicate that the LCD touchscreen is disabled.
You can configure the operational mode of the touchscreen LCD from the webUI.
-
Log in to the webUI using an account with admin access.
-
On the left, click SYSTEM SETTINGS > System Security.
-
In the LCD area, for Mode, select one of these options:
- Select Disabled to not allow access to any options; displays only an image to indicate that the LCD touchscreen is disabled.
- Select Secure to allow access only to management and setup options; displays a padlock icon next to limited options.
- Select Standard to allow access to all options.
-
Click Save.
Cryptographic agility on F5 rSeries systems enables you to replace cryptographic implementations for the httpd and sshd services. This applies to the F5OS management interface.
You can configure the cryptographic implementations on the system for the httpd and sshd services from the webUI.
-
Log in to the webUI using an account with admin access.
-
On the left, click SYSTEM SETTINGS > System Security.
-
In the Services area, for httpd Cipher Suites, enter the SSL cipher suites used for the httpd service.
You can specify more than one cipher suite by separating the cipher suite names with a colon.
-
For sshd Ciphers, enter the ciphers to use for the sshd service.
For example, aes128-cbc or aes128-ctr. The cipher string can take several additional forms. It can consist of a single cipher suite or a list of cipher suites containing a certain algorithm, or cipher suites of a certain type. You can combine lists of cipher suites into a single cipher string by enclosing them in square brackets and delimiting them with a space.
-
For sshd KEX Algorithms, enter the key exchange algorithms used for the sshd service.
For example, diffie-hellman-group14-sha1 or diffie-hellman-group14-sha256. You can combine lists of KEX algorithms into a single string by enclosing them in square brackets and delimiting them with a space.
-
For sshd MAC Algorithms, enter the MAC algorithms used for the sshd service.
For example, hmac-sha2-512 or AEAD_AES_128_GCM. You can combine lists of MAC algorithms into a single string by enclosing them in square brackets and delimiting them with a space.
-
Click Save.
You can show the current crypto configuration on the system from the CLI.
-
Connect using SSH to the management IP address.
-
Log in to the command line interface (CLI) of the system using an account with admin access.
When you log in to the system, you are in user (operational) mode.
-
Show the current configuration.
show system security services service stateA summary similar to this example displays:
appliance-1# show system security services service state
system security services service httpd
 state ssl-ciphersuite ECDHE-RSA-AES256-GCM-SHA384:ECDHE-ECDSA-AES256-GCM-SHA384:
 ECDHE-RSA-AES256-SHA384:ECDHE-ECDSA-AES256-SHA384:ECDHE-RSA-AES256-SHA:ECDHE-ECDSA-AES256-SHA:
 DHE-DSS-AES256-GCM-SHA384:DHE-RSA-AES256-GCM-SHA384:DHE-RSA-AES256-SHA256:DHE-DSS-AES256-SHA256:DHE-RSA-AES256-SHA:DHE-DSS-AES256-SHA:DHE-RSA-CAMELLIA256-SHA:DHE-DSS-CAMELLIA256-SHA:ECDH-RSA-AES256-GCM-SHA384:ECDH-ECDSA-AES256-GCM-SHA384:ECDH-RSA-AES256-SHA384:ECDH-ECDSA-AES256-SHA384:ECDH-RSA-AES256-SHA:ECDH-ECDSA-AES256-SHA:AES256-GCM-SHA384:AES256-SHA256:AES256-SHA:CAMELLIA256-SHA:PSK-AES256-CBC-SHA:ECDHE-RSA-AES128-GCM-SHA256:ECDHE-ECDSA-AES128-GCM-SHA256:ECDHE-RSA-AES128-SHA256:ECDHE-ECDSA-AES128-SHA256:ECDHE-RSA-AES128-SHA:ECDHE-ECDSA-AES128-SHA:DHE-DSS-AES128-GCM-SHA256:DHE-RSA-AES128-GCM-SHA256:DHE-RSA-AES128-SHA256:DHE-DSS-AES128-SHA256:DHE-RSA-AES128-SHA:DHE-DSS-AES128-SHA:DHE-RSA-CAMELLIA128-SHA:DHE-DSS-CAMELLIA128-SHA:ECDH-RSA-AES128-GCM-SHA256:ECDH-ECDSA-AES128-GCM-SHA256:ECDH-RSA-AES128-SHA256:ECDH-ECDSA-AES128-SHA256:ECDH-RSA-AES128-SHA:ECDH-ECDSA-AES128-SHA:AES128-GCM-SHA256:AES128-SHA256:AES128-SHA:CAMELLIA128-SHA:PSK-AES128-CBC-SHA
system security services service sshd
 state ciphers [ aes128-cbc aes128-ctr aes128-gcm@openssh.com aes256-cbc aes256-ctr
  aes256-gcm@openssh.com ]
 state kexalgorithms [ diffie-hellman-group14-sha1 diffie-hellman-group14-sha256
 diffie-hellman-group16-sha512 ecdh-sha2-nistp256 ecdh-sha2-nistp384 ecdh-sha2-nistp521 ]
You can configure the sshd service from the CLI.
-
Connect using SSH to the management IP address.
-
Log in to the command line interface (CLI) of the system using an account with admin access.
When you log in to the system, you are in user (operational) mode.
-
Change to config mode.
configThe CLI prompt changes to include
(config). -
Configure the sshd service.
system security services service sshd config ciphers [ <*string*> ] kexalgorithms [ <*string*> ] macs [ <*string*> ]These are the available configuration options:
Option
Description
ciphers
User-specified ciphers. For example, aes128-cbc or aes128-ctr.The cipher string can take several additional forms. It can consist of a single cipher suite or a list of cipher suites containing a certain algorithm, or cipher suites of a certain type. You can combine lists of cipher suites into a single cipher string using the + character as a logical AND operation.
kexalgorithms
User-specified key exchange algorithms. For example, diffie-hellman-group14-sha1 or diffie-hellman-group14-sha256.You can combine lists of KEX algorithms into a single string using the + character as a logical AND operation.
macs
User-specified MAC algorithms. For example, hmac-sha2-512 or AEAD_AES_128_GCM.You can combine lists of MAC algorithms into a single string using the + character as a logical AND operation.
This example shows configuring the sshd service:
appliance-1(config)# system security services service ssh config ciphers [ aes128-ctr aes256-cbc ] kexalgorithms [ ecdh-sha2-nistp521 echd-sha2-nistp384 ] macs [ hmac-sha1 ] -
Commit the configuration changes.
commit
After you commit the change, you are prompted to confirm the change. The service will then restart.
You can configure the SSL cipher suites used for the httpd service from the CLI.
-
Connect using SSH to the management IP address.
-
Log in to the command line interface (CLI) of the system using an account with admin access.
When you log in to the system, you are in user (operational) mode.
-
Change to config mode.
configThe CLI prompt changes to include
(config). -
Configure one or more cipher suites for the httpd service.
system security services service httpd config ssl-ciphersuite <*string*>In this example, you indicate that the system uses only the specified cipher suite:
appliance-1(config)# system security services service httpd config
  ssl-ciphersuite ECDHE-RSA-AES256-GCM-SHA384
In this example, you specify more than one cipher suite by separating the cipher suite names with a colon:
appliance-1(config)# system security services service httpd config ssl-ciphersuite ECDHE-RSA-AES128-SHA:ECDHE-RSA-AES256-SHA -
Commit the configuration changes.
commit
After you commit the change, you are prompted to confirm the change. The service will then restart.
When you configure ciphers for httpd, you can use multiple formats. You can specify a single cipher suite, such as RC4-SHA. You can also represent a list of cipher suites containing a certain algorithm or cipher suites of a certain type using a shortened name. For example, SHA1 represents all cipher suites using the digest algorithm SHA1, and SSLv3 represents all SSLv3 algorithms. You can combine lists of cipher suites into a single cipher string using the + character as a logical AND operation. For example, SHA1+DES represents all cipher suites containing the SHA1 and DES algorithms.
These are the allowed SSL cipher suites for general appliances:
- ECDHE-RSA-AES256-GCM-SHA384
- ECDHE-ECDSA-AES256-GCM-SHA384
- ECDHE-RSA-AES256-SHA384
- ECDHE-ECDSA-AES256-SHA384
- ECDHE-RSA-AES256-SHA
- ECDHE-ECDSA-AES256-SHA
- DHE-DSS-AES256-GCM-SHA384
- DHE-RSA-AES256-GCM-SHA384
- DHE-RSA-AES256-SHA256
- DHE-DSS-AES256-SHA256
- DHE-RSA-AES256-SHA
- DHE-DSS-AES256-SHA
- DHE-RSA-CAMELLIA256-SHA
- DHE-DSS-CAMELLIA256-SHA
- ECDH-RSA-AES256-GCM-SHA384
- ECDH-ECDSA-AES256-GCM-SHA384
- ECDH-RSA-AES256-SHA384
- ECDH-ECDSA-AES256-SHA384
- ECDH-RSA-AES256-SHA
- ECDH-ECDSA-AES256-SHA
- AES256-GCM-SHA384
- AES256-SHA256
- AES256-SHA
- CAMELLIA256-SHA
- PSK-AES256-CBC-SHA
- ECDHE-RSA-AES128-GCM-SHA256
- ECDHE-ECDSA-AES128-GCM-SHA256
- ECDHE-RSA-AES128-SHA256
- ECDHE-ECDSA-AES128-SHA256
- ECDHE-RSA-AES128-SHA
- ECDHE-ECDSA-AES128-SHA
- DHE-DSS-AES128-GCM-SHA256
- DHE-RSA-AES128-GCM-SHA256
- DHE-RSA-AES128-SHA256
- DHE-DSS-AES128-SHA256
- DHE-RSA-AES128-SHA
- DHE-DSS-AES128-SHA
- DHE-RSA-CAMELLIA128-SHA
- DHE-DSS-CAMELLIA128-SHA
- ECDH-RSA-AES128-GCM-SHA256
- ECDH-ECDSA-AES128-GCM-SHA256
- ECDH-RSA-AES128-SHA256
- ECDH-ECDSA-AES128-SHA256
- ECDH-RSA-AES128-SHA
- ECDH-ECDSA-AES128-SHA
- AES128-GCM-SHA256
- AES128-SHA256
- AES128-SHA
- CAMELLIA128-SHA
- PSK-AES128-CBC-SHA
These are the allowed SSL cipher suites for systems that have a FIPS software license applied. It does not apply to the F5 r5900-DF or r10900-DF platforms that have an embedded FIPS hardware security module (HSM).
- ECDHE-RSA-AES128-GCM-SHA256
- ECDHE-RSA-AES256-GCM-SHA384
- ECDHE-RSA-AES128-SHA
- ECDHE-RSA-AES256-SHA
- ECDHE-RSA-AES128-SHA256
- ECDHE-RSA-AES256-SHA384
- ECDHE-ECDSA-AES128-GCM-SHA256
- ECDHE-ECDSA-AES256-GCM-SHA384
- ECDHE-ECDSA-AES128-SHA
- ECDHE-ECDSA-AES256-SHA
- ECDHE-ECDSA-AES128-SHA256
- ECDHE-ECDSA-AES256-SHA384
When you configure ciphers for sshd, you enclose the cipher string in square brackets and include more than one by separating them with a space. These ciphers are allowed on the system.
- ecdh-sha2-nistp256
- ecdh-sha2-nistp384
- ecdh-sha2-nistp521
- diffie-hellman-group16-sha512
- diffie-hellman-group14-sha256
- diffie-hellman-group14-sha1
- aes128-ctr
- aes256-ctr
- aes128-gcm@openssh.com
- aes256-gcm@openssh.com
- aes128-cbc
- aes256-cbc
- umac-64-etm@openssh.com
- umac-128-etm@openssh.com
- hmac-sha2-256-etm@openssh.com
- hmac-sha1-512-etm@openssh.com
- hmac-sha1-etm@openssh.com
- umac-64@openssh.com
- umac-128@openssh.com
- hmac-sha2-256
- hmac-sha2-512
- hmac-sha1
For security purposes, you can configure how long management sessions can remain idle before you are logged out of the system. If you are connected using an SSH connection, the system closes the SSH connection after this time expires.
You can configure how long management sessions can remain idle before you are logged out of the system from the webUI. If you are connected using an SSH connection, the system closes the SSH connection after this time expires.
-
Log in to the webUI using an account with admin access.
-
On the left, click SYSTEM SETTINGS > System Security.
-
In the Services area, for CLI Idle Timeout, enter a time, in seconds, for how long management sessions can remain idle before they time out.
A value of 0 (zero) sets the time to infinity, so the user is never logged out. The timeout can be a value from 0 through 8192 seconds. The default value is 1800 seconds (30 minutes).
-
Click Save.
You can configure how long management sessions can remain idle before you are logged out of the system from the CLI. If you are connected using an SSH connection, the system closes the SSH connection after this time expires. You can also configure how long the system is inactive for a root user connected to the system or via SSH or console before the user is logged out of the system.
-
Log in to the command line interface (CLI) of the system using an account with admin access.
When you log in to the system, you are in user (operational) mode.
-
Change to config mode.
configThe CLI prompt changes to include
(config). -
Configure the CLI session idle timeout setting for an admin user connected to the system.
system settings config idle-timeout <*time-in-seconds*>A value of 0 (zero) sets the time to infinity, so the user is never logged out. The timeout can be a value from 0 through 8192 seconds. The default value is 1800 seconds (30 minutes).
This example sets an idle timeout of 3600 seconds (one hour):
appliance-1(config)# system settings config idle-timeout 3600 -
Configure the CLI session idle timeout setting for an admin or a root user connected via either SSH or console.
system settings config sshd-idle-timeout <*time-in-seconds*>A value of 0 (zero) sets the time to infinity, so the user is never logged out. The timeout can be a value from 0 through 8192 seconds. The default value is 0 (zero).
This example sets an SSH system idle timeout of 3600 seconds (one hour):
appliance-1(config)# system settings config sshd-idle-timeout 3600 -
Commit the configuration changes.
commit
The Software Management screen on the webUI includes options for uploading, importing and updating Base OS software for the system.
You can manage software images from the webUI.
-
Log in to the webUI using an account with admin access.
-
On the left, click SYSTEM SETTINGS > Software Management.
-
To import a Base OS image:
-
Click Import.
A popup opens.
-
For URL, enter the URL of the remote image server.
F5 recommends that the remote host be an HTTPS server with PUT/POST enabled and have a valid CA-signed certificate. You can opt to select the Ignore Certificate Warnings check box if you want to skip the certificate check.
-
For Username, type the user name for an account on the remote image server, if required.
-
For Password, type the password for the account, if required.
-
Select Ignore Certificate Warnings to skip the certificate check.
-
Click Add Image.
Note: Depending on the image file size and network availability, the import might take a few minutes. When the import is successful, the software image is listed in the webUI.
-
-
To upload a Base OS image that you have downloaded to your local workstation:
-
Click Upload.
-
Navigate to the image file and select it.
-
Click Open.
-
-
To delete a Base OS image, select the image and click Delete.
Software images that are in use cannot be deleted.
View the status of image imports under Image Import Status, which shows information about Remote Host, File, Status, and Time.
Before you begin, you must also have added or uploaded an updated software image before you can do the update.
You can update Base OS software while the system is up and running from the webUI.
Important: During a software update, there is an interruption to traffic, so F5 recommends that you perform the update during a maintenance window
-
Log in to the webUI using an account with admin access.
-
On the left, click SYSTEM SETTINGS > Software Management.
-
In the Update Base OS Software section, for Update Software:
- To install a full F5OS-A version release, select Bundled.
- To install F5OS-A and service version releases independently, select Unbundled.
-
For ISO Image, select the full version release ISO image from the drop-down.
This field is available when Bundled is selected.
-
For Base OS Version, select the F5OS version from the drop-down.
This field is available when Unbundled is selected.
-
For Service Version, select the service version release from the drop-down.
This field is available when Unbundled is selected.
You can install independent system or service packages on the system from the CLI.
-
Log in to the command line interface (CLI) of the system using an account with admin access.
When you log in to the system, you are in user (operational) mode.
-
Change to config mode.
configThe CLI prompt changes to include
(config). -
Verify the version compatibility of a package on the system.
system packages package <*package-name*> check-version version <*version*>This example checks the version compatibility of a package:
appliance-1(config)# system packages package optics-mgr-independent-pkg check-version version 4.0.0.2022_08_02_16_17_05.s3a9dffb4 response Compatibility verification succeeded. -
Install a new version of a package.
system packages package <*package-name*> set-version version <*version*> proceed { no | yes }This example sets a new version of a package:
appliance-1(config)# system packages package optics-mgr-independent-pkg set-version version 4.0.0.2022_08_02_16_17_05.s3a9dffb4 proceed Possible completions: no yes -
Commit the configuration changes.
commit
You can remove independent system or service packages from the system from the CLI.
-
Log in to the command line interface (CLI) of the system using an account with admin access.
When you log in to the system, you are in user (operational) mode.
-
Change to config mode.
configThe CLI prompt changes to include
(config). -
Remove an independent package from the system.
system packages package <*package-name*> remove version <*version*>This example removes a specified package version:
appliance-1(config)# system packages package optics-mgr-independent-pkg remove version 4.0.0.2022_08_02_16_17_05.s3a9dffb4 -
Commit the configuration changes.
commit
The DNS screen on the webUI includes options for configuring Domain Name System (DNS) lookup servers and search domains for use with the system.
You can configure DNS for the system from the webUI. This is used for name resolution such as when setting up the system.
-
Log in to the webUI using an account with admin access.
-
On the left, click SYSTEM SETTINGS > DNS.
-
Under DNS Lookup Servers, specify the name servers that the system uses to validate DNS lookups, and resolve host names. For each name server you want to add:
-
Click Add.
-
For Lookup Server, enter the IP address of the name server that you want to add to the list.
-
Click Save & Close.
-
-
Under DNS Search Domains, specify the domains that the system searches for local domain lookups and to resolve local host names. For each domain you want to add:
-
Click Add.
-
For Search Domain, enter the domain name of the name server that you want to add to the list.
For example, DNSsearch.com.
-
Click Save & Close.
-
DNS lookup servers and search domains are now specified for the system.
You can configure DNS for the system from the CLI. This is used for name resolution such as when setting up the system.
-
Connect using SSH to the management IP address.
-
Log in to the command line interface (CLI) of the system using an account with admin access.
When you log in to the system, you are in user (operational) mode.
-
Change to config mode.
configThe CLI prompt changes to include
(config). -
Configure a DNS lookup server.
system dns servers server <*ip-address*> port <*port*>This example configures a DNS server at 192.0.2.20:
appliance-1(config)# system dns servers server 192.0.2.20 -
Commit the configuration changes.
commit
The webUI includes options for configuring remote log servers and the log severity level for individual software components and services.
From the webUI you can generate a system report, or QKView file, to collect configuration and diagnostic information from the rSeries system if you have any concerns about your system operation. The QKView file contains machine-readable (JSON) diagnostic data and combines the data into a single compressed tar.gz format file. You can upload the QKView file to F5 iHealth where you can get help to verify proper operation of the system and get help with troubleshooting and understanding any issues you might be having and ensure that the system is operating at its maximum efficiency.
You can view event logs and configure secure remote logging from the CLI. You can also send host log files, which are in the /var/log directory, as well as audit.log files to the remote server from the CLI.
You can add and display information about configured remote log servers from the webUI. You can also change the log severity level for individual software components and services.
-
Log in to the webUI using an account with admin access.
-
On the left, click SYSTEM SETTINGS > Log Settings.
-
To add access to a Remote Log Server, click Add.
-
In the Server field, enter the IPv4 address, IPv6 address, or fully qualified domain name (FQDN) of the remote server. After the remote log server is saved, you cannot modify the server address.
-
In the Port field, enter the port number of the remote server.
The default port value is 514.
-
For Protocol, select UDP or TCP to choose between TCP or UDP input. When the TCP protocol is selected, the Authentication field displays.
-
From the Facility list, select LOCAL0.
F5OS supports only the LOCAL0 logging facility. All logs are directed to this facility, and it is the only one that you can use for remote logging.
-
From the Severity list, select the severity level of the messages to log.
Option Description Emergency Emergency system panic messages Alert Serious errors that require administrator intervention Critical Critical errors, including hardware and file system failures Error Non-critical, but possibly important, error messages Warning Warning messages that should be logged and reviewed Notice Messages that contain useful information, but might be ignored Informational Messages that contain useful information, but might be ignored Debug Verbose messages used for troubleshooting -
For Authentication, select the enable or disable option from the list. The default value is Disabled. This option is visible when the TCP protocol is selected while configuring the remote log server. If the UDP protocol is selected, the authentication value is saved as N/A.
-
Click Save & Close.
-
To delete a remote log server, select the server and click Delete.
-
To view the Host Log Settings, click Show.
-
For Host Log Forwarding, select the enable or disable radio button for remote forwarding. The default value is Disabled. When host log forwarding is enabled, the Include Standby Controller field displays.
-
For Selectors, select the required facility and severity options from the list. To add more selectors, click the add + icon. To remove the existing selectors, click the remove (X) icon.
-
To add the required host log files to the Selected Files panel, at the chassis level, click the required host log files checkboxes.
At the chassis partition level, you can only view the already selected and locked host files.
The Selected Files option allows the host logs files to be forwarded from the directory and subdirectories.
-
For Custom Log File, enter the log file in the text box and click Add to manually add host log file names to the Selected Files panel.
-
For TLS Certificate & Key, click Show. It displays TLS Certificate and TLS Key options. If the authentication value is set as enabled for any of the remote log servers, you cannot be able to clear the TLS configuration fields.
-
For CA Bundles, click Add to enter the name and TLS CA certificate. When any of the remote server authentication is enabled, you cannot delete the CA bundle.
-
On the Log Settings screen, review the software component log levels for individual software components and adjust them as needed. Click Save if you made changes.
The log levels determine at what level events (and all higher levels) are logged for each service. Informational is the default so all except debug-level events are logged.
-
Click Save to save the log settings.
The system logs events to the appliance.log file located in the log/host directory. To list files and view the contents of log files, you use the file command from the CLI.
-
Connect using SSH to the management IP address.
-
Log in to the command line interface (CLI) of the system using an account with admin access.
When you log in to the system, you are in user (operational) mode.
-
List all files in the log directory.
file list path [ log/confd/ | log/host/ | log/system/ }This example shows an excerpt of the contents of the
log/host/directory:appliance-1# file list path log/host entries { name anaconda/ date Thu May 12 17:01:36 UTC 2022 size 4.0KB } entries { name ansible.log date Fri Jun 17 16:18:02 UTC 2022 size 0B } entries { name appliance.log date Fri Jun 17 16:18:19 UTC 2022 size 9.8KB } entries { name audit/ date Fri Jun 17 14:59:04 UTC 2022 size 4.0KB } entries { name boot.log date Thu May 12 17:02:35 UTC 2022 size 105B } ... -
Show the contents of a log file.
file show [ log/confd/<*filename*> | log/host/<*filename*> | log/system/<*filename*> ]This example shows the contents of the
log/host/boot.logfile:appliance-1# file show log/host/boot.log May 12 10:02:35 localhost NET[1605]: /etc/sysconfig/network-scripts/ifup-post : updated /etc/resolv.conf -
Show only the most recent entries in a log file.
file tail [ log/confd/<*filename*> | log/host/<*filename*> | log/system/<*filename*> ]This example shows the last ten lines of the
appliance.logfile and uses the-foption to append output as the file grows:appliance-1# file tail -f log/host/appliance.log 2022-06-17 16:18:03.267761 - OMD log is initialized 2022-06-17 16:18:03.267761 - 8:-738199808 - applianceMainEventLoop::Orchestration manager startup. 2022-06-17 16:18:03.270244 - 8:-754985216 - Can now ping appliance-1.chassis.local (100.65.60.1). 2022-06-17 16:18:03.723485 - 8:-754985216 - Successfully ssh'd to appliance 127.0.0.1. 2022-06-17 16:18:14.399076 - 8:-738199808 - Appliance 1 is ready in k3s cluster. 2022-06-17 16:18:14.399095 - 8:-738199808 - K3S cluster is ready. appliance-flannel_image|localhost:2003/appliance-flannel:0.13.0 No Image Changes Found for normal reboot appliance-multus_image|localhost:2003/appliance-multus:3.6.3 No Image Changes Found for normal reboot _
The system logs events to the appliance.log file located in the var/log directory and enables you to send these logs to a remote server. By configuring secure remote logging from the CLI, you can send logs in audit.log to a remote server. Secure logging is disabled by default.
-
Connect using SSH to the management IP address.
-
Log in to the command line interface (CLI) of the system using an account with admin access.
When you log in to the system, you are in user (operational) mode.
-
Change to config mode.
configThe CLI prompt changes to include
(config). -
Configure secure remote logging. The default value is disabled.
system logging remote-servers remote-server <*ip-address*> config proto { udp | tcp | remote-port <*port-number*> authentication { disabled | enabled }The default protocol is upd, and the default port number is 514.
This example enables secure remote logging:
appliance-1(config)# system logging remote-servers remote-server 192.0.2.58 config proto tcp remote-port 80 authentication enabled -
Add certificate or key details for secure remote logging.
system logging tls { certificate | key } <*string*> -
Add CA bundle details for secure remote logging.
system logging tls ca-bundles ca-bundle <*name*> config name <*name*> content <*ca-cert-contents*>Note: The certificate bundle that you specify must include the certificate chain of the certificate authority.
-
Commit the configuration changes.
commit -
Return to user (operational) mode.
end -
Verify the authentication, certificate, key, and CA bundle configuration.
show running-config system logging tls { certificate | key | ca-bundles } <*string*>
You can disable secure remote logging from the CLI.
-
Connect using SSH to the management IP address.
-
Log in to the command line interface (CLI) of the system using an account with admin access.
When you log in to the system, you are in user (operational) mode.
-
Change to config mode.
configThe CLI prompt changes to include
(config). -
Disable secure remote logging.
system logging remote-servers remote-server <*ip-address*> config proto { udp | tcp | remote-port <*port-number*> authentication { disabled | enabled }This example disables secure remote logging:
appliance-1(config)# system logging remote-servers remote-server 192.0.2.58 config proto tcp remote-port 80 authentication disabled -
Remove authentication details from secure remote logging.
no system logging remote-servers remote-server <*ip-address*> config authentication -
Remove certificate or key details from secure remote logging.
no system logging tls { certificate | key } <*string*> -
Remove CA bundle details from secure remote logging.
no system logging tls ca-bundles ca-bundle -
Commit the configuration changes.
commit -
Return to user (operational) mode.
end -
Veify the authentication, certificate, key, and CA bundle configuration.
show running-config system logging tls { certificate | key | ca-bundles } <*string*>
You can import, export, download, or delete files asynchronously depending on which directory you select to work in. All file transfers are done using the HTTPS protocol.
You can import a file from an external server into the system from either the webUI or the CLI. HTTPS is the supported protocol. The remote host should be an HTTPS server with PUT/POST enabled and have a valid CA-signed certificate.
Note: If you want to import the contents of a tar file, you need to extract the contents first before you can import them onto the F5 system.
You can import files into these directories on the system:
- configs/
- diags/shared
- images/import
- images/staging
- images/tenant
You can download files in these directories from the system to your local workstation from the webUI:
- configs
- diags/core
- diags/crash
- diags/shared
- log/confd
- log/system
You can upload files in these directories from your local workstation to the system from the webUI:
- configs
- images/staging
- images/tenant
You can export a file from the system to an external server from either the webUI or the CLI. HTTPS is the supported protocol. The remote host should be an HTTPS server with PUT/POST enabled and have a valid CA-signed certificate.
You can export files into these directories from the system:
- configs
- log/
- log/confd
- log/controller
- log/host
- log/system
- diags/
- diags/core
- diags/crash
- diags/shared
- images/
- images/import
- images/staging
- images/tenant
You can delete files (to which you have file permissions) on the system only from the diags/shared or configs directories from either the webUI or the CLI.
File Utilities are available in the webUI. You can use File Utilities to upload, download, import, export, and/or delete files asynchronously depending on which directory you select to work in. All file transfers are done using HTTPS protocol.
-
Log in to the webUI using an account with admin access.
-
On the left, click SYSTEM SETTINGS > File Utilities.
-
From the Base Directory list, browse the directories and click subfolders to view their contents and the commands that are available from each one.
From a subfolder, click the left arrow next to the path to navigate back to the main folder.
-
To import a file:
-
Click Import.
-
In the popup, enter the URL of the file to import.
-
Provide the Username and Password only if required by the remote host.
-
Select Ignore Certificate Warnings if you want to skip warnings when importing files (such as if the remote host does not have a valid CA-signed certificate).
-
Click Import File to begin the import.
-
-
To export a file:
-
Select the file and click Export.
-
In the popup, enter the Server URL for where to export the file.
-
Provide the Username and Password only if required by the remote host.
-
Select Ignore Certificate Warnings if you want to skip warnings when importing files.
-
Click Export File to begin the export.
-
-
To upload or download a file:
-
Select the file and click Upload or Download.
The selected file will be uploaded or downloaded.
-
-
To delete a file, select the file and click Delete.
You can delete files only from the
diags/shareddirectory.
You can view the status of a file transfer operation to view its progress and see if it was successful. If an operation fails, hover over the warning icon to see the error that occurred.
Note: A runtime error displays in the File Transfer status area, if an invalid operation is performed.
You can view the contents of a file from the CLI.
-
Log in to the command line interface (CLI) of the system using an account with admin access.
When you log in to the system, you are in user (operational) mode.
-
View the contents of a file.
file show <*local-file-path*>This example shows how to view the contents of the
platform.logfile:appliance-1# file show log/system/platform.log | until 5 2022-12-27T21:34:24.718946+00:00 appliance-1 tmstat-agent[1]: priority="Info" version=1.0 msgid=0x1601000000000008 msg="TMSTAT directory set from command line." directory="cluster". 2022-12-27T21:34:24.719592+00:00 appliance-1 ihealthd[8]: priority="Info" version=1.0 msgid=0x6602000000000005 msg="DB is not ready". appliance-1# file show log/system/platform.log | until 15 2022-12-27T21:34:24.718946+00:00 appliance-1 tmstat-agent[1]: priority="Info" version=1.0 msgid=0x1601000000000008 msg="TMSTAT directory set from command line." directory="cluster". 2022-12-27T21:34:24.719592+00:00 appliance-1 ihealthd[8]: priority="Info" version=1.0 msgid=0x6602000000000005 msg="DB is not ready". 2022-12-27T21:34:24.720155+00:00 appliance-1 alert-service[9]: priority="Notice" version=1.0 msgid=0x2201000000000001 msg="Alert Service starting." version="3.11.7" date="Thu Nov 3 13:25:15 2022". ...
You can import a file from an external server onto your system from the CLI.
-
Log in to the command line interface (CLI) of the system using an account with admin access.
When you log in to the system, you are in user (operational) mode.
-
Import a file.
file import remote-url <*ip-address-and-file-path*> local-file <*local-file-path*> username <*user*> password [ remote-port <*port-number*> } [ protocol [ https | scp | sftp ]] [insecure]Note: The insecure option ignores certificate warnings during the transfer.
This example shows how to import a Base OS ISO to the system:
appliance-1# file import remote-url https://files.company.com/images/F5OS-A-1.6.x-xxxxx.R5R10.iso
  local-file images/staging username admin password
Enter the password at the prompt:
     Value for 'password' (<string>): ********
result File transfer is initiated.(images/staging/F5OS-A-1.6.x-xxxxx.R5R10.iso)
Note: If the file import doesn’t work, you can alternatively use secure copy (SCP) to copy the image file to the
images/stagingdirectory of the system. -
Optionally, you can check the file transfer status.
appliance-1# file transfer-statusWhen the file transfer completes, the
StatusdisplaysComplete. -
Export a file.
file export remote-url <*ip-address-and-file-path*> local-file <*local-file-path*> username <*user*> password [ remote-port <*port-number*> } [ protocol [ https | scp | sftp ]] [insecure]This example shows how to import a Base OS ISO to the system:
appliance-1# file export local-file configs/backup1.xml remote-file /tmp/backup1.xml
  remote-host 192.51.100.75 username root
The system requests the password for the remote account.
Value for 'password' (<string>): ******* result File transfer is initiated.(configs/backup1.xml) -
Delete a file.
file delete local-file diags/shared/<*file-name.xml*>This example shows how to delete a file:
appliance-1# file delete local-file diags/shared/backup1.xmlYou can only delete files from the
diags/sharedorconfigsdirectory.
You can cancel an in-progress file import onto your system from the CLI.
-
Log in to the command line interface (CLI) of the system using an account with admin access.
When you log in to the system, you are in user (operational) mode.
-
Get the operation identifier for the file transfer process.
show file transfer-operationsA summary similar to this example displays:
appliance-1# show file transfer-operations file transfer-operations transfer-operation images/import/iso/F5OS-A-1.6.0-1234.iso files/F5OS-A/images/F5OS-A-1.6.0-1234.iso "Import file" "HTTPS " operation-id IMPORT-C16QYpun status "In Progress (13.0%)" timestamp "Fri Mar 24 23:05:54 2023" -
Cancel the specified file transfer.
file abort-transfer operation-id <*id*>This example shows canceling a specified in-progress file transfer:
appliance-1# file abort-transfer operation-id IMPORT-C16QYpun
Aborting will stop the file transfer. Do you want to proceed? [yes/no] yes
result File transfer abort operation initiated.
You can export a file to an external server from your system from the CLI.
-
Log in to the command line interface (CLI) of the system using an account with admin access.
When you log in to the system, you are in user (operational) mode.
-
Export a file.
file export insecure local-file <*local-file-path*> protocol { https | scp | sftp } remote-file <*remote-file-path*> remote-host <*ip-address-or-fqdn*> remote-port <*port-number*> remote-url <*ip-address-or-fqdn*> username <*user*> web-token <*remote-system-token*>
You can delete files from the CLI.
-
Log in to the command line interface (CLI) of the system using an account with admin access.
When you log in to the system, you are in user (operational) mode.
-
Delete a file.
file delete local-file diags/shared/<*file-name.xml*>This example shows how to delete a file:
appliance-1# file delete local-file diags/shared/backup1.xmlYou can delete files only from the
diags/sharedorconfigsdirectories.
You can configure Network Time Protocol (NTP) for the rSeries system. An NTP server ensures that the system clock is synchronized with Coordinated Universal Time (UTC). The system also provides authentication support for NTP, which can enhance security by ensuring that the system sends time-of-day requests only to trusted NTP servers. You can also configure the time zone and set the time and date manually, if NTP is disabled. You can use either the CLI or webUI to configure time settings.
After the system license is activated, you can configure Network Time Protocol (NTP) servers, including authentication support for NTP, time zone, and manual configuration of date and time, if NTP is disabled. The NTP server ensures that the system clock is synchronized with Coordinated Universal Time (UTC). You can specify a list of servers that you want the system to use when updating the time on network systems. You can configure time settings for the system from the webUI.
-
Log in to the webUI using an account with admin access.
-
On the left, click SYSTEM SETTINGS > Time Settings.
-
To synchronize the system clock with an NTP server, for NTP Service, click Enabled.
The NTP Service is set to Disabled, by default.
-
To manually set the time and date:
-
For NTP Service, select Disabled.
-
In the Manual Time & Date Settings area, click the calendar to set the date and time.
-
-
To use authentication support for NTP:
-
For NTP Authentication, select Enabled.
The NTP Authentication is set to Disabled by default.
-
For NTP Keys, click Add.
The Add NTP Key screen displays.
-
For Key ID, enter an identifier used by the client and server to designate a secret key.
The client and server must use the same key ID.
-
For Key Type, select the encryption type used for the NTP authentication key.
The default value is F5_NTP_AUTH_SHA256.
Select from these options:
- F5_NTP_AUTH_MD5
- F5_NTP_AUTH_SHA1
- F5_NTP_AUTH_SHA256
- F5_NTP_AUTH_SHA384
- F5_NTP_AUTH_SHA512
-
For Key Value, paste the text of the NTP authentication key.
-
Click Save & Close.
-
-
To specify an NTP server:
-
Click Add.
-
In the NTP Server field, enter the IPv4 address, IPv6 address, or the fully qualified domain name (FQDN) of the NTP server.
Note: If specifying an FQDN, you must configure a resolvable DNS server for the system.
-
Click Save & Close.
-
-
To set the time zone, from Locations, select the time zone region.
-
Click Save & Close.
You can manually configure the date and time for your system from the CLI.
-
Connect using SSH to the management IP address.
-
Log in to the command line interface (CLI) of the system using an account with admin access.
When you log in to the system, you are in user (operational) mode.
-
Change to config mode.
configThe CLI prompt changes to include
(config). -
Change the system date and/or time.
Note: You can opt to change only the time or only the date by including only the relevant option (either time or date).
system set-datetime date <*YYYY-MM-DD*> time <*HH:MM-SS*>In this example, you change the system date to 2022-01-01 and the system time to be 12:01:00:
appliance-1(config)# system set-datetime date 2022-01-01 time 12:01:00
The system date and time are now updated.
You can configure Network Time Protocol (NTP) for your rSeries system from the CLI.
Note: If you want to enable NTP authentication, see Configure NTP authentication from the CLI.
-
Connect using SSH to the management IP address.
-
Log in to the command line interface (CLI) of the system using an account with admin access.
When you log in to the system, you are in user (operational) mode.
-
Change to config mode.
configThe CLI prompt changes to include
(config). -
Enable NTP.
system ntp config enabled -
Add an NTP server.
system ntp servers server <*ip-address*>In this example, you configure an NTP server at pool.ntp.org:
appliance-1(config)# system ntp servers server pool.ntp.org -
Commit the configuration changes.
commit -
Return to user (operational) mode.
end -
Verify that NTP is enabled and a server is configured.
appliance-1# show system ntp
system ntp state enabled
system ntp state enable-ntp-auth false
system ntp servers server pool.ntp.org
 state address    pool.ntp.org
 state port       123
 state version    4
 state association-type SERVER
 state iburst     false
 state prefer     false
 state stratum    4
 state root-delay 34
 state root-dispersion 36
 state offset     244
 state poll-interval 6
 state authenticated false
You can configure Network Time Protocol (NTP) authentication for your rSeries system from the CLI. NTP authentication enhances security by ensuring that the system sends time-of-day requests only to trusted NTP servers.
-
Connect using SSH to the management IP address.
-
Log in to the command line interface (CLI) of the system using an account with admin access.
When you log in to the system, you are in user (operational) mode.
-
Change to config mode.
configThe CLI prompt changes to include
(config). -
Enable NTP.
system ntp config enabled -
Enable NTP authentication.
system ntp config enable-ntp-auth true -
Add the key associated with your server to the system.
system ntp ntp-keys ntp-key <*public-key-id*> config key-id <*secret-key-id*> key-type [ F5_NTP_AUTH_MD5 | F5_NTP_AUTH_SHA1 | F5_NTP_AUTH_SHA256 | F5_NTP_AUTH_SHA384 | F5_NTP_AUTH_SHA512 ] key-value HEX:<*ntp-auth-key-value*>Important: The key ID, key type, and key value on this client system must match the server exactly.
appliance-1(config)# system ntp ntp-keys ntp-key 11 config key-id 11 key-type F5_NTP_AUTH_SHA1 key-value HEX:E27611234BB5E7CDFC8A8ACE55B567FC5CA7C890 -
Add an NTP server and associate the key ID you added with the server.
system ntp servers server <*ip-address*>In this example, you configure an NTP server at the IP address 192.0.2.118:
appliance-1(config)# system ntp servers server 192.0.2.118 appliance-1(config-server-192.0.2.118)# config key-id 11 -
Commit the configuration changes.
commit -
Return to user (operational) mode.
end -
Verify that NTP with authentication is enabled and a server is configured.
appliance-1# show system ntp servers
system ntp servers server 192.0.2.118
 state address    192.0.2.118
 state port       123
 state version    4
 state association-type SERVER
 state iburst     false
 state prefer     false
 state stratum    8
 state root-delay 0
 state root-dispersion 0
 state offset     251333
 state poll-interval 6
 state key-id     11
 state authenticated true
Simple Network Management Protocol (SNMP) is an industry-standard protocol that enables you to use a standard SNMP management system to remotely manage network devices. F5 rSeries systems support SNMPv1, SNMPv2c, and SNMPv3. You can configure the system from both the CLI and webUI.
SNMP support is available in different ways, depending on which F5OS software version you are using. On F5 rSeries systems, SNMP is available from both the CLI and webUI.
SNMP support is available in different ways, depending on which F5OS software version you are using. On F5 rSeries systems, SNMP is available from both the CLI and webUI.
F5 recommends using the newer system snmp commands, which include support for SNMP versions 1, 2c, and 3. For more information on the older commands, see:
|
F5OS-A software version |
Older CLI (v1/v2c only) |
Newer CLI (v1/v2c/v3) |
|---|---|---|
|
1.2.0 |
SNMP-COMMUNITY-MIB SNMP-NOTIFICATION-MIB SNMP-TARGET-MIB SNMP-VIEW-BASED-ACM-MIB SNMPv2-MIB |
system snmp communities system snmp engine-id system snmp targets system snmp users |
Before you configure SNMP access for F5 rSeries systems:
- Add the SNMP manager IP address to the system allow list. For more information, see Configure the system allow list from the webUI.
- Add descriptions to front-panel interfaces. For more information, see Configure an interface from the CLI.
- Add descriptions to management interfaces. For more information, see Configure the management interface from the CLI.
- Add descriptions to LAGs, if needed. For more information, see Configure a static LAG interface from the CLI.
- Download the F5 MIB files from File Utilities in the webUI (on the left, click SYSTEM SETTINGS > File Utilities, and then from Base Directory, select mibs, select a
.tar.gzfile, and click Download). - Configure a DNS name server if you would like to use a fully-qualified domain name (FQDN) instead of an IP address for the SNMP trap destination. For more information, see Configure DNS from the webUI.
You can view SNMP information in the /log/system/snmp.log file. You can download the log file to your local workstation from the File Utilities screen in the webUI (on the left, click SYSTEM SETTINGS > File Utilities, and then from Base Directory, select log/system, select snmp.log, and click Download). For more information about managing files from the webUI or CLI, see File utilities overview.
SNMPWALK is an application on an SNMP management system that performs SNMP GETNEXT requests to query a network device for information. You can provide an object identifier (OID) to specify which portion of the object identifier space to search using GETNEXT requests. The SNMP management system queries all variables in the subtree below the specified OID, displays these values to the user, and stops when it returns results that are no longer inside the range of the specified OID.
These SNMP system object IDs (OIDs) are defined for each F5 rSeries system type:
- 1.3.6.1.4.1.12276.1.3.1.1 (f5OsAppR5x00)
- 1.3.6.1.4.1.12276.1.3.1.2 (f5OsAppR10x00)
- 1.3.6.1.4.1.12276.1.3.1.3 (f5OsAppR2x00)
- 1.3.6.1.4.1.12276.1.3.1.4 (f5OsAppR4x00)
The IDs display in text format when the corresponding MIB is loaded in your SNMP management system. If the MIB is not loaded, the walk displays in OID format.
To more accurately map these system OIDs, you must download the F5-OS-SYSTEM-MIB.mib file and load it into your SNMP management system. To download the F5 MIB files, use File Utilities in the webUI (on the left, click SYSTEM SETTINGS > File Utilities, and then from Base Directory, select mibs, select a .tar.gz file, and click Download).
You can configure the SNMP port from the rSeries webUI.
-
Log in to the webUI using an account with admin access.
-
On the left, click SYSTEM SETTINGS > SNMP Configuration.
-
For Port, enter the required value. The allowed values for the Port are either 161 or in the ranges of [1024-7000, 7033-8887, 8889-65535]. To check whether a port is valid or not, we have inline validation.
Note: The port configured in the SNMP Configuration area is reflected on the Allow List Entry screen of the Allowed IP Addresses section under System Security in the System Settings chapter. When an allowlist is created with an SNMP port, the user is not allowed to change the SNMP Port on the SNMP Configuration area, which can cause an error. For more information, see Configure the system allow list from the webUI.
-
Click Save & Close.
You can configure SNMP communities with either version 1, version 2c, or both security models from the webUI.
-
Log in to the webUI using an account with admin access.
-
On the left, click SYSTEM SETTINGS > SNMP Configuration.
-
In the Communities area, click Add.
The Add Community screen displays.
-
For Community, enter a descriptive name.
-
For Security Model, select from these security models: v1, v2c, and v1 and v2c.
-
Click Save & Close.
You can configure SNMP version 3, which is a user-based security model, from the webUI. This model provides support for additional authentication and privacy protocols.
-
Log in to the webUI using an account with admin access.
-
On the left, click SYSTEM SETTINGS > SNMP Configuration.
-
In the Users area, click Add.
The Add v3 User screen displays.
-
For User, enter the user name.
-
For Authentication Protocol, select from these protocols: MD5, SHA, or None.
-
For Authentication Password, enter the password for the specified user.
-
For Privacy Protocol, select from these protocols: AES128, DES, or None.
-
Click Save & Close.
Before you can add an SNMP target, you must have already configured either the SNMPv1/v2c community or SNMPv3 user.
You can configure SNMP targets from the webUI. These are required to send system-generated traps to a manager. You can choose either community (v1/v2c) or user-based (v3) security.
-
Log in to the webUI using an account with admin access.
-
On the left, click SYSTEM SETTINGS > SNMP Configuration.
-
In the Targets area, click Add.
The Add Target screen displays.
-
For Name, enter a descriptive name.
-
For Security Model, select from these security models: v1, v2c, or v3.
-
Select one of these options, depending on the selected security model:
- If you selected v1 or v2c, for Community, select the community that you created with that security model.
- If you selected v3, for User, select the user that you created.
-
For IPv4/IPv6, select either IPv4 or IPv6.
-
For Address, enter the IPv4 address, IPv6 address, or fully qualified domain name (FQDN) of the target.
-
For Port, enter the port number for the target.
The default value is 162, and the range is from 1024 to 65535
-
Click Save & Close.
You can configure SNMP communities with either version 1, version 2c, or both security models from the CLI.
-
Connect using SSH to the management IP address.
-
Log in to the command line interface (CLI) of the system using an account with admin access.
When you log in to the system, you are in user (operational) mode.
-
Change to config mode.
configThe CLI prompt changes to include
(config). -
Configure a community.
system snmp communities community <*community-name*> config security-model { v1 | v2c }This example creates a community that uses the v2c security model:
appliance-1(config)# system snmp communities community v2comm config
  security-model v2c
This example creates a community that uses both v1 and v2c community models:
appliance-1(config)# system snmp communities community v1v2c config security-model [ v1 v2c ] -
Commit the configuration changes.
commit -
Return to user (operational) mode.
end -
Verify the community configuration.
show system snmp communitiesA summary similar to this example displays:
appliance-1# show system snmp communities
                      SECURITY
NAME       NAME       MODEL
----------------------------------
v1v2c      v1v2c     [ v1 v2c ]
Note: This example shows both security models configured. If you configure only one security model, then only the configured model displays in the output.
You can configure SNMP version 3, which is a user-based security model, from the CLI. This model provides support for additional authentication and privacy protocols.
-
Connect using SSH to the management IP address.
-
Log in to the command line interface (CLI) of the system using an account with admin access.
When you log in to the system, you are in user (operational) mode.
-
Change to config mode.
configThe CLI prompt changes to include
(config). -
Configure a user, including authentication and privacy protocols.
system snmp users user <*user-name*> config authentication-protocol { md5 | none | sha } privacy-protocol { aes | des | none } authentication-passwordThis example creates a user that uses MD5 authentication and AES for password authentication:
appliance-1(config)# system snmp users user jdoe config
  authentication-protocol md5 privacy-protocol aes authentication-password
After you press Enter, you are prompted to enter the authentication password.
(<string, min: 8 chars, max: 32 chars>): ********After you press Enter, configure the privacy password.
appliance-1(config-user-v3-user)# config privacy-passwordAfter you press Enter, you are prompted to enter the privacy password.
(<string, min: 8 chars, max: 32 chars>): ********* -
Commit the configuration changes.
commit -
Return to user (operational) mode.
end -
Verify the user configuration.
show system snmp usersA summary similar to this example displays:
appliance-1# show system snmp users
                  AUTHENTICATION  PRIVACY
NAME     NAME     PROTOCOL        PROTOCOL
--------------------------------------------
jdoe     jdoe     md5             aes
You can configure SNMP targets with community-based security (SNMPv1/SNMPv2c) from the CLI. These are required to send system-generated traps to an SNMP management system.
-
Connect using SSH to the management IP address.
-
Log in to the command line interface (CLI) of the system using an account with admin access.
When you log in to the system, you are in user (operational) mode.
-
Change to config mode.
configThe CLI prompt changes to include
(config). -
Configure a target with community-based security.
system snmp targets target <*target-name*> config community <*community-name*> security-model { v1 | v2c } { ipv4 | ipv6 } address <*ip-address*> port <*port-number*>This example creates a target with community-based security:
appliance-1(config)# system snmp targets target v2c-target config community v2c-comm security-model v2c ipv4 address 192.0.2.24 port 5001 -
Commit the configuration changes.
commit -
Return to user (operational) mode.
end -
Verify the target configuration.
show system snmp usersA summary similar to this example displays:
appliance-1# show system snmp targets
                                          SECURITY
NAME       NAME       USER     COMMUNITY  MODEL     ADDRESS         PORT  ADDRESS  PORT
-----------------------------------------------------------------------------------------
v2c-target v2c-target jdoe     -          -         192.0.2.24      5001  -        -
You can configure SNMP targets with user-based security (SNMPv3) from the CLI. These are required to send system-generated traps to an SNMP management system.
-
Connect using SSH to the management IP address.
-
Log in to the command line interface (CLI) of the system using an account with admin access.
When you log in to the system, you are in user (operational) mode.
-
Change to config mode.
configThe CLI prompt changes to include
(config). -
Configure a target with user-based security.
system snmp targets target <*target-name*> config user <*user-name*> { ipv4 | ipv6 } address <*ip-address*> port <*port-number*>This example creates a target with user-based security:
appliance-1(config)# system snmp targets target v3-target config user jdoe ipv4 address 192.0.2.24 port 5001 -
Commit the configuration changes.
commit -
Return to user (operational) mode.
end -
Verify the target configuration.
show system snmp targetsA summary similar to this example displays:
appliance-1# show system snmp targets
                                          SECURITY
NAME       NAME       USER     COMMUNITY  MODEL     ADDRESS         PORT  ADDRESS  PORT
-----------------------------------------------------------------------------------------
v3-target  v3-target  jdoe     -          -         192.0.2.24      5001  -        -
You can back up the system configuration from the webUI.
-
Log in to the webUI using an account with admin access.
-
On the left, click SYSTEM SETTINGS > Configuration Backup.
-
Click Create.
The Create Configuration Backup popup opens.
-
In the Name field, enter a name for the backup (for example, system-12-21-21).
-
Click Create.
The backup is created and added to the list.
-
To delete a backup file, select the file and click Delete.
System configuration backups are stored in configs/. Backups should be stored on off the system.
You can restore configurations from the CLI. For more information on saving and restoring the configuration, see Complete backup and restore overview.
You can activate a license for the rSeries system from either the CLI or webUI. There is one license per rSeries system, which is also used by any tenants.
There are two ways to license the system:
- Automatically
- If your system is connected to the internet, use the Automatic method to prompt the system to contact the F5 license server and activate the license.
- Manually
- If your system is not connected to the internet, use a management workstation that is connected to the internet to retrieve an activation key from F5 and then transfer it to the system.
Important:
Adding or reactivating a license on an active rSeries system might impact traffic on tenants. Traffic processing will stop briefly on the tenants, and then restart automatically. This occurs when the tenant receives a new or reactivated license causing a configuration reload on the tenants. For more information, see these other references:
- F5 rSeries Systems: Installation and Upgrade at Documentation - F5OS-A and F5 rSeries
- K7752: Licensing the BIG-IP system
- For information about BIG-IP Next licensing, also see the documentation on my.f5.com and clouddocs.f5.com.
You can license a system using the automatic method from the webUI, as long as the system has Internet access.
-
Log in to the webUI using an account with admin access.
-
On the left, click SYSTEM SETTINGS > Licensing.
-
For the Base Registration Key field, the registration key is auto-populated.
You can choose to overwrite this field with a new registration key by clicking Reactivate and overwriting the field.
-
For the Add-On Keys field, the associated add-on keys are auto-populated.
You can choose to change these keys by clicking Reactivate and then click + or x to add or remove additional add-on keys.
-
For the Activation Method, select Automatic.
-
Click Activate.
The End User License Agreement (EULA) displays.
-
Click Agree to accept the EULA.
The system is now licensed. If a base registration key or add-on key fails to activate, try re-activating the license or contact F5 Support at support.f5.com.
You can license a system without access to the Internet using the manual activation method from the webUI.
-
Log in to the webUI using an account with admin access.
-
On the left, click SYSTEM SETTINGS > Licensing.
-
For the Base Registration Key field, the registration key is auto-populated.
You can choose to overwrite this field with a new registration key by clicking Reactivate and overwriting the field.
-
For the Add-On Keys field, the associated add-on keys are auto-populated.
You can choose to change these keys by clicking Reactivate and then click + or x to add or remove additional add-on keys.
-
For the Activation Method, select Manual.
-
For the Device Dossier, click Get Dossier.
The system refreshes and displays the dossier.
-
Copy the dossier text in the Device Dossier field.
-
Click Click here to access F5 Licensing Server.
The Activate F5 Product page displays.
-
Paste the dossier in the Enter Your Dossier field.
-
Click Next.
The license key text displays.
-
Copy the license key text.
Alternatively, you can use the F5 license activation portal at activate.f5.com/license.
-
In the License Text field, paste the license key text.
-
Click Activate.
The End User License Agreement (EULA) displays.
-
Click Agree to accept the EULA.
The system is now licensed. If a base registration key or add-on key fails to activate, try re-activating the license or contact F5 Support at support.f5.com.
You can activate the rSeries system license manually from the system CLI.
-
Log in to the command line interface (CLI) of the system using an account with admin access.
When you log in to the system, you are in user (operational) mode.
-
Change to config mode.
configThe CLI prompt changes to include
(config). -
Get the system dossier.
system licensing get-dossier [registration-key XXXXX-XXXXX-XXXXX-XXXXX-XXXXXXX]The registration key is optional. If it is not included, the system uses the one already pre-installed. If no registration key is found, you receive an error.
The dossier for the system displays.
-
Get the license file using the dossier output you just received by going to the F5 siteactivate.f5.com/license/dossier.jsp.
-
Copy the license file text.
-
Install the license.
system licensing manual-install licensePress Enter to enable multi-line mode and paste the contents. Press Ctrl-D to exit multi-line mode.
appliance-1(config)# system licensing manual-install license
Value for 'license' (<string>):
[Multiline mode, exit with ctrl-D.]
>
The rSeries system is licensed. The license applies to the system and tenants.
For automatic rSeries system licensing, the system needs to be able to connect to the F5 licensing server either through the Internet or another means of networking. You need to have the Base Registration Key (five sets of characters separated by hyphens) provided by F5, and any add-on keys (two sets of 7 characters separated by a hyphen) that you have purchased. The Base Registration Key with associated add-on keys are pre-installed on a new rSeries system.
You can activate the rSeries system license automatically from the CLI.
-
Log in to the command line interface (CLI) of the system using an account with admin access.
When you log in to the system, you are in user (operational) mode.
-
Change to config mode.
configThe CLI prompt changes to include
(config). -
Apply a license to the system.
system licensing install registration-key <*key*>The registration key is optional. If it is not included, the system uses the one that is already pre-installed. If no registration key is found, you receive an error.
This example applies a specified base registration license to the system:
appliance-1(config)# system licensing install registration-key I1234-12345-12345-12345-1234567 result License installed successfully. -
Apply any add-on keys.
system licensing install add-on-keys <*add-on-keys*>This example enables the additional features associated with the three specified add-on-keys, along with the entitlements of the base registration key:
appliance-1(config)# system licensing install
 add-on-keys [1234567-1234567 2345678-2345678 3456789-3456789]
result License installed successfully.
The rSeries system is licensed. The license and any add-on keys apply to the system and all tenants.
You can display the license and associated information of an rSeries system from the CLI.
-
Log in to the command line interface (CLI) of the system using an account with admin access.
When you log in to the system, you are in user (operational) mode.
-
Display the system license.
show system licensingA summary similar to this example displays:
appliance-1# show system licensing system licensing license Licensed version 1.1.0 Registration Key I1234-12345-12345-12345-1234567 Licensed date 2022/02/08 License start 2022/02/07 License end 2022/03/11 Service check date 2022/02/08 Platform ID C128 Appliance SN f5-nhlh-lule Active Modules Local Traffic Manager, r10900 (S680352-1548257) LTM to Best Upgrade, r109XX Rate Shaping DNSSEC Anti-Virus Checks Base Endpoint Security Checks Firewall Checks Machine Certificate Checks Network Access Protected Workspace Secure Virtual Keyboard APM, Web Application App Tunnel Remote Desktop DNS Rate Fallback, Unlimited DNS Licensed Objects, Unlimited DNS Rate Limit, Unlimited QPS GTM Rate Fallback, (UNLIMITED) GTM Licensed Objects, Unlimited GTM Rate, Unlimited Carrier Grade NAT (AFM ONLY) APM, Limited Routing Bundle Protocol Security Manager Access Policy Manager, Base, r109XX Advanced Web Application Firewall, r10XXX Max SSL, r10900 Max Compression, r10900 DNS Max, rSeries Advanced Firewall Manager, r10XXX -
Display the entire license file content received from the F5 license server.
show running-config system licensing
The rSeries system is licensed. The license applies to the system and tenants.
F5 r10000 platforms include two storage drives that support drive mirroring using a redundant array of independent disks (RAID) by default. You can manage the software RAID array from either the CLI or the webUI.
Important: If you need to swap out a faulty drive, you must first remove the drive from the software RAID array before physically removing the drive from the platform.
You can configure a software RAID (redundant array of independent disks) for the system from the webUI.
-
Log in to the webUI using an account with admin access.
-
On the left, click SYSTEM SETTINGS > RAID Configuration.
-
To remove a drive from the software RAID array:
-
Select the drive to remove.
-
Click Remove.
When prompted, click OK to confirm drive removal.
-
-
To add a drive to the software RAID array:
-
Select the drive to add.
-
Click Add.
When prompted, click OK to confirm drive addition.
-
You can configure a software RAID (redundant array of independent disks) for the system from the CLI.
-
Log in to the command line interface (CLI) of the system using an account with admin access.
When you log in to the system, you are in user (operational) mode.
-
Change to config mode.
configThe CLI prompt changes to include
(config). -
Remove a drive from the software RAID array.
system raid remove drive ssd2A summary similar to this example displays:
appliance-1(config)# system raid remove drive ssd2 status Remove of RAID SSD2 initiated. [11084.434517] md/raid1:md121: Disk failure on nvme1n1p3, disabling device. [11084.434517] md/raid1:md121: Operation continuing on 1 devices. [11084.449528] md/raid1:md122: Disk failure on nvme1n1p4, disabling device. [11084.449528] md/raid1:md122: Operation continuing on 1 devices. [11084.464098] md/raid1:md123: Disk failure on nvme1n1p5, disabling device. [11084.464098] md/raid1:md123: Operation continuing on 1 devices. [11084.478342] md/raid1:md124: Disk failure on nvme1n1p1, disabling device. [11084.478342] md/raid1:md124: Operation continuing on 1 devices. [11084.492509] md/raid1:md127: Disk failure on nvme1n1p2, disabling device. [11084.492509] md/raid1:md127: Operation continuing on 1 devices. status Remove of RAID SSD2 initiated. -
Add the replacement drive to the array.
system raid add drive ssd2A summary similar to this example displays:
appliance-1(config)# system raid add drive ssd2
status Add RAID SSD2 initiated.
The array status for the new drive should change to
replicating, and the STAT LED should change to solid green. The replication process typically takes between 15 and 45 minutes.
You can configure general system settings for the rSeries system, such as system hostname, login banner, and message of the day (MOTD) banner. Depending on which setting you want to configure, you can use either the CLI or the webUI.
You can configure the hostname, login banner, message of the day (MOTD) banner, and an advisory banner for the system from the webUI. When enabled and configured, the advisory banner will display at the top of the webUI after authentication.
-
Log in to the webUI using an account with admin access.
-
On the left, click SYSTEM SETTINGS > General.
-
For Hostname, enter a custom hostname for the system.
-
For Login Banner, enter any text to be shown when users log in to the system.
-
For MOTD Banner, enter any text to be used as a MOTD when users log in to the system.
-
For Advisory Banner, select Enabled or Disabled.
-
For Advisory Banner Color, select the color for the banner.
-
For Advisory Banner Text, enter the text for the banner. The maximum number of characters is 80.
-
Click Save.
You can manually configure the hostname for your system from the CLI. F5 recommends you to configure a Fully Qualified Domain Name (FQDN) hostname.
-
Connect using SSH to the management IP address.
-
Log in to the command line interface (CLI) of the system using an account with admin access.
When you log in to the system, you are in user (operational) mode.
-
Change to config mode.
configThe CLI prompt changes to include
(config). -
Change the hostname.
system config hostname <*hostname*>The minimum length is 1 character, and the maximum length is 253 characters.
In this example, you change the hostname for the system to test.company.com:
appliance-1(config)# system config hostname test.company.com
The system hostname is now updated.
You can configure the login banner for your system manually from the CLI. The login banner displays before users log in to each respective system.
-
Connect using SSH to the management IP address.
-
Log in to the command line interface (CLI) of the system using an account with admin access.
When you log in to the system, you are in user (operational) mode.
-
Change to config mode.
configThe CLI prompt changes to include
(config). -
Change the login banner text.
system config login-bannerPress Enter to enable multi-line mode and paste the contents. Press Ctrl-D to exit multi-line mode.
In this example, you change the login banner text to indicate that unauthorized access is prohibited:
appliance-1(config)# system config login-banner (<string>): [Multiline mode, exit with ctrl-D.] UNAUTHORIZED ACCESS TO THIS DEVICE IS PROHIBITED -
Commit the configuration changes.
commit
The login banner is now updated.
You can configure the message-of-the-day (MOTD) banner for your system manually from the CLI. The MOTD banner displays after users log in to each respective system.
-
Connect using SSH to the management IP address.
-
Log in to the command line interface (CLI) of the system using an account with admin access.
When you log in to the system, you are in user (operational) mode.
-
Change to config mode.
configThe CLI prompt changes to include
(config). -
Change the MOTD banner text.
system config motd-bannerPress Enter to enable multi-line mode and paste the contents. Press Ctrl-D to exit multi-line mode.
In this example, you change the login banner text to notify users of upcoming system maintenance:
appliance-1(config)# system config motd-banner (<string>): [Multiline mode, exit with ctrl-D.] ATTENTION! This system is scheduled for maintenance in two days. -
Commit the configuration changes.
commit
The MOTD banner is now updated.
You can verify the current MAC allocation data from the system controller CLI.
-
Log in to the command line interface (CLI) of the system controller using an account with admin access.
When you log in to the system, you are in user (operational) mode.
-
Display the current MAC allocation data.
show system mac-allocationA summary similar to this example displays:
appliance-1# show system mac-allocation
system mac-allocation state free-single-macs 17
system mac-allocation state allocated-single-macs 3
system mac-allocation state free-large-blocks 3
system mac-allocation state allocated-large-blocks 0
system mac-allocation state free-medium-blocks 0
system mac-allocation state allocated-medium-blocks 0
system mac-allocation state free-small-blocks 0
system mac-allocation state allocated-small-blocks 0
system mac-allocation state total-free-mac-count 113
system mac-allocation state total-allocated-mac-count 3
system mac-allocation state total-mac-count 116
If you are having an issue with the system (such as unusually high CPU or memory usage or lockup), it is possible that rebooting might help to resolve the issue.
When there is a problem, the system sends alerts that you would see on the dashboard or on the Alarms & Events screen. You should rarely have to reboot the system, however, because typically if the system needs to reboot, it will do so automatically without administrator intervention. F5 recommends working with customer support if you think a system reboot is necessary.
You can manually reboot the system from the CLI.
-
Connect using SSH to the management IP address.
-
Log in to the command line interface (CLI) of the system using an account with admin access.
When you log in to the system, you are in user (operational) mode.
-
Reboot the system.
system rebootIn this example, you reboot the system:
appliance-1# system reboot
The reboot of the system results in data plane and management connectivity
to be disrupted. Proceed? [no,yes]
It takes a few minutes for the system to reboot, and you will be logged out from the SSH session.
You can reboot the system from the webUI.
-
Log in to the webUI using an account with admin access.
-
On the left, click SYSTEM SETTINGS > General.
-
Review the system status.
The Reboot button will not be available if the system is currently being rebooted.
-
If you decide that a reboot is necessary, in the System Operations & Status area, click Reboot.
A popup displays asking you to confirm the reboot operation.
It takes a few minutes for the system to reboot, and you will be logged out from the webUI.
OpenTelemetry streamlines observability in distributed systems through standardized APIs, libraries, and tools for collecting telemetry data, including traces, metrics, and logs.
F5OS OpenTelemetry enables the efficient collection of streaming metrics and logs in a structured format from the F5OS product to display in your observability platform. All the metrics and logs will be exported through a gRPC connection. The F5OS supports gRPC endpoints and each OpenTelemetry Line Protocol (OTLP) endpoint is provided with the ability to toggle instrument based filtering.
Telemetry subsystem within the F5OS platform layer generates common attributes and different metrics to display in your observability platform.
An instrument is an area of metrics, which contain multiple metrics and can be enabled selectively. F5OS Resource includes instruments.
The following tenant metrics are currently reported by the BIG-IP tenant into the F5OS platform layer. The metrics visible at the platform layer are only a limited subset of the total number of metrics available to the tenant. You can view the full tenant metrics by using the BIG-IP metric reporting capability.
F5OS OpenTelemetry exporter will only report the metrics that are associated with the Docker containers managed by the platform layer. For more information about the docker container metrics, see Docker stats documentation.
The platform hardware sensors represent physical sensors associated with the hardware which measure: temperature, current, power, voltage, RPM and percent humidity.
An instrument is an area of metrics, which contain multiple metrics and can be enabled selectively. F5OS Resource includes instruments.
| Instument name | Description |
|---|---|
| platform | Standard platform stats such as memory, disk, CPU, and interface |
| tenant | Tenant-initiated stats such as memory, disk, CPU, and interface |
| optics | The front-panel optic DDM metrics |
| hardware | The low-level platform hardware sensors |
| container | Docker container stats for F5OS services |
| logs | Export the platform log file |
Note: Support for the intrument “tenant” is provided only for BIG-IP tenants.
This image provides a representation how the F5OS Resource includes instruments with multiple metrics:
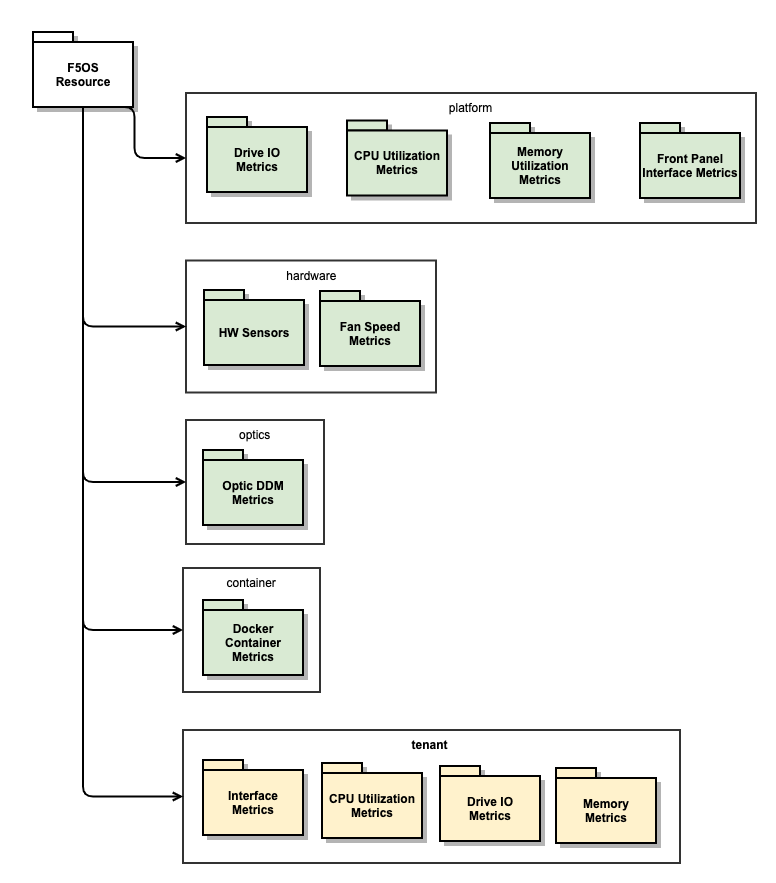
The table lists the set of attributes that can be applied to all metrics produced by the platform.
The scope indicates which product the attribute applies to:
- F5 - Applies to all metrics produced by F5
- F5OS - Applies to all metrics produced by the F5OS product
|
Name |
Value |
Type |
Scope |
Description |
|---|---|---|---|---|
|
|
string |
F5 |
Attribute used by BIG-IP Central Manager to help direct F5OS specific metrics |
|
|
string |
F5 |
High level F5 product generating the metric/log |
|
|
string |
F5 | |
|
|
string |
F5 | |
|
|
string |
F5 |
Serial number of an appliance, blade, or controller |
|
|
string |
F5OS |
The platform ID |
|
|
string |
Role of the platform | |
|
|
string |
F5OS |
F5OS Instrument name associated with the metric |
|
Metric Name |
Metric Type |
Value Type |
Attributes |
Unit |
|---|---|---|---|---|
|
|
|
|
|
|
|
|
|
|
|
|
|
|
|
|
|
|
|
|
|
|
|
|
|
|
|
|
|
|
|
|
|
|
|
|
|
|
|
|
|
|
|
|
|
|
|
|
|
|
|
|
|
|
|
|
|
|
|
|
|
|
|
|
|
|
|
|
|
|
Reports the front-panel Optic DDM metrics.
Common Attributes include:
port.group=
    -   The F5OS port group name associated with the Optic
-   ``` {#codeblock_cld_wtz_z1c}
 port.name="1.0"..
- The front-panel port number
channel=1..N
    -   For metrics which are per-channel, identifies the individual channel number
-   ``` {#codeblock_zkj_wtz_z1c}
direction="transmit" | "receive"
- An indication of transmit or receive direction
|
Metric Name |
Metric Type |
Value Type |
Attributes |
Unit |
|---|---|---|---|---|
|
|
|
|
|
|
|
|
|
|
|
|
|
|
|
|
|
|
|
|
|
|
|
| |
|
|
|
|
The schema of the CPU metrics is based on the OpenTelemetry semantic conventions. For more information, see Metrics Semantic Conventions
|
Metric Name |
Metric Type |
Value Type |
Attributes |
Unit |
|---|---|---|---|---|
|
|
|
|
|
|
|
|
|
|
The Disk IO Metrics are based on the OpenTelemetry semantic conventions. For more information, see Metrics Semantic Conventions
|
Metric Name |
Metric Type |
Value Type |
Attributes |
Unit |
|---|---|---|---|---|
|
|
|
|
|
|
|
|
|
|
|
|
|
|
|
|
|
|
|
|
|
|
|
|
|
|
|
|
|
|
|
|
|
|
|
|
|
|
|
|
|
|
|
|
|
|
|
|
|
|
The Memory Metrics are based on the OpenTelemetry semantic conventions. For more information, see Metrics Semantic Conventions
|
Metric Name |
Metric Type |
Value Type |
Attributes |
Unit |
|---|---|---|---|---|
|
|
|
|
|
|
|
|
|
|
|
|
|
|
|
|
|
|
|
|
The following tenant metrics are currently reported by the BIG-IP tenant into the F5OS platform layer. The metrics visible at the platform layer are only a limited subset of the total number of metrics available to the tenant. You can view the full tenant metrics by using the BIG-IP metric reporting capability.
This table lists the attributes that are associated with the tenant-based metrics.
|
Metric Name |
Metric Type |
Value Type |
Attributes |
Unit |
|---|---|---|---|---|
|
|
|
|
|
|
|
|
|
|
|
Metric Name |
Metric Type |
Value Type |
Attributes |
Unit |
|---|---|---|---|---|
|
|
|
|
|
|
|
|
|
|
|
Metric Name |
Metric Type |
Value Type |
Attributes |
Unit |
|---|---|---|---|---|
|
|
|
|
|
|
|
|
|
|
|
|
|
|
|
|
|
|
|
|
|
|
|
|
|
|
|
|
|
|
|
|
|
|
|
|
|
|
| |
|
|
|
|
|
Metric Name |
Metric Type |
Value Type |
Attributes |
Unit |
|---|---|---|---|---|
|
|
|
|
|
|
|
|
|
|
|
|
|
|
|
|
|
|
|
|
F5OS OpenTelemetry exporter will only report the metrics that are associated with the Docker containers managed by the platform layer. For more information about the docker container metrics, see Docker stats documentation.
|
Attributes |
Metric value type |
Description |
|---|---|---|
|
|
The name of the container |
|
|
The container image name |
|
Metric Name |
Metric Type |
Value Type |
Attributes |
Unit |
|---|---|---|---|---|
|
|
|
s |
|
|
|
|
| |
|
|
|
|
|
|
|
|
|
|
|
|
|
|
|
|
|
|
| |
|
|
|
|
The platform hardware sensors represent physical sensors associated with the hardware which measure: temperature, current, power, voltage, RPM and percent humidity.
f5os.sensor.name=
    Eamples:

    -   Temperature:
        -   Inlet
        -   Outlet
        -   Central
    -   Voltage:
        -   12V
        -   3.3V BCM
    -   Current:
        -   12V Main
        -   Current In
    -   Power:
        -   Controller Power
        -   Total Power Supply Unit \(PSU\) Power In
        -   Total Power Supply Unit \(PSU\) Power Out
-   ``` {#codeblock_onv_mj1_1bc}
f5os.sensor.source=<component name>
Eamples:
- psu-\[1..N\]
- fantray-\[1..N\]
- psu-controller-\[1..N\]
- blade-\[1..N\]
- controller-\[1..2\]
- platform
|
Metric Name |
Metric Type |
Value Type |
Attributes |
Unit |
|---|---|---|---|---|
|
|
|
|
|
|
|
|
|
|
|
|
|
|
|
|
|
|
|
|
|
|
|
|
|
|
|
|
|
|
An instrument is an area of metrics, which contain multiple metrics and can be enabled selectively.
Before configuring an exporter, you can display supported instruments from the CLI.
-
Connect using SSH to the management IP address.
-
Log in to the command line interface (CLI) of the system using an account with admin access.
When you log in to the system, you are in user (operational) mode.
-
Show the total and available instruments:
show system telemetry instrumentsThis example displays the available instruments:
appliance-1# show system telemetry instruments
NAME           DESCRIPTION
-------------------------------------------------------------------------------------
all            Report all logs and metrics produced by the F5OS platform layer
logs           F5OS platform log file through the OpenTelemetry 'log' API
platform       F5OS platform metrics such as: memory, disk, cpu, interface stats
hardware       F5OS hardware sensors such as: voltage, current, temperature, power, fan-speeds
optics         F5OS front-panel Optic DDM metrics
tenant         Low level tenant reported metrics such as: memory, disk, cpu interface stats
container      F5os Per-Container metrics such as: cpu, block-io, network, memory
An exporter defines an OpenTelemetry gRPC endpoint to which the F5OS Platform will push metrics/logs.
You can configure the exporter from the CLI.
-
Connect using SSH to the management IP address.
-
Log in to the command line interface (CLI) of the system using an account with admin access.
When you log in to the system, you are in user (operational) mode.
-
Change to config mode.
configThe CLI prompt changes to include
(config). -
Configure the exporter.
You must specify the IPv4 address or DNS name of the server and the port number of the server on which OpenTelemetry (OTEL) is running
system telemetry exporters exporter <*server name*> config endpoint address <*address*> port <*port number*> instruments <*instrument name*>A summary similar to this example displays:
appliance-1(config)# system telemetry exporters exporter server1 config endpoint address 10.144.74.171 port 4317 instruments platform -
Commit the configuration changes.
commit
After you configure the exporter, you can display the state of the exporter from the CLI.
You can configure the exporter from the CLI.
-
Connect using SSH to the management IP address.
-
Log in to the command line interface (CLI) of the system using an account with admin access.
When you log in to the system, you are in user (operational) mode.
-
Display the state of a specific exporter:
show system telemetry exporters exporterWhen you specify an exporter, a summary to this example displays:
appliance-1# show system telemetry exporters
system telemetry exporters exporter server1
state enabled
state endpoint address 10.144.74.171
state endpoint port 4317
state instruments [platform]
state options retry-enabled true
state options timeout 5
state options compression gzip
You can modify the configuration of an exporter from the CLI.
-
Connect using SSH to the management IP address.
-
Log in to the command line interface (CLI) of the system using an account with admin access.
When you log in to the system, you are in user (operational) mode.
-
Change to config mode.
configThe CLI prompt changes to include
(config). -
You can use the following commands to modify the exporter configuration:
-
Disable the exporter
system telemetry exporters exporter <*server name*> config disabledWhen you specify an exporter, a summary to this example displays:
appliance-1(config)# system telemetry exporters exporter server1 config disabled -
Modify option retry-enabled
system telemetry exporters exporter <*server name*> config retry-enabledA summary to this example displays:
appliance-1(config-exporter-server1)# system telemetry exporters exporter server1 config options retry-enabled Possible completions: false true appliance-1(config)# system telemetry exporters exporter server1 config options retry-enabled false -
Modify option timeout
system telemetry exporters exporter server1 config options timeout <*new value*>A summary to this example displays:
appliance-1(config)# system telemetry exporters exporter server1 config options timeout 10 -
Modify option compression
system telemetry exporters exporter server1 config options compression <*new value*>A summary to this example displays:
appliance-1(config)# system telemetry exporters exporter server1 config options compression zstd
-
-
Commit the configuration changes.
commit -
Return to user (operational) mode.
end -
You can verify the state of the exporter. see Display exporter state from the CLI.
You can add, modify, or delete the instruments that are configured for an exporter from the CLI.
-
Connect using SSH to the management IP address.
-
Log in to the command line interface (CLI) of the system using an account with admin access.
When you log in to the system, you are in user (operational) mode.
-
Change to config mode.
configThe CLI prompt changes to include
(config). -
You can use the following commands to modify the exporter configuration:
-
Add a new instrument
system telemetry exporters exporter <*server name*> config instruments <*instrument name*>A summary to this example displays:
appliance-1(config)# system telemetry exporters exporter server1 config instruments hardware -
Modify the instrument
system telemetry exporters exporter <*server name*> config instruments [<*instrument name*>]A summary to this example displays:
appliance-1(config)# system telemetry exporters exporter server1 config instruments [ optics ] -
Delete the instrument
no system telemetry exporters exporter <*server name*> config instruments <*instrument name*>A summary to this example displays:
appliance-1(config)# no system telemetry exporters exporter server1 config instruments platform
-
-
Commit the configuration changes.
commit -
Return to user (operational) mode.
end -
You can verify the state of the exporter. see Display exporter state from the CLI.
-
Connect using SSH to the management IP address.
-
Log in to the command line interface (CLI) of the system using an account with admin access.
When you log in to the system, you are in user (operational) mode.
-
Change to config mode.
configThe CLI prompt changes to include
(config). -
Delete the exporter:
no system telemetry exporters exporter <*server name*>A summary similar to this example displays:appliance-1(config)# no system telemetry exporters exporter server1
-
Commit the configuration changes.
commit -
Return to user (operational) mode.
end -
You can verify the state of the exporter. see Display exporter state from the CLI.