Updated Date: 07/07/2026
Dashboards
The VELOS system dashboards display relevant system information when you log in to the system controller or chassis partition webUI. For example, this figure shows how the default chassis partition is set up initially. This system has a blade installed in two slots, and all of those slots are assigned to the default chassis partition.
Both of the dashboards are divided into sections that show:
- Chassis partition details
- Active alarms
- High availability status
Chassis partition details on the system controller dashboard show an overview of all the chassis partitions. The chassis partition dashboard shows details about the chassis partition to which you are logged in.
Active alarms show system alerts that have occurred recently. The system updates the alarms every few seconds. It shows the source of the alert, its severity, a brief description of what occurred, and when it happened.
High availability status shows which system controller is currently active and whether the two controllers are both healthy. If both are healthy, the two system controllers handle traffic and are redundant, and the system is functioning normally.
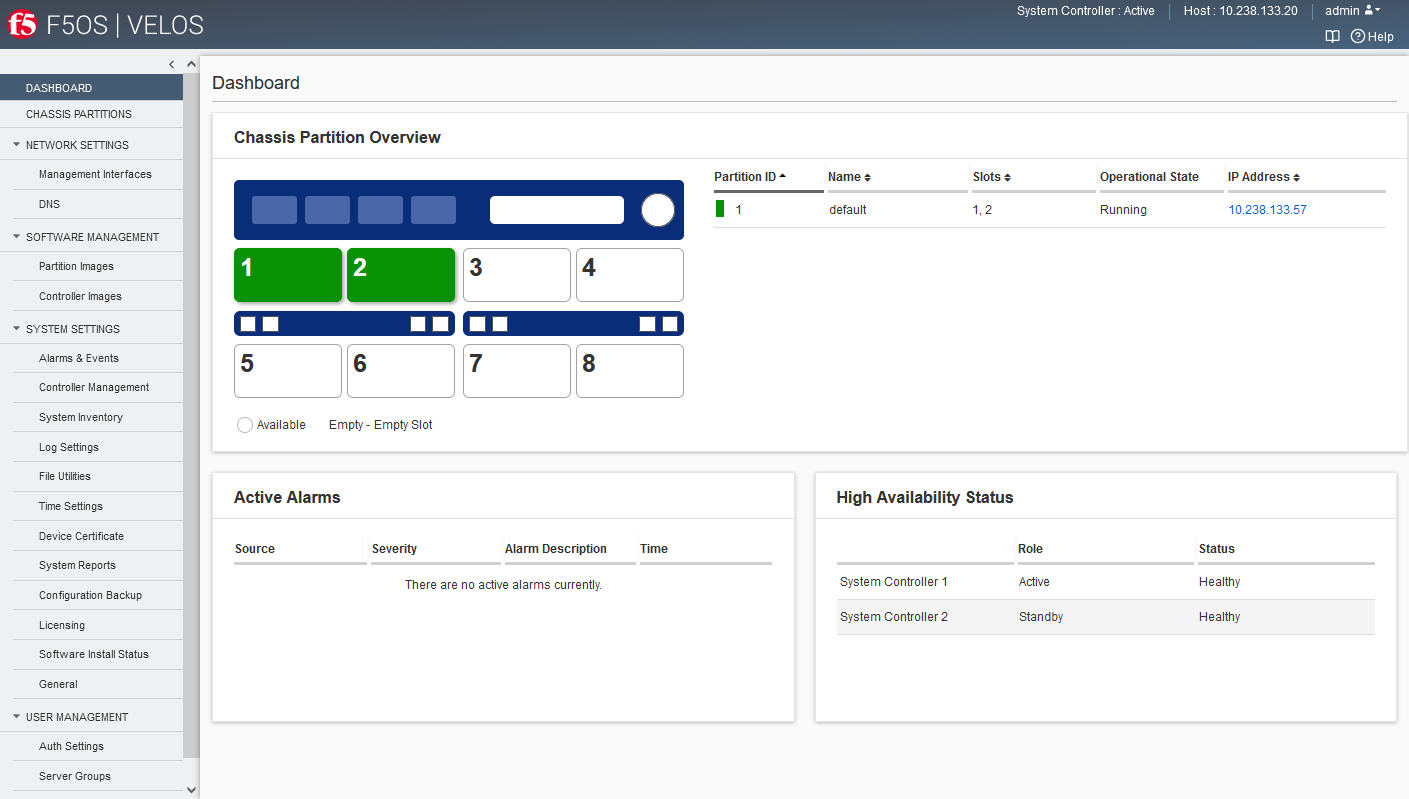
The system controller dashboard shows information about which slots have blades in them, how the chassis is divided into chassis partitions, active alarms, and system controller high availability status. It displays when you log in to the system controller webUI, or click DASHBOARD from any other area in the system controller webUI.
This system has blades in slots 1 and 2. The chassis partition named custpart is running on those two slots. The default chassis partition is associated with slots 5, 6, 7, and 8, but those slots and slots 3 and 4 are all empty.
The Chassis Partition Overview section shows a graphical view of the chassis
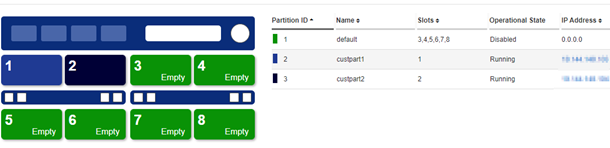
This system has three chassis partitions. Custpart1 is assigned to slot 1, and color coded in blue, and custpart2 is assigned to slot 2, and color coded in black. The slots associated with the default chassis partition are shown in green (but those slots are empty for now). Chassis partitions are listed in the table on the right. The IP address of an active chassis partition is shown as a link that you can click to log in directly to the chassis partition.
The chassis partition dashboard shows which chassis partition you are logged in to, which slots are associated with that chassis partition, active alarms for that chassis partition, and lists the tenants that are deployed in that chassis partition. This dashboard also shows the high availability status. It provides a quick overview of the chassis partition and displays when you log in to the chassis partition webUI or click DASHBOARD from any other area in the chassis partition webUI.
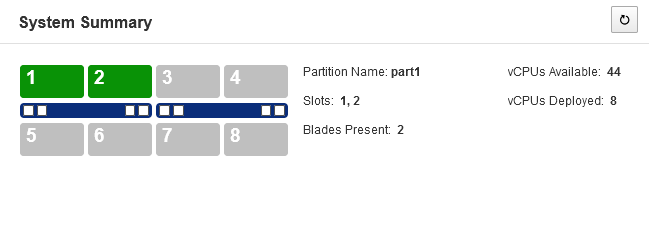
The System Summary section of the chassis partition dashboard shows a graphical view of the chassis and shows information only about the chassis partition to which you are logged in. In this example, you are logged in to a chassis partition named part1.
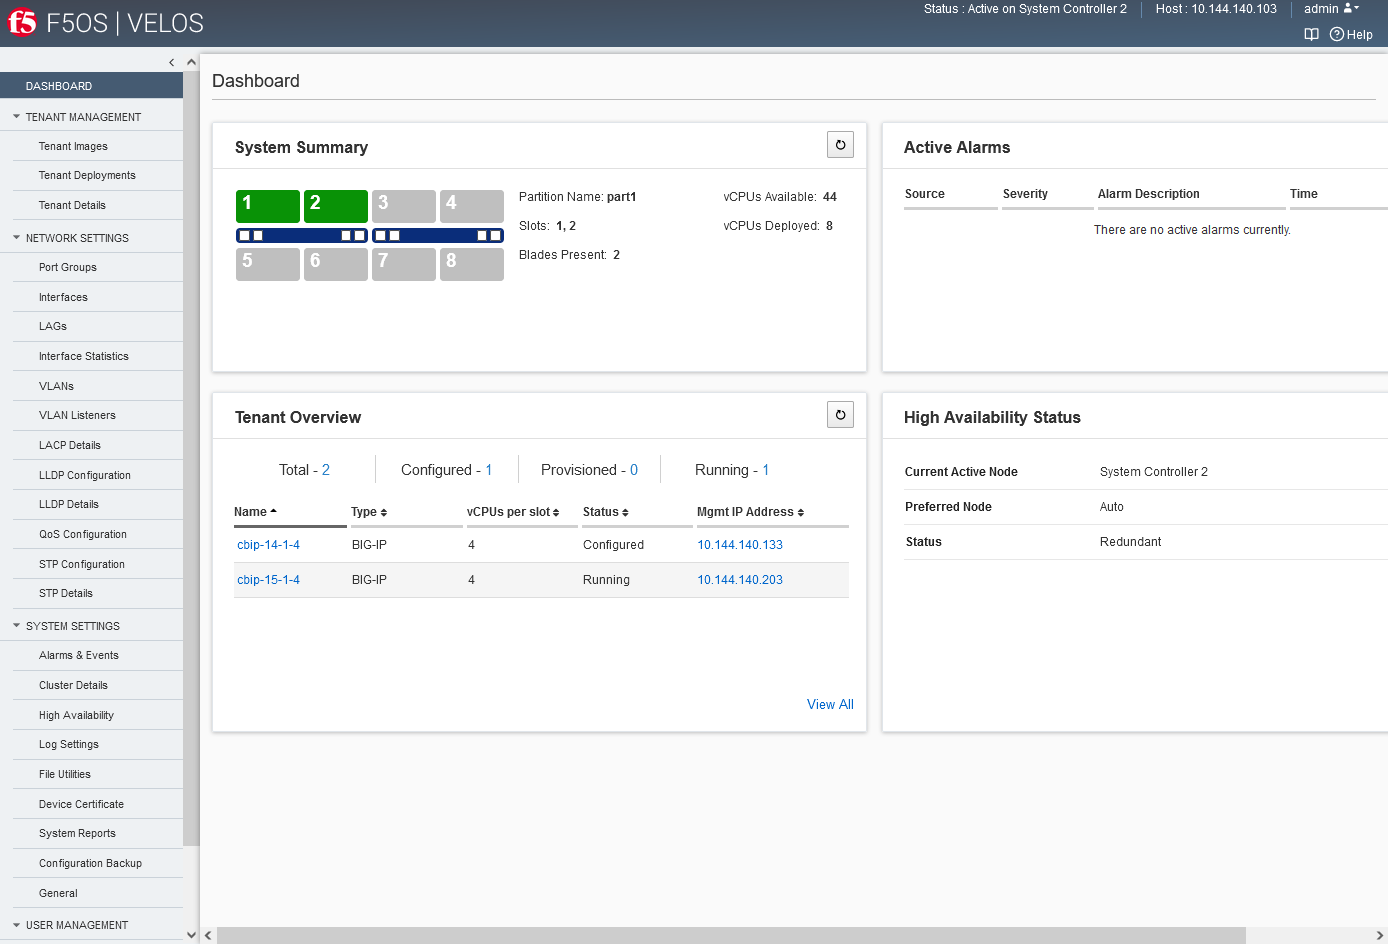
This chassis partition takes up slots 1 and 2 and uses 44 vCPUs. The details on the right summarize how many vCPUs are available, and how many are deployed and in use by the one tenant in that chassis partition.
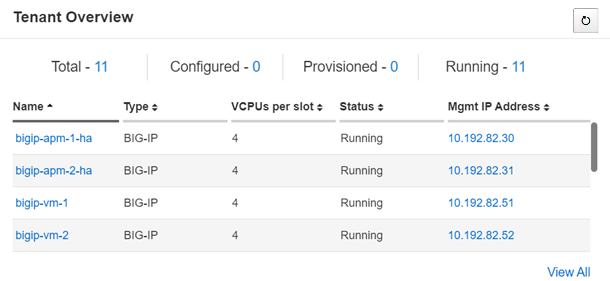
The Tenant Overview on another system lists several tenant deployments in the chassis partition, the type, number of vCPUs in use by the tenant, status, and management IP addresses. You can click the name of a tenant to view the tenant deployment information. Click the IP address to open the log in screen of the tenant in a new browser window. The View All button lists all of the tenants on a separate screen, with paging if needed.
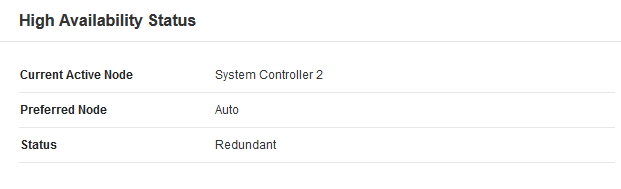
The High Availability Status for a chassis partition shows the active system controller, preferred node, and status. On the dashboard, Redundant indicates that the system is being backed up from the active system controller to the standby.