Applies To:
-
BIG-IP APM
21.0.0, 17.5.1, 17.5.0, 17.1.3, 17.1.2, 17.1.1, 17.1.0, 17.0.0, 16.1.6, 16.1.5, 16.1.4, 16.1.3, 16.1.2, 16.1.1, 16.1.0
Overview: Troubleshooting API protection using the dashboard
The BIG-IP Dashboard summarizes information about the overall system and provides specific information depending on which modules and features are licensed and provisioned. For example, you can view dashboards that show the system overview, local traffic management, API protection, access policy management, access policy support, and behavioral DoS so you can see what is happening at a glance in each area.
Here we focus on using the API Protection dashboard for troubleshooting how well your API servers are being protected. The dashboard can display analytics for both APM and Advanced WAF (ASM provisioned), if both are licensed and provisioned. Certain panels apply only to one or the other:
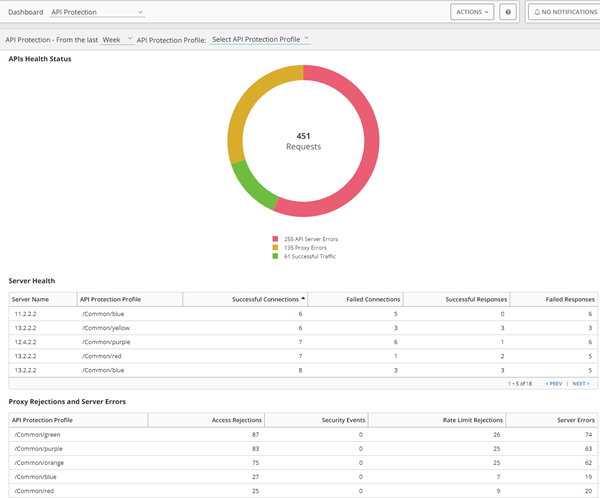
- APIs Health Status (APM required)
- Server Health (APM only)
- Proxy Rejections and Server Errors (APM required)
- Security Events (Advanced WAF/ASM required)
- Response Time Range (APM only)
The API protection dashboard has an overview screen that displays data for all API protection profiles.
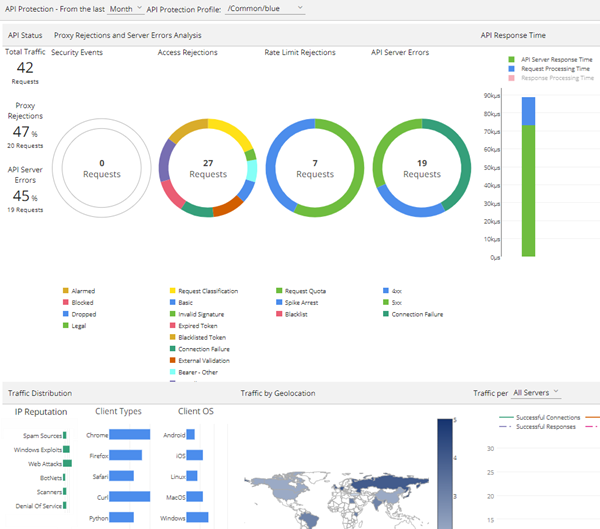
Or, you can drill down by selecting one API protection profile at a time to see more details including a traffic distribution chart showing traffic by geolocation.
By examining the API protection dashboard, you can troubleshoot potential problems on your system. If using APM, you can review the total number of requests, API server errors, rejections at the BIG-IP system (proxy errors), and determine the response time range for each API protection profile. If using Advanced WAF (with ASM provisioned), you can review security events that were flagged, such as web application attacks, bad source IP addresses, and malicious transactions.
-
API Protection Overview dashboard charts
The API Protection Overview Dashboard displays several charts that can be used for troubleshooting API servers. -
API Protection Profile dashboard charts
The API Protection Profile Dashboard displays several charts that can be used for troubleshooting API servers associated with one API protection profile.